EFFECT OF COLLARS AND BARS IN REDUCING THE LOCAL
SCOUR AROUND CYLINDRICAL BRIDGE PIERS
M.B. Mashahir*, A.R. Zarrati, M.J. Rezaei and M. Zokaei
Department of Civil and Environmental Engineering, Amirkabir University of Technology P.O. Box 15914, Tehran, Iran
[email protected] - [email protected] - [email protected] - [email protected]
*Corresponding Author
(Received: December 29, 2008 – Accepted: November 5, 2009)
Abstract In the present work, the efficiency of single and double collar in reducing scour rate and depth around cylindrical bridge piers was studied experimentally. In order to reduce the strength of wake vortices, different numbers of bars were also installed at the downstream face of the pier in combination with a single collar. The best result was achieved for double collar when the collars were installed at the streambed level and one pier diameter below bed level. With this arrangement the lower collar was not undermined after 80 hours of experiment, showing about 56 % reduction in scouring compared with an unprotected pier. It was also shown that by using collars, the rate of scouring decreased considerably. Though installation of bars did not significantly reduce the maximum depth of scour, it postponed the beginning of scouring at the upstream face of the pier.
Keywords Bridge Pier, Bar, Collar, Scouring, Time Development
ﻩﺪﻴﻜﭼ
ﻪﻧﺍﻮﺘﺳﺍﻱﺎﻫﻪﻳﺎﭘﻑﺍﺮﻃﺍ ﻲﮕﺘﺴﺷﺏﺁﻖﻤﻋﺶﻫﺎﮐﺭﺩﻕﻮﻃﻭﺩ ﻭﻕﻮﻃﮏﺗﺮﺛﺍﻖﻴﻘﺤﺗﻦﻳﺍﺭﺩﻪﺑﻱﺍ
ﺖﺳﺍﻪﺘﻓﺮﮔﺭﺍﺮﻗﻲﺳﺭﺮﺑﺩﺭﻮﻣﻲﻫﺎﮕﺸﻳﺎﻣﺯﺁﺕﺭﻮﺻ .
ﻪﺑﻦﻴﻨﭽﻤﻫ ﺏﺍﺩﺮﮔﺕﺭﺪﻗﺶﻫﺎﮐﺭﻮﻈﻨﻣ
ﺭﺩﻲﮕﺘﺳﺎﺧﺮﺑﻱﺎﻫ
ﻪﻠﻴﻣﻪﻳﺎﭘ ﺖﺸﭘ ﺎﻔﺘﺳﺍﺩﺭﻮﻣ ﻕﻮﻃﺎﺑﻩﺍﺮﻤﻫﻭﻩﺪﺷ ﻪﻴﺒﻌﺗﻪﻳﺎﭘ ﺖﺸﭘ ﺭﺩﮎﺯﺎﻧﻱﺎﻫ
ﺭﺍﺮﻗﻩﺩ ﺖﻓﺮﮔ . ﺶﻳﺎﻣﺯﺁﺞﻳﺎﺘﻧ ﺎﻫ
ﻪﺑﻡﻭﺩﻕﻮﻃﻭﺮﺘﺴﺑﺢﻄﺳﺭﺩﻝﻭﺍﻕﻮﻃﻭﺖﺷﺍﺩﺭﺍﺮﻗﻪﻳﺎﭘﻑﺍﺮﻃﺍﺭﺩﻕﻮﻃﻭﺩﻪﮐﺖﻟﺎﺣﻦﻳﺮﺘﻬﺑﺭﺩﻪﮐﺩﺍﺩﻥﺎﺸﻧ ﺏﺁ ﻖﻤﻋ ،ﺩﻮﺑ ﻩﺪﺷﺐﺼﻧ ﻥﺁ ﺮﻳﺯ ﻪﻳﺎﭘ ﺮﻄﻗﻩﺯﺍﺪﻧﺍ ﻩﺯﺍﺪﻧﺍ ﻪﺑ ﻲﮕﺘﺴﺷ
۵۶ ﺖﻓﺎﻳ ﺶﻫﺎﮐﺪﺻﺭﺩ .
ﻪﺠﻴﺘﻧ ﺱﺎﺳﺍ ﺮﺑ
ﺯﺍﺲﭘﺖﺴﺗﻦﻳﺍﺭﺩﻩﺪﻣﺁﺖﺳﺪﺑ ۸۰
ﺯﺍﺖﻋﺎﺳ ﺪﺸﻧﺍﺪﺟ ﺮﺘﺴﺑﺯﺍﻦﻳﺮﻳﺯﻕﻮﻃﺶﻳﺎﻣﺯﺁﻉﻭﺮﺷ
. ﻪﻌﺳﻮﺗﻦﻴﻨﭽﻤﻫ
ﺶﻳﺎﻣﺯﺁﻲﻧﺎﻣﺯ ﺏﺁﺥﺮﻧ ﺶﻫﺎﮐﺚﻋﺎﺑﻕﻮﻃﺩﻮﺟﻭﻪﮐﺩﺍﺩﻥﺎﺸﻧ ﺎﻫ
ﻲﻣﻲﮕﺘﺴﺷ ﺩﻮﺷ
. ﺶﻳﺎﻣﺯﺁﺞﻳﺎﺘﻧ ﻪﻠﻴﻣﺎﺑﺎﻫ
ﻱﺎﻫ
ﻥﺁﺯﺍﻩﺩﺎﻔﺘﺳﺍﺎﺑﻪﮐﺩﻮﺑﻥﺁﺯﺍﻲﮐﺎﺣﻪﻳﺎﭘﺖﺸﭘﺭﺩﮎﺯﺎﻧ ﺏﺁﻉﻭﺮﺷﺎﻫ
ﺮﻴﺧﺄﺗﻪﺑﻪﻳﺎﭘﻱﻮﻠﺟﻭﻕﻮﻃﺮﻳﺯﺭﺩﻲﮕﺘﺴﺷ
ﻲﻣ ﺩﺎﺘﻓﺍ . ﻥﺎﻤﻟﺍﻦﻳﺍﺯﺍﻩﺩﺎﻔﺘﺳﺍﻪﭼﺮﮔ ﺏﺁﻖﻤﻋﺶﻫﺎﮐﺭﺩﻱﺮﻴﺛﺄﺗﺎﻫ
ﺖﺷﺍﺪﻧﻲﻌﺿﻮﻣﻲﮕﺘﺴﺷ .
1. INTRODUCTION
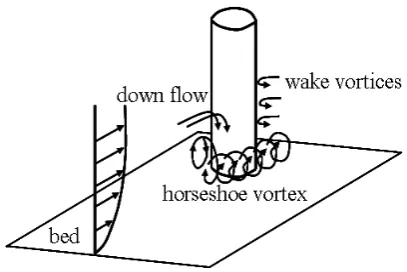
There are many bridges over waterways in the world. At many of these bridges, erosion of river bed is developed around the pier foundations. As a result, a high percentage of bridge failures in recent years have been attributed to scouring [1]. Pier scour is the erosion of the streambed in the vicinity of pier foundations due to complex vortex system. Mechanism of scouring has been extensively studied in the past [2-5]. Briefly, approach velocity stagnates at the upstream face of the pier, which this cause formation of a down flow parallel to the pier face (Figure 1). When down flow impinges the streambed, it digs a hole in front of the pier and rolls up and by interaction with the approach flow
forms a complex vortex system [6]. This vortex extends downstream and passes the sides of the pier. Owing to its similarity to a horseshoe this vortex is called horseshoe vortex. The horseshoe vortex deepens the scour hole in front of the pier until the shear stress on the bed material becomes less than their critical shear stress. The accelerating flow at two sides of the pier creates two slots in the streambed, which facilitate the transport of removed sediment from the scour hole at the upstream perimeter of the pier [6].
To protect piers against local scour, researchers have suggested different methods in the past years. There are basically two methods to control scouring around bridge piers: 1-armoring the streambed around the piers to withstand shear stresses during high flow events such as: using riprap [7-9], grout-filled bags, gabions [1], etc. 2-altering the flow alignment to break up vortices and reduce velocities in the vicinity of the piers, such techniques include the use of sacrificial piles placed upstream of the piers [10], collars constructed around the pier [11-16], Iowa vanes [17], slot [13,14], etc.
Following reports on good performance of collars in reducing scouring, efficiency of double collars and combination of collar and bars installed on cylindrical piers are studied experimentally in the present work.
2. APPLICATION OF COLLARS AND BARS
The effect of collar in reducing scour depth was previously studied on cylindrical piers [11-16]. The results of these studies are summarized in Figure 2. In this figure, Yo is water depth, Yd is height of collar above bed, W and D are effective width of the collar and the pier width respectively, Ys is depth of scour hole and Yso is depth of scour without collar. This figure shows that by increasing the width of the collar and lowering its elevation, the depth of the scour hole is reduced.
In addition to studies shown in Figure 2, Chiew [13] tested a collar with an effective width of three
times the pier diameter installed at 0.2D above the bed together with a slot 0.25D wide with a length of 2D near the bed and reported zero scour depth at the pier. Kumar, et al [14] concluded that with a collar at the bed when W is 4 times pier diameter, there will be no scour in front or at the sides of the pier, but a deep scour hole is formed at the pier's rear. It was also shown that the existence of a collar reduces the rate of scouring considerably [18]. Richardson, et al [19] used roughness elements with different sizes and spacing as a hydrodynamic countermeasure for local pier scour. Placement of roughness elements on the perimeter of piers increased the resistance to the down flow and consequently reduced depth of scour hole upstream of the pier up to 30 percent.
Experiments show that a collar installed at the streambed level protects the riverbed from the down flow and the accelerating flow at two sides of the pier. A collar installed on the pier divides the flow into two regions above and below the collar. For the region above the collar, it acts as an obstacle against the down flow and the down flow loses its strength on impingement at the collar. For the region below the collar, which is the results of approach flow penetrating below the collar, the strength of down flow and therefore the horseshoe vortex is reduced. When two collars are installed, the lower one also acts as an obstacle for the weaker down flow, which is formed below the upper one, could further reduce its strength, and protects the streambed.
Therefore when a collar is installed on a pier at the beginning of the experiment no scour hole is observed at the pier perimeter. However, a scour hole is formed downstream of the pier [14]. Wake vortices are obviously responsible for formation of this scour hole. The scour hole downstream of the pier is then extended gradually towards upstream and undermines the collar. If the scour hole reaches upstream of the pier, flow would penetrate below the collar. Penetration of flow below the collar causes the formation of the down flow and acceleration of scouring under the action of horseshoe vortex [15]. A second collar in a lower elevation could therefore prevent further development of scouring below the first collar. It may also be postulated that if by any means the strength of wake vortices is reduced, this may lead to reduction of scouring around the pier.
In this study, a single collar at the streambed level and double collars attached to the pier at different elevations were tested on a cylindrical pier. Bars were also attached downstream of the pier without any collar and also in combination with a single collar. In the latter arrangement, the collar was employed to reduce the strength of down flow and horseshoe vortex and bars for impeding the wake vortices.
3. EXPERIMENTAL PROCEDURE
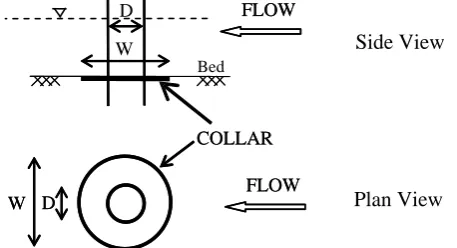
Experiments were carried out in a 10m long and 0.74 m wide horizontal flume. Collars with an effective width ‘W’ equal to three times the pier diameter ‘D’ were installed at the streambed level (Figure 3). Size and elevation of collars were selected based on the previous experience. Although wider collars are more effective, construction of collars wider than 3 times the pier diameter is considered impracticable. Moreover, the efficiency of a collar increases at lower elevations [11]. However, lowering a collar below the streambed level causes a deeper scour hole downstream of the pier and wider scour hole around the pier [15].
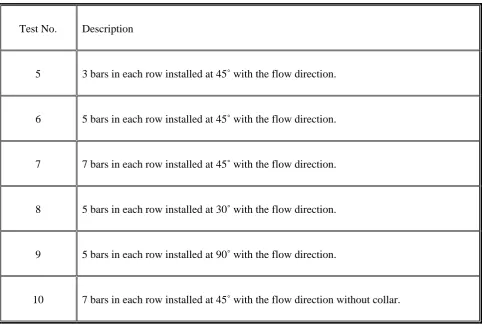
Bars in different numbers were installed at different angles at the downstream face of the pier. Bars were installed in such a way that they do not extend further from the projected area of the pier looking from upstream (Figure 4). This arrangement was used to prevent additional drag on the pier and the possibility of flowing debris being trapped by the bars when flow approach to the pier at zero angle of attack. Bars were installed in two symmetrical rows at 2 different angles of 30˚, 45˚ corresponding to the flow direction. Though bars with 90˚ angle with the flow direction are exposed to direct impact of the flow, a further test was carried out with 90˚ angle in order to compare its results with other angles. Length of the bars was 2.5 cm for 45˚ and 90˚ and 3.5cm for 30o arrangements. Rows consisted of 3, 5 or 9 bars in different experiments (Figure 4).
A triangular weir and a manometer were used to measure the flow discharge. A point gauge was used to measure flow and scour depth in the flume. The pier used in this study was a 0.04 m diameter Perspex pipe and collars were made from 2 mm thick Perspex sheets. The flume had a working section in the form of a recess below its bed which was filled with sediment and was located 6 m downstream from the flume entrance. Median size of the sediment was 0.95 mm, with geometric
0.00 0.20 0.40 0.60 0.80 1.00 1.20
-0.30 -0.20 -0.10 0.00 0.10 0.20
Yd/Yo
Ys/Yso
Chiew ,W/D=2(14)
Ettema ,W/D=2
Tanaka & Yano ,W/D=3 Tanaka & Yano , W/D=4 Tanaka & Yano ,W/D=5 Tanaka & Yano ,W/D=6
D
W Yd
Yo (13)
(12)
0.00 0.20 0.40 0.60 0.80 1.00 1.20
-0.30 -0.20 -0.10 0.00 0.10 0.20
Yd/Yo
Ys/Yso
Chiew ,W/D=2(14)
Ettema ,W/D=2
Tanaka & Yano ,W/D=3 Tanaka & Yano , W/D=4 Tanaka & Yano ,W/D=5 Tanaka & Yano ,W/D=6
D
W Yd
Yo D
W Yd
Yo (13)
(12)
standard deviation of sediment grading, less than 1.2. All tests were conducted at about threshold of sediment motion where maximum depth of scour hole is expected [20]. However according to Raudkivi, et al [21] a second peak may also exist at higher flow velocities. Moreover Chiew [13] explains that when general sediment transport occurs, trough of migrating bed forms may expose the pier beneath the collar and lowers its effectiveness. Studying the behavior of collars in live bed condition needs further research.
The threshold of sediment motion was found by experiment. Threshold of sediment motion was defined as flow condition at which the bed elevation, while the pier was not installed, does not change more than 2-3 mm after a long period of experiment (for example 5-10 hours). Tests showed that with 0.12 m flow depth and 0.028 m3/s discharge bed materials would be at initiation of motion. Therefore, this condition was selected
for all experiments. In these experiments, the ratio of shear velocity “u*” to the critical shear velocity u*c, calculated from the shields’ diagram was about 0.92. Shear stress at the working section was determined by calculating the water surface profile and slope of the energy line when pier was not installed. It should be noticed that by increasing
c *
*
u u
, the rate of scouring around the pier increases [22].
Two series of tests were performed. At first, the effectiveness of one collar and double collar at different elevations was studied. In the next step, combination of one collar at streambed level with bars attached to the pier was investigated. In addition, one test was carried out with bars only in order to check their efficiency on scour protection. All tests conducted in this study are summarized in Tables 1 and 2.
To find the maximum depth of scouring, experiments were continued until the scour depth did not change by more than 5 % of the pier diameter over a period of 24 hours [23]. This time was different from experiment to experiment and is mentioned in description of each experiment. Development of the scour hole was monitored at the upstream face of the pier where the maximum depth of the scour hole was expected. Depth of the scour hole at sides and rear of the pier was also measured.
4. EXPERIMENTAL RESULTS AND DISCUSSION
4.1. Test No. 1-Pier without Collar (Table 1)
Scouring around an unprotected circular pier started simultaneously at the upstream face of the pier due to the down flow and at the downstream of the pier under the action of wake vortices. The scour hole upstream of the pier was then developed under the action of horseshoe vortex. After 44 hours, maximum depth of scour was measured 92 mm at the upstream of the pier. The maximum depth of scour hole measured in these experiments was in good agreement with empirical equations (for example Melville, et al [24]). In this test 70 % and 90 % of the maximum scour depth occurred at 4 and 14 hours respectively. Time development of scouring in this test is shown in Figure 5.FLOW D
W
D
W
FLOW
COLLAR
FLOW D
W
FLOW
COLLAR
Side View
Plan View
Bed
Figure 3. Position of collar around a cylindrical pier.
COLLAR FLOW
BARS
BARS
FLOW Plan View
Side View
Bed
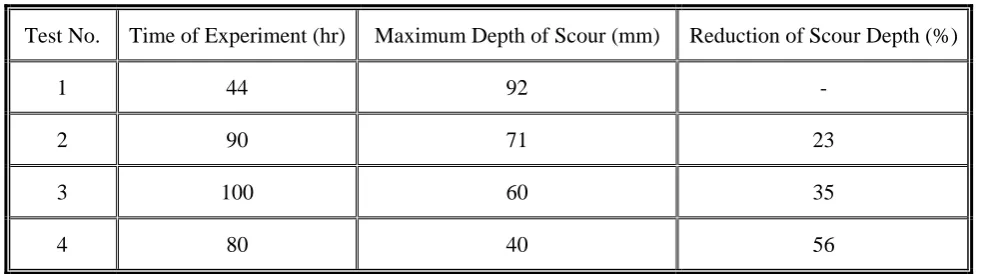
TABLE 1. Summary of Experiments with Single and Double Collar.
Test No. Description
1 Pier without collar.
2 Pier with one collar installed at the streambed level.
3 Pier with a collar installed at the streambed level and another collar at 0.5 D below the bed level.
4 Pier with a collar installed at the streambed level and another collar at 1.0 D below the bed level.
TABLE 2. Summary of Experiments with Collar and Bars.
Test No. Description
5 3 bars in each row installed at 45˚ with the flow direction.
6 5 bars in each row installed at 45˚ with the flow direction.
7 7 bars in each row installed at 45˚ with the flow direction.
8 5 bars in each row installed at 30˚ with the flow direction.
9 5 bars in each row installed at 90˚ with the flow direction.
4.2. Test No. 2-Pier with a Collar at the
Streambed Level (Table 1)
With a single collar at the streambed level, at the beginning of the experiment, scouring started downstream of the pier due to the action of wake vortices. These vortices were so strong that at the first 30 minutes, a 20 mm deep scour hole was formed downstream of the collar. At this time, no sign of scouring was observed due to the down flow and horseshoe vortex at the upstream face of the pier. Later in the experiment, two grooves were formed at two sides of the collar which later moved towards upstream along the rim of the collar. These grooves joined each other at the front edge of the collar after 1 hour of experiment. After 2 hours, beginning ofscouring was observed at the upstream face of the pier and after 8 hours the collar was completely undermined. By penetration of flow beneath the collar at its upstream edge, the rate of scouring increased. Maximum scour depth was measured 71 mm at the upstream face of the pier after 90 hours. At this time depth of the scour hole downstream of the pier was 55 mm.
Reduction of the maximum scour depth in this test defined as (Yso−Ys)/Yso, was therefore 23 % in comparison with the unprotected pier (Table 3). This agrees with 25 % maximum reduction reported by Tanaka, et al [11]. Time development of scouring in this test at the upstream face of the pier is showed in Figure 5. In this test 70 % and 90 % of
0 1 2 3 4 5 6 7 8 9 10
0.1 1 10 100
Time (hr)
Sc
o
u
r D
ept
h (
cm
)
Pier without any protection (Test No. 1-Table 1)
Single collar (Test No. 2 - Table 1)
Double Collars with 0.5D distance (Test No. 3 - Table 1)
Double Colars with 1.0D distance (Test No. 4 - Table 1)
Figure 5. Time development of scouring at the front face of the pier (Single and double collar).
TABLE 3. Results of Experiments with Single and Double Collar.
Test No. Time of Experiment (hr) Maximum Depth of Scour (mm) Reduction of Scour Depth (%)
1 44 92 -
2 90 71 23
3 100 60 35
the maximum measured scour depth occurred at 8.7 and 17 hours respectively. As can be seen from Figure 5, collar has considerably reduced the rate of scouring. Temporal variation of scouring is due to extension of scouring below the collar as is explained in Section 2. Before the upper collar is exposed scouring extends around the collar edge from downstream towards upstream very gradually. This scour hole originally is formed due to action of the wake vortices at the downstream of the pier. However after the collar was undermined the approach flow penetrates below the collar and down flow and horseshoe vortex again forms upstream of the pier (below the collar). Formation of the down flow cause a noticeable increase in scour rate as can be seen in Figure 5. Increase in scour depth continues till horseshoe vortex is weakened in the deeper scour hole and scouring approaches equilibrium condition.
4.3. Test No. 3-Pier with one Collar Installed
at the Streambed Level and Another Collar
at 0.5 D Below the Bed Level
In this test the scouring process was similar to the pier with a single collar until the front surface of the lower collar was exposed after about 4 hours. After this time, the rate of scouring reduced considerably due to lower collar protection against the down flow (Figure 5). Though scouring was developing gradually below the downstream edge of the lower collar, its upstream edge was not undermined until 35 hours from the beginning of the experiment. At this time, the deepest scour hole was about 20 mm below the lower collar at its downstream edge. When the lower collar was undermined at its upstream edge, the rate of scouring increased again. After 100 hours the rate of scouring was negligible based on the definition by Melville, et al [23]. Maximum depth of scour in this test at the upstream face of the pier was 45mm. At this time scour depth at the sides and rear of the pier were 60 mm and 40 mm respectively. Therefore, the maximum scour depth in this experiment was at sides of the pier. Occurrence of maximum scour depth at sides of the lower collar shows that the lower collar could better reduce the action of horseshoe vortex at the upstream head of the pier than the high stress zone at sides of the pier. High shear stresses at sides of the collar extend beyond the collar width and scouring at sides is more thanupstream face of the pier. Scour reduction in this test was as much as 51 % and 35 % for front and sides of the pier respectively in comparison with the maximum depth of scour in an unprotected pier (Table 3). This test showed that installation of the second collar at 0.5 D below the bed level would further reduce the scouring rate and depth. Time development of scouring at the upstream face of the pier is shown in Figure 5 and temporal variation of scouring below the collar as is explained in Section 4.2. When scouring is deepened and the second collar is expose the same scenario repeats and scouring rate is reduced and a scour hole forms downstream of the lower collar under the action of the wake vortices, extends upstream at the edge of the collar very gradually and scour rate is very low till the lower collar is also undermined and another down flow is formed below it. This down flow though is very weak but it again increases the rate of scouring.
Measurements showed that extension of the scour hole in this test towards upstream and at pier sides was 2 D and 2.5 D respectively compared to Test 1 where they were 2.6 D and 3.25 D respectively. Figure 5 Shows time development of scouring at the upstream face of the pier in this test.
4.5. Experiments with a Single Collar and
Bars (Table 2)
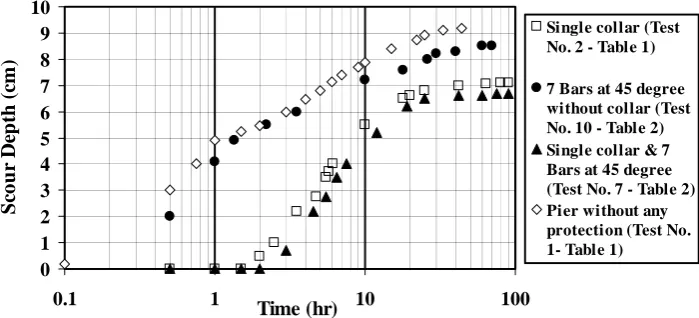
Experiment with a single collar at streambed level showed that though collar protects the streambed from the down flow, a scour hole is formed downstream of the pier under the action of wake vortices. This scour hole then developed upstream and undermined the collar. After this stage, flow penetrated below the collar and scouring was intensified. It was therefore decided to install bars on the pier to reduce the strength of the wake vortices by disturbing the flow at the separation zone (Figure 4).In the first series of tests, experiments were conducted with two symmetric rows of bars installed at 45˚ angle with the flow direction. In each row 3, 5 and 7 bars were used in different tests, each bar 2.5 cm long. In each row one bar was located at the bed level and one at water surface. Other bars were installed with equal distance between these two (Figure 4).
Test with bars and collar continued for 90 hours when variation of scour depth was negligible. At this time maximum depth of scouring was measured 67 mm. Based on experimental results application
of bars with different arrangements together with a single collar reduced scouring by about 27 % in comparison with an unprotected pier. Therefore the effect of bars on reducing depth of the scour hole compared with a single collar was insignificant. Time development of scouring for 7 bars with a collar (Test No. 7, Table 2) is compared with a single collar without bars in Figure 7. As can be seen from this figure, with bars installed on the pier, the beginning of scouring at the upstream face of the pier is postponed. However, when collar is undermined scouring is developed with similar rates compared to Test No. 2, i.e. single collar without bars (Figure 7). Other tests with different bars arrangement had a similar result.
In the next test, 7 bars were installed at two rows each 45˚ similar to Test 7 but without a collar (Test No. 10, Table 2) to check the efficiency of bars when used alone. This test continued up to 70 hours. Results of this experiment also showed that effect of bars in reducing the scour whole depth is insignificant.
5. SUMMARY AND CONCLUSIONS
Efficiency of collars in reducing local scour around bridge piers with circular and rectangular cross-sections was shown in previous studies. In the present work efficiency of single as well as double collar was studied experimentally on cylindrical piers. All collars used in these studies were 3 times wider than the pier diameter. Tests were carried out at the threshold of sediment motion where maximum scouring is expected. By measuring the time development of scouring it was shown that collar reduced the rate of scouring to a great extent. As the collar was undermined, the rate of scouring increased. Therefore, to reduce both the rate and maximum depth of scouring a second collar was installed at a lower elevation. The most efficient arrangement was when one collar was placed at the streambed level and another was installed one pier diameter below the bed level. In this arrangement the lower collar was not undermined after 80 hours of experiment and therefore, reduction of scouring was about 56 % compared to an unprotected pier. On the other hand, efficiency of a single collar and double collar with one collar at bed level and the second one half pier diameter below the bed level
was 23 % and 35 % respectively. It should be noticed that with reduction of the maximum scour depth, the extent of the scour hole is also reduced. Bars were installed at the downstream face of the pier in combination with a single collar and without a collar to reduce the strength of wake vortices. Bars were used in different numbers and at different angles with the flow. Though installation of bars did not significantly reduce the maximum depth of scour, it postponedthe beginning of scouring at the upstream face of the pier.
6. NOTATION
Yo = Water Depth Yd = Height of Collar
W = Effective Width of the Collar D = Pier Width
Ys = Depth of Scour Hole
Yso = Depth of Scour Without Collar
7. REFERENCES
1. Melville, B.W. and Coleman, S.E., “Bridge Scour”, Water Resources Publications LLC., Colorado, U.S.A., (2000).
2. Chabert, J. and Engeldinger, P., “Etude Des Affouillements Autour des Piles des Ponts”, (Study on Scour around Bridge Piers), Laboratoire National d'Hydraulique, Chatou, France, (1956).
3. Hjorth, P., “Study on the Nature of Local Scour”, Bulletin Series A, No. 46, Dept. Water Resources Eng., Lund Inst. of Tech., (1975).
4. Melville, B.W. and Raudkivi, A.J., “Flow Characteristics in Local Scour at Bridge Piers”, J. of Hydraulic Research, Vol. 15, (1977), 373-380.
5. Dargahi, B., “Controlling Mechanism of Local Scouring”, J. Hydraulic Eng., ASCE, Vol. 116, No. 10, (1990), 1197-1214.
6. Raudkivi, A.J., “Loose Boundary Hydraulics”, Balkema., Rotterdam, The Netherlands, (1998).
7. Chiew, Y.M. and Lim, F.H., “Failure Behavior of Riprap Layer at Bridge Piers under Live-Bed Condition”, J. Hydraulic Eng., ASCE, Vol. 126, No. 1, (2000), 43-55.
8. Chiew Y.M., “Mechanics of Riprap Failure at Bridge Pier”, J. Hydraulic Eng., ASCE, Vol. 121, No. 9, (1995), 635-643.
9. Lauchlan, C.S. and Melville, B.W., “Riprap Protection at Bridge Piers”, J. Hydraulic Eng., ASCE, Vol. 127, No. 5, (2001), 412-418.
10. Melville, B.W. and Hadfield, A.C., “Use of Sacrificial Piles as Pier Scour Countermeasures”, J. Hydraulic Eng., ASCE, Vol. 125, No. 11, (1999), 1221-1224. 11. Tanaka, S. and Yano, M., “Local Scour around a
Circular Cylinder”, Proc. 12th Congress, IAHR, Delft, Netherlands, (1967), 193-201.
12. Ettema, R., “Scour at Bridge Piers”, Report, No. 216, School of Engineering, University of Auckland, Auckland, New Zealand, (1980).
13. Chiew, Y.M., “Scour Protection at Bridge Piers”, J. Hydraulic Eng., ASCE, Vol. 118, No. 9, (1992), 1260-1269.
14. Kumar, V., Ranga Raju, K.G. and Vittal, N., “Reduction of Local Scour Around Bridge Piers using Slots and Collar”, J. Hydraulic Eng., ASCE, Vol. 125, No. 12, (1999), 1302-1305.
15. Zarrati, A.R., Gholami, H. and Mashahir, M.B., “Application of Collar to Control Scouring Around 0
1 2 3 4 5 6 7 8 9 10
0.1 1 10 100
Time (hr)
Sc
o
u
r D
ep
th
(c
m
)
Single collar (Test No. 2 - Table 1)
7 Bars at 45 degree without collar (Test No. 10 - Table 2) Single collar & 7 Bars at 45 degree (Test No. 7 - Table 2) Pier without any protection (Test No. 1- Table 1)
Rectangular Bridge Piers”, J. of Hydraulic Research, Vol. 42, No. 1, (2004), 97-103.
16. Zarrati, A.R., Nazariha, M. and Mashahir, M.B., “Reduction of Local Scour in the Vicinity of Bridge Pier Groups Using Collars and Riprap”, J. Hydraulic Eng., ASCE, Vol. 132, No. 2, (2006), 154-162.
17. Lauchlan, C.S., “Pier Scour Countermeasures”, Rep. No. 590, School of Engineering, University of Auckland, Auckland, New Zealand, (1999).
18. Mashahir, M.B. and Zarrati, A.R., “Effect of Collar on Time Development of Scouring around Rectangular Bridge Piers”, Proc. 5th International Conference on Hydroscience and Engineering, Warsaw, Poland, (2002).
19. Richardson, J.R. and York, K., “Hydrodynamic Countermeasures for Local Pier Scour”, Journal of the Transportation Research Board, TRB, No. 1375,
Washington, D.C., (1999), 186-192.
20. Breusers, N.H.C. and Raudkivi, A.J., “Scouring”, 2nd Hydraulic Structures Design Manual. IAHR, A.A. Balkema/Rotterdam, Netherlands, (1991).
21. Raudkivi, A. and Ettema, R., “Clear Water Scour around Cylindrical Piers”, J. Hydraulic Eng., ASCE, Vol. 109, No. 3, (1983), 338-350.
22. Mashahir M.B., Zarrati, A.R. and Mokallaf, E., “Effect of Bed Shear Stress on Development of Scouring around Bridge Piers Protected by a Collar”, Proc. 32nd Congress, IAHR, Venice, Italy, (2007).
23. Melville, B.W. and Chiew, Y.M., “Time Scale for Local Scour at Bridge Pier”, J. Hydraulic Eng., ASCE, Vol. 125, No. 1, (1999), 59-65.
![Figure 2. Scour reduction efficiency of collar on circular piers [13].](https://thumb-us.123doks.com/thumbv2/123dok_us/240236.2018706/3.595.146.453.84.300/figure-scour-reduction-efficiency-collar-circular-piers.webp)