SPECIAL ISSUE: The Dynamics and Value of Ecosystem Services: Integrating
Economic and Ecological Perspectives
Designing an integrated knowledge base to support
ecosystem services valuation
Ferdinando Villa
a,*
,1, Matthew A. Wilson
a,1, Rudolf de Groot
b,
Steven Farber
c, Robert Costanza
a,1, Roelof M.J. Boumans
a,1aInstitute for Ecological Economics,Uni6ersity of Maryland,PO Box38,Solomons,MD20688,USA bInternational Centre for Integrati6e Studies(ICIS),Maastricht Uni6ersity,Maastricht,The Netherlands
cGraduate School of Public and International Affairs,Uni6ersity of Pittsburgh,Pittsburgh,PA,USA
Abstract
Quantifying the value of ecosystem services is important for the social recognition and acceptance of ecosystem management across multiple geographic scales. Yet, the data required to perform such quantifications and the dynamic models that allow the projection of policy changes into the future are currently scattered, incomplete, and difficult to use. We describe the design of the Ecosystem Services Database (ESD), an integrated, web-accessible knowledge base that links a relational database for temporally and spatially explicit data to dynamic simulation models. The ESD architecture supports unit standardization, scale translation in space and time, and statistical analysis. Process-based dynamic models and valuation methods can be run by end users either through a web-based simulation engine or on their own computers by means of open-source software. The knowledge base will serve as: (1) a communication tool for use by researchers in several fields; (2) an analytical tool for meta-analysis, synthesis, and prediction; (3) an educational tool to disseminate knowledge on ecosystem services and their valuation; (4) a collaborative tool for institutions involved in different aspects of ecosystem service valuation; and (5) a prototype for linking databases and dynamic models. © 2002 Elsevier Science B.V. All rights reserved.
Keywords:Ecosystem; Dynamic; Knowledge base; Meta-analysis
This article is also available online at:
www.elsevier.com/locate/ecolecon
1. Introduction
Quantifying the value of ecosystem services has become an important vehicle for assuring social recognition and acceptance of the public manage-ment of ecosystems (Costanza et al., 1997; Daily, 1997; Wilson and Carpenter, 1999). For example, in 1992 the environmental benefits database of the US EPA’s Economic Analysis and Resource Branch contained at least 1600 studies related to
* Corresponding author. Tel.: +1-410-326-7446; fax: +1-410-326-7354
E-mail address:[email protected](F. Villa). 1
As of 09/01/2002, this author can be reached at the Gund Institute for Ecological Economics, University of Vermont, School of Natural Resources, George D. Aiken Center, Burlington VT 05405-0088, USA.
the economic valuation of environmental benefits (Association of Environmental and Resource Economists, 1992). There is a rapidly growing literature on methods and case studies for eco-nomic valuation of particular ecosystems such as wetlands (Barbier et al., 1997), forests (Kramer et al., 1995), particular ecosystem commodities such as water (Smith and Desvousges, 1986; Postel and Carpenter, 1997), species such as the whooping crane (Bowker and Stoll, 1988), or even biodiver-sity (Pearce and Moran, 1994) and climate (Adams, 1989; RCG/Hagler Bailly, 1995; Glantz, 1992). These estimated values and their associated methodologies have been used in cost-benefit analyses for environmental management (Hanley and Spash, 1993), meta-analyses of ecosystems (Brouwer et al., 1997; Smith and Huang, 1995), and natural resource damage assessment (Kopp and Smith, 1993).
The ability to use this information will depend upon both its quality and accessibility. As valua-tion methodologies become established, we expect that more case studies will be published in work-ing papers, government reports, and consultant studies. This will bring the challenge of informa-tion accessibility and data comparability into fo-cus as decision makers are forced to extend their reach beyond peer-reviewed journals and library databases to quantify the value of ecosystem services.
In order to use existing information in new contexts, decision makers must also face the chal-lenge of benefit transfers (Brookshire and Neill, 1992). For example, in developing countries and small communities, policy makers may be unable to fund valuation research, which is very expen-sive to initiate and maintain. As a result, they will need ways to transfer the results of studies from other contexts to their particular situation. Benefit transfers require information on methods and units of measurement, as well as the social, eco-logical and economic context of valuation studies. To compare ecosystem service values across geographic regions we must, therefore, be able to verify all the components that went into their formulation — not just the results but also the raw data, the valuation methods and the documented analytic streams that produced the results. We
believe that establishing and encouraging open collaboration among users of a common knowl-edge base will greatly enhance ecosystem valua-tion research across multiple geographic scales. Open-source research (Schweik and Grove, 2000) describes a situation where scientists collaborate freely and share data, statistical analyses, and results on the World Wide Web. Under the ‘open-source’ vision, the creative and productive powers of numerous individuals and research groups can be harnessed with the common goal of quantify-ing the value of ecosystem services and natural capital stocks across broad geographic regions and multiple spatial scales. In the case of ecosys-tem service valuation, a major obstacle — the lack of available information for both human and ecological systems — might be overcome by foster-ing the open sharfoster-ing of data sets, valuation tech-niques, and dynamic models.
To foster this vision, we have designed a fully
transparent, web-accessible knowledge base,
which will store and serve not only bibliographic information relative to environmental valuation studies, but also the actual raw data, algorithms, statistical models, and dynamic predictive models used. By using an innovative system design and interface, these elements can be reorganized and used to recalculate ecosystem service values using different methods, and the new results can be posted to the database for further review and revision. End-users will be able to replicate the original calculations, provide input at both the data and method level, and add new methods and estimation algorithms when new research makes them available.
2. The Ecosystem Services Database (ESD)
As part of a synthesis study supported by the National Center for Ecological Analysis and Syn-thesis (NCEAS, 2002 http://www.nceas.ucsb.edu) an initial estimate of the global value of ecosystem services was assembled (Costanza et al., 1997). This initial synthesis study stimulated much dis-cussion, media attention, and debate. The meth-ods used in the first synthesis were admittedly crude and imperfect, but they also pointed the way to improved assessments in the future. In particular, they pointed to the need to develop comprehensive ecological-economic databases and models that could adequately incorporate the complex interdependencies between human domi-nated ecosystems and natural ecosystems.
Currently, the data to support the valuation of ecosystem services are scattered and incomplete (Costanza et al., 1997). In response, the ESD project was envisioned at NCEAS to provide an integrated knowledge base coupling a relational factual database with a range of models — includ-ing statistical models and dynamic simulation models — in a form that is fully accessible from the World Wide Web. This will provide both a resource for the analysis and synthesis of ecosys-tem service values and a prototype for linking databases and models that can be applied to many other ecological problems. The ESD will need to represent diverse information (relating to data, processes, and values) in a highly integrated and accessible way. The most widely known web-accessible databases on ecosystem valuation are the Environmental Valuation Reference Inventory (EVRI, Canadian Ministry of the Environment Canada and EPA-USA: EVRI, 2002 URL) and ENValue (Environmental Protection Agency of New South Wales: EPA-NSW, 2002 URL). They are primarily bibliographic databases and do not contain raw data, models, or algorithms used for valuation. Furthermore, the development of EN-Value seems to have been abandoned, while EVRI is being actively funded and maintained, but is only accessible to researchers outside Canada for a steep annual fee. Other comprehensive sites illustrate the theory and practice of ecosystem valuation (e.g. King and Mazzotta, 2002 URL)
but do not host searchable databases. The ESD, in contrast, will be an open-access database con-taining not only bibliographic references and us-able data from studies and publications, but also explicit representation of functional ecological processes in a form directly suitable to incorpora-tion in simulaincorpora-tion models. The ESD engine and interface will have integrated dynamic modeling capabilities to enable the analysis of socio – eco-nomic and ecological values of natural capital. We will make computational and simulation ser-vices available directly over the World Wide Web, allowing users with standard web browsers to run and explore reasonably sized models remotely through the web interface; or to download work-ing model descriptions for local simulation, after selecting process information and data from the database with standard query operations.
The following sections describe the principal classes of knowledge represented in the ESD, its innovative technical and conceptual infrastruc-ture, and the conceptual background that allows the integration of very diverse and complex knowledge.
3. Classes of knowledge and their integration
Ecosystem valuation studies often require a very high level of aggregation of raw information, yet require very fine-grained and diverse informa-tion in order to be carried out. The classes of knowledge used by the ESD will reflect this dual-ity by grappling with special representational challenges and careful conceptual planning to pre-vent incompatibilities. This section outlines the main typologies of knowledge that need to be represented in the ESD and some corresponding representational issues.
and use will be briefly discussed in the next section.
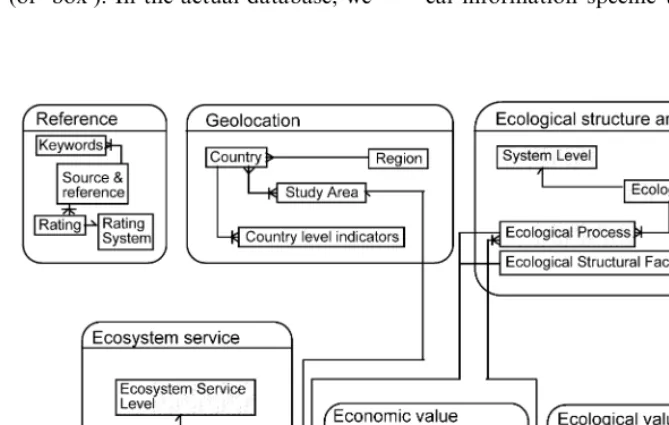
As Fig. 1 shows, named sectors in the data model represent different kinds of information. The user entry point for query and retrieval could be any of the sectors: for example, a user might want to conduct a search based on a reference to a published article, a particular biome, a specific ecosystem service, or all of these combined. The main classes of knowledge represented in Fig. 1 have peculiar representation needs and relevance within the ESD, and they are, therefore, given separate descriptions below.
3.1. Bibliographic reference
One aim of the ESD is to provide access to background information derived from published valuation studies. To obtain this, storage and appropriate classification of bibliographic infor-mation will be necessary. For simplicity, in Fig. 1 we represent the corresponding data model as a single entity (or ‘box’). In the actual database, we
provide for non-redundant keyword storage, au-tomatic thesaurus generation, and support struc-tures to implement a multi-standard rating system for quality of data and studies (see the section on quality control below for more detail).
Bibliographic references will be linked to al-most every other entity in the database and the corresponding information will be made accessible from query output pages. We will also provide the opportunity for users to create and operate upon views of the database that use only the informa-tion related to a particular set of references. In addition, since good bibliographic databases on environmental valuation exist (e.g. ENValue, EVRI), we are exploring the possibility of provid-ing direct links with the information contained in them.
3.2. Geographic information and country indicators
This section contains geographical and statisti-cal information specific to the different countries
of the world. The sources and contents of this information are detailed in the next section.
3.3. Ecosystem ser6ice
Ecosystem service is the central entity connect-ing diverse information within the ESD. Like other entities in the data structure, the storage of ecosystem services allows the representation of different levels of organization by incorporating structural information for single data entries. What Fig. 1 represents as a single box will corre-spond in the database to a tree — i.e. a data structure that represents an inclusive hierarchy of services with an arbitrary number of levels. Such a hierarchy will be explicitly referred to in user queries (through cascading selection menus) in order to obtain information at different levels of aggregation. For example, users will be able to refer to ‘Gas regulation’ in general — retrieving the aggregated values of different services like maintenance of CO2/O2 balance or UV-B protec-tion — or to refer specifically to one of these ser-vices. Tables with added structural information of this kind appear elsewhere in the database and are represented in Fig. 1 with a hatched pattern.
3.4. Ecosystem structure and function
Information on ecosystem structure and func-tion is important in several ways. If valuafunc-tion is made in the context of sustainability, values must be determined based upon their contribution to that objective. This means, for example, determin-ing the sustainable yield values of forest, which may differ substantially from forest yield values under existing management. Many ecosystem pro-cesses, such as energy transformation, biogeo-chemical cycling and food web interactions, have direct ecological values that can be estimated and stored in physical units along with their distribu-tion parameters (e.g. kcal, C-budgets, and species diversity). Information on the underlying ecosys-tem structural components and processes provide clues to the substitutability of ecosystem services which, in turn, helps to determine the most appro-priate economic valuation methods.
3.5. Economic 6alue
The concept of economic value is key to the data model of the ESD. The economic values of ecosystem services are estimated using a wide range of available methods (see Farber et al., this issue). Not all valuation techniques are equally suited for all ecosystem services, and in some cases several techniques may need to be used jointly due to multiple scales of analysis and different data requirements (see DeGroot et al., this issue). Each valuation technique has different data needs and range of applicability across spa-tial and temporal scales. Moreover, some valua-tion methods are likely to need the support of projective or predictive dynamic models. Again, the ESD must contain, along with the valuation methods themselves, all the data and the models that are needed to support the valuation activity. In addition to obvious issues like currency com-patibility, several less intuitive aspects and distinc-tions are crucial and need to be part of the knowledge model. First, economic valuations can be welfare- or impact-based. Welfare-based valua-tions determine the difference that environmental services make to the well-being, incomes, or costs to people. Monetary valuations of welfare are often based on willingness to pay or to accept compensation for services. Impact valuations reflect how services change the economic or social context. For example, a loss of mangroves may result in the loss of 100 fishermen’s jobs; at an income of $10 000 per fisherman, this is the equiv-alent of a $1 million economic impact, but if these fishermen were to obtain alternative employment, at $8000 per fisherman, the welfare loss in lost income would only be $200 000. The knowledge model must be able to make a clear distinction between these two types of values.
are more complicated. More mangroves would not only result in greater catch per unit effort, but would likely induce more effort; so the total effect of increased mangroves has two parts, an effi-ciency effect (partial) and a scale effect (general equilibrium). Establishing general equilibrium val-uations requires knowledge of how an entire sys-tem of interrelated activities will respond to some change in that system.
Third, large-scale services are not likely to be easily quantified on a partial valuation basis. For example, alterations in climate will have signifi-cant spatially distributed impacts on forested ecosystems. Understanding the economic implica-tions of climate change for the world’s forests requires a full equilibrium modeling of forest growth, harvest and trade. Simplistic, marginal alterations in localized forest supply and demand conditions will not adequately capture the full value of climate services for forests. Thus, general equilibrium models of interrelated forest markets will be necessary. Climate and forestry models may be able to predict the changes in tree growth regionally, but establishing the economic value of tree growth across regions is more complicated than simply multiplying the full welfare value of an acre of trees by the acre equivalent loss or gain in forest services. This becomes increasingly true for climate changes that substantially impact forest habitats.
Finally, it will be difficult to establish welfare valuation using simulation modeling of large scale changes in ecosystems, because such large-scale welfare valuations will likely be based on partial, or marginal, analyses. Instead, these simulations may have to be limited to impact valuations, such as impacts on GDP or some other aggregate indicator. Such valuations have found some use-fulness in understanding the implications of large scale, all pervasive impacts such as climate change policies (Weyant, 2000).
These considerations invite care in developing the meta-information that will qualify and allow using the valuation methods included in the data-base. From the point of view of the ESD, valua-tion methods are an integral component of the data, and as such can be searched for, retrieved, added and modified just like any other data component.
4. Achieving interoperability: the integrating modeling architecture
The integration of a diverse knowledge base under a common user interface poses both a conceptual and a technical challenge. Interoper-ability between data and models raises relatively simple challenges such as units and numerical domain, to highly complex ones such as scale and representation of time, space, and behavior. These issues apply equally to ‘static’ information (data) and ‘dynamic’ information (models). The role of dynamic process information in the ESD is multi-fold. First of all, models of various kinds are necessary for projection of known phenomena, scenario generation and analysis. Patterns of global change and environmental processes can be simulated to analyze the effects of particular deci-sions or decision-making strategies, or to project the consequences of current situations into the future. In addition, support functions such as parameter search, sensitivity analysis, and opti-mization can all be described and included in the database as specialized dynamic content.
Second, dynamic models are, in many cases, necessary to provide context for the static data. Due to the complexity and variety of paradigms and spatio-temporal scales with which natural processes can be represented (Villa, 1992, 2001), data describing ecological processes often only make practical sense in the reference context of a fully specified dynamic model. Any data model implies a conceptual model of the phenomena described, and the knowledge relative to the pro-cesses inducing change in the data is often a substantial and inseparable component of the knowledge model. All rates and stocks in the ecological component of the proposed database can, therefore, serve as parameters and initial conditions for a corresponding process-based model, explicitly indicated at the level of transfer equations.
time and space domains, and must indicate clearly and unambiguously the representational paradigm adopted (e.g. grid or polygons for spatial data; difference equations or Markov chains for dy-namic models). These concepts are at the core of the Integrating Modeling Architecture (IMA: Villa, 2001) project, whose foundations were laid in 1999 at the University of Maryland. The IMA allows integrated representation and use of multi-ple scale, multimulti-ple paradigm, static and dynamic knowledge models. The architecture ensures the interoperability of model component through for-mal specification of all the information needed to enforce it. The IMA model typologies can be extended at any time and in an uncoordinated way to support new representational paradigms.
The following paragraphs provide a brief intro-duction to the key architectural principles of the IMA and how they will be used in the ESD. The IMA web site (http:// www.integrated-modelling.org) should be used as an up-to-date reference for further information and distribution of the available software.
4.1. A common representation for interoperability
The IMA uses the Extensible Markup Lan-guage (XML: Harold, 1998) to encode the details of every model component or module (represent-ing data or dynamic models). XML, a trusted, industry-standard language framework applied in innumerable fields of science and engineering, al-lows coherent description of model components (modules) in a way that closely resembles the way web pages are laid out. The adoption of a tight declarative framework is the key to ensure clear, non-redundant specification of model components that can interoperate. Just like the DNA sequence provides a common language for the specification of all living beings, entities involved in a modeled system share an underlying uniform representa-tion that allows them to be checked for compati-bility, and when possible used together with full interoperability.
The IMA is designed to enforce discipline in model description and prevent misuse of reusable model components. The use of explicit units and explicit specification of time and space is
impor-tant in this sense: a module specifically developed to describe the dynamics of a watershed in China will not work blindly with data from the USA. Numerical boundaries and units can be specified for all required variables.
Similarly, documentation is an integral compo-nent of module specification. The format for ref-erences is compatible with common bibliography programs. Networked repositories such as the ESD can enforce that modules contain documen-tation for all their components.
4.2. Domains: beyond metadata
In conventional database applications, ‘meta-data’ are defined as information that describes the relationship between raw numbers and the world (either physical, such as geographic coordinates, or disciplinary, such as bibliographic references). The IMA goes beyond the conventional idea of metadata by separating the representation of the world from the actual data objects: modules are exposed to aspects such as time and space by ‘adopting’ these aspects at the request of the user. The key abstraction allowing this is the domain, an evolution of the metadata concept. Domains are XML-specified objects that represent the way particular aspects of the world, such as time or space, are seen by a module. They are used in an IMA simulation to mediate and interpret the in-teraction between objects, allowing independence, consistency and generality in object specification. The adoption of the domain exposes a module to change and gives it virtual ‘eyes’ to look at the simulated world.
The most obvious domains are time and space. According to the domains adopted, modules will ‘see’ each other in different ways when used to-gether. This includes making all simulation com-ponents scale-aware. If, for example, a nutrient model stored in the database sees time as a se-quence of 1-s steps (time domain), and the
data-base user chooses to input a temperature
The same concept applies to other domains, such as space. A spatially explicit simulation using a grid- or polygon- based representation is trivial to create; it will suffice to retrieve the non-spatial model and to select spatially explicit data to sat-isfy its data requirements, from which the model will take the spatial extent, resolution and posi-tion. Modules whose spatial extent is larger than their resolution will be automatically replicated to cover the full extent. Such modules could be used unmodified in a grid- or polygon-based space, and in one, two, or three spatial dimensions.
The domain concept can be extended to provide existing objects with additional meaning and func-tionality without changing specification. For ex-ample, we can envision a validation domain that is qualified with data that the object is supposed to produce in the real world. At any given time, the state of the object with respect to ‘reality’ will be a measure of how the object’s simulated behav-ior matches observation. This information can be used, e.g. by automatic optimizer services that drive the simulation towards acceptable parame-ter values. Another domain that will be instru-mental in the ESD project will be the ‘value’ domain, qualified by attributes and priorities reflecting the definition of value, and using inter-operable, automatically converted currency units.
4.3. Search and retrie6al
The domains used by models also provide the key to efficiently searching the database. Each domain will correspond to a search page where a user of the ESD will be able to define the search domain in (e.g.) space, time, value, or documenta-tion. Search pages will use intuitive interfaces to make searching simple and efficient. As an exam-ple, the space domain will use interactive selection of areas from GIS maps. Simpler, quick-loading search pages will also be available as options for use in locations with poor network connectivity.
The modular nature of the IMA-driven ESD enables new search pages to be added whenever new domains are developed. The user will restrict the search space in the domains that are relevant to the purpose. For example, by browsing through the available domains, it will be possible
to select all the GIS coverages relative to North America that are relevant to global warming, or all dynamic models of denitrification that have been tested in marshes and forests.
4.4. Incremental composition of models
Each piece of information retrieved by the ESD user will be stored as part of a temporary, higher-level model. As new modules are retrieved, they become part of the temporary model. The user will then be able to visualize, modify, delete, or run the incrementally defined model at any time. The web-based IMA engine will take care of linking the information retrieved and keep the user informed of the model structure as it devel-ops. At the request of the user, it will also be able to create a simulation world (time, space, and other domains) and make the model accessible; a static model (e.g. a timeseries of GIS data) will just be displayed in the user’s browser, a dynamic model will be run and results displayed as the simulation progresses.
At any time, the user will be able to download the XML code of the model, which can then be emailed, placed on a web site for others to use, or downloaded to be simulated locally at the user’s leisure by means of freely available IMA software. However, users will not need to see the XML code unless they want to. The ESD will not contain material whose copyright would prevent the free exchange of the knowledge obtained and developed using it.
The IMA, like the ESD, is an open source project whose software is available to the public. Freedom of use and modification is guaranteed by the General Public License (FSF, 2002 URL). Contribution from interested parties is strongly encouraged both at the design and implementa-tion levels.
5. A web-accessible, multi-paradigm knowledge base.
5.1. Economic6alues from published studies
The database will be initially populated with the data that were used in the original Costanza et al. (1997) synthesis study. This will allow users to replicate the original study and to update it as new data are entered into the database. These data consist of about 120 independent published studies, carefully checked for relevance and con-sistency, and about 200 estimates of value for ecosystem services at the global and biome scales, expressed in both original and standardized units.
5.2. Geographic information and country indicators
To provide users of the ESD with important background information and to allow calculation of social and ecological indicators within the data-base post-processing engine, we will include and maintain a comprehensive database of country-level statistical information for the whole globe. This information will be obtained from the World Bank’s World Development Indicators (a data CD published by the World Bank) providing ba-sic economic statistics such as purchasing power parity, national and per capita GDP, basic demo-graphic statistics such as population, age struc-ture, fertility rates, and other health and quality of life statistics such as infant mortality and education rates. An attempt will also be made to provide information on measures related to environmental quality as they relate to health and infrastructure (e.g. water and air quality,
freshwater availability, or sewage treatment
infrastructure).
5.3. The global unified metamodel of the
biosphere(GUMBO)
Possibly the most intuitive way for a user to start exploring ecosystem services valuation is to use a global-scale model that can use available data for the whole planet. GUMBO (Boumans et al., this issue) is a global simulation model aimed at assessing the dynamics of ecosystem services. It is a metamodel in the sense that it represents a simplified version of several well-established
global models. Its resolution and complexity were chosen to meet the conflicting criteria of (1) enough complexity to capture the dynamic aspects and interconnections among the major global ecosystem services as listed in Costanza et al. (1997), and (2) enough simplicity to be distributed and run with limited computational resources and by a broad range of users.
GUMBO consists of five sectors or ‘spheres’: atmosphere, lithosphere, hydrosphere, biosphere, and anthroposphere (human systems). It is also divided into and calibrated for 11 biomes or ecosystem types which encompass the entire sur-face area of the planet: open ocean, coastal ocean, forests, grasslands, wetlands, lakes/rivers, deserts, tundra, ice/rock, croplands, and urban. These 11 biomes are an aggregation of the 16 biomes used in Costanza et al. (1997). The paper by Boumans et al. (this issue) provides extensive detail about the model’s structure, scope and application.
GUMBO will be integrated in the first release of the ESD. ESD users will be able to run global change scenarios of their choice through the web-based interface.
6. Update and quality control
6.1. Input of new information
In general, researchers will be able to submit new information through secure web forms, which will guide and organize the input of new informa-tion in different categories. The forms will not update the database directly, but will notify the submission to a database manager for review and possible incorporation into the ESD. We consider this process the only way to maximize security and ensure referential integrity. Issues to be con-sidered for submission guidelines are: (1) unit and value standardization; (2) formats for submitted factual information, references and dynamic mod-els; (3) integrity and proper reference to the
hi-erarchical characterizations developed for
ecological services, entities and processes. In gen-eral, only entries that contain all the information required to comply with the appropriate IMA constructs will be accepted. The translation into XML will be done by the database maintainers, with the help of automated software interfaces able to handle the most common data and model formats.
6.2. Quality control
Quality control is a critical issue for the success of the ESD. As a guideline, we will employ the following:
1. an Advisory Board will be established before the deployment of the fully operational ESD, including reviewers and representatives of the main users of the database (coming from sci-ence, policy-making, industrial advisory bodies and NGOs) to ensure adequate design, man-agement and access system for the database. 2. A database manager will be responsible for
entering data into the database, supported by a group of reviewers and technical staff to physically enter the data into the database. Data will be obtained both through active searches in libraries, other databases, etc. and through a submission form that will be avail-able on the database web site. The database manager will distribute submitted data and publications to a network of reviewers, cover-ing the main biomes and services (see point 3).
3. An international Review Committee will be involved in the review process, supported by a set of standardized guidelines to ensure com-parability of the quality control and rating system, which we will produce during the first year. This review committee will consist of a representative selection of individuals and or-ganizations that are knowledgeable about ecosystems (e.g. wetland or coral reef experts), their functions and services (e.g. system ecolo-gists) and/or economic valuation (e.g. resource economists). Before data are entered into the database, at least several members of the com-mittee must have reviewed the quality and validity of the submitted data.
The Advisory Board and Review Committee are important instruments to establish effective working relationships with the main organizations active in collecting and storing data on ecosystem services and values (e.g. EPA, IUCN, the World
Bank, Conservation International, LTER
network).
7. Conclusions
The web-accessible ESD will provide several important benefits, outlined below with a descrip-tion of its most important roles.
7.1. Communication tool
The ESD will provide a dynamic link between ecological and socio – economic data within the global system. By enabling meta-analysis and syn-thesis, it will contribute to the further develop-ment of the theory and practice of ecological
economics, fostering communication between
practitioners of the physical sciences, the social sciences and policy makers.
7.2. Analytical tool
com-parisons, benefit transfer). It will greatly facilitate and help standardizing the use of ecological – eco-nomic information in project evaluations and cost-benefit analysis.
7.3. Education and dissemination
The ESD will constitute an important tool for education and dissemination of knowledge about the valuation of natural capital and ecosystem services, both for educational institutions and the general public.
7.4. Collaboration
The ESD will stimulate collaboration and link-ages between national and international institu-tions engaged in ecological-economics studies of the natural environment, both through collabora-tive networks and the international scientific advi-sory group.
7.5. Prototype for linking databases and models
The ESD will serve as a prototype for linking relational databases and dynamic simulation models. The need for this kind of linkage is expanding rapidly as models become more com-plex and collaborative, and become a more and more established component of ecosystem knowl-edge. There are many potential uses for this kind of computational structure in several different disciplines. The modular nature of the ESD and the IMA will enable the easy transfer of the ESD engine to other research contexts. In addition, the open-source nature of the project will allow any-one with access to the World Wide Web to imple-ment and, if necessary, adapt the system for different needs.
Acknowledgements
This work was conducted as part of the Work-ing Group on the Value of the World’s Ecosystem Services and Natural Capital; Toward a Dynamic, Integrated Approach supported by the National Center for Ecological Analysis and Synthesis, a
Center funded by NSF (Grant cDEB-0072909),
the University of California, and the Santa Bar-bara campus. Additional support was also pro-vided for the Postdoctoral Associate, Matthew A. Wilson, in the Group. All the participants in the workshops contributed to the ideas expressed here. We wish to thank in particular NCEAS’s director J. Reichmann for his support, inspira-tional vision, and practical help, and R.V. O’Neill for his enlightening comments. Credit is also due to Serguei Krivov for helpful comments on the draft and contributing to the IMA ideas and project. The ESD project is funded by the US National Science Foundation, award 9982938 ‘A Web-Accessible Knowledge Base for the Inte-grated Analysis and Valuation of Ecosystem Services’.
References
Adams, R.M., 1989. Global Climate Change and Agriculture: An Economic Perspective. Am. J. Agr. Econ. 71 (5), 1272 – 1279.
Association of Environmental and Resource Economists, 1992. Benefits transfer: procedures, problems and research needs. Workshop report, Snowbird, Utah.
Barbier, E.B., Acreman, M., Knowler, D., 1997. Economic valuation of wetlands: a guide for policy makers and planners, (Ramsar Convention Bureau, Gland, Switzerland).
Bowker, J.M., Stoll, J.R., 1988. Use of dichotomous choice nonmarket methods to value the whooping crane resource. Am. J. Agr. Econ. 71, 373 – 381.
Brookshire, D.B., Neill, H., 1992. Benefit transfers: conceptual and empirical issues. Water Res. 28, 651 – 655.
Brouwer, R., Langford, I.H., Bateman, I.J., Crowards, T.C., Turner, R.K., 1997. A Meta-analysis of wetland contingent valuation studies. Working paper, (Centre for Social and Economic Research on the Global Environment, Univer-sity of East Anglia).
Costanza, R., d’Arge, R., DeGroot, R., Farber, S., Grasso, M., Hannon, B., Naeem, S., Limburg, K., Paruelo, J., O’Neill, R.V., Raskin, R., Sutton, P., van den Belt, M., 1997. The value of the world’s ecosystem services and natural capital. Nature 387, 253 – 260.
Daily, G., 1997. Nature’s Services: Societal Dependence on Natural Ecosystems. Island Press, Washington DC. EPA-NSW (URL), 2002. ENValue — A searchable
environ-mental valuation database. Environenviron-mental Protection Agency, New South Wales, Australia. Internet: http://
EVRI (URL), 2002. Environmental Valuation Reference In-ventory. Internet:http://evri1.ec.gc.ca/evri.
FSF (Free Software Foundation), URL, 2002. The General Public Licence (GPL). Internet: http://www.gnu.org/
copyleft/gpl.html.
Glantz, M.H., 1992. Climate Variability, Climate Change and Fisheries. Cambridge University Press, Cambridge, UK. Hanley, N., Spash, C.L., 1993. Cost-Benefit Analysis and the
Environment. Edward Elgar, England.
Harold, E.R., 1998. XML: Extensible Markup Language. IDG Books Worldwide.
Harrington, J.L., 1988. Relational Database Design. Academic Press.
King, D., Mazzotta, M., URL. Ecosystem Valuation home page. Internet:www.ecosystemvaluation.org.
Kopp, R.J., Smith, V.K., 1993. Valuing natural assets: the economics of natural resource damage assessment. Re-sources for the Future, Washington DC.
Kramer, R.A., Sharma, N., Munasinghe, M., 1995. Valuing Tropical Forests: Methodology and Case Study of Mada-gascar. The World Bank, Washington, DC.
NCEAS (National Center for Ecological Analysis and Synthe-sis) (URL): Working Group on the Value of the World’s Ecosystem Services and Natural Capital: Toward a Dy-namic, Integrated Approach. Internet: http://www.
nceas.ucsb.edu/fmt/doc?/cgi-bin/ppage.pl?project=151.
Pearce, D., Moran, D., 1994. The Economic Value of Biodi-versity. Earthscan Publications, London.
Postel, S., Carpenter, S., 1997. Freshwater ecosystem services.
In: Daily, G.C. (Ed.), Nature’s Services. Island Press, Washington, DC, pp. 237 – 254.
RCG/Hagler Bailly, 1995. The economic effects of climate change on US forests. Report prepared for Office of Pol-icy, Planning and Evaluation. US EPA, Washington, DC. Schweik, C. Grove, J.M., 2000. Fostering open-source re-search via a World Wide Web system. Public administra-tion and management: an interactive journal, 5(3). Internet: http://www.pamij.com/5 –4/5 –4–2–opensource.
html.
Smith, V.K., Desvousges, W.H., 1986. Measuring Water Qual-ity Benefits. Kluwer Nijhoff, Boston.
Smith, V.K., Huang, J.C., 1995. Can markets value air qual-ity? A meta-analysis of hedonic property value models. J. Polit. Econ. 103, 209 – 227.
Villa, F., 1992. New computer architectures as tools for eco-logical thought. Trends Ecol. Evol. 7, 179 – 183.
Villa, F., 2001. Integrating Modelling Architecture: a declara-tive framework for multi-paradigm, multi-scale ecological modeling. Ecol. Modell. 137, 23 – 42
Villa, F. (URL). Integrating Modelling Architecture. Home page. Internet:http://www.integratedmodelling.org. Weyant, J.P., 2000. An introduction to the economics of
climate change policy. Report prepared for the Pew Center on Global Climate Change. Arlington, VA.