GraSPy: Graph Statistics in Python
Jaewon Chung1,† [email protected]
Benjamin D. Pedigo1,† [email protected]
Eric W. Bridgeford2 [email protected]
Bijan K. Varjavand1 [email protected]
Hayden S. Helm3 [email protected]
Joshua T. Vogelstein1,3,4, ?
1Department of Biomedical Engineering, Johns Hopkins University, Baltimore, MD 21218
2Department of Biostatistics, Johns Hopkins University, Baltimore, MD 21218
3Center for Imaging Science, Johns Hopkins University, Baltimore, MD 21218
4Kavli Neuroscience Discovery Institute, Institute for Computational Medicine, Johns Hopkins
Uni-versity, Baltimore, MD 21218
†Denotes equal contribution
?Corresponding author
Editor:Alexandre Gramfort
Abstract
We introduceGraSPy, a Python library devoted to statistical inference, machine learning, and visualization of random graphs and graph populations. This package provides flexible and easy-to-use algorithms for analyzing and understanding graphs with ascikit-learn
compliant API. GraSPy can be downloaded from Python Package Index (PyPi), and is released under the Apache 2.0 open-source license. The documentation and all releases are available athttps://neurodata.io/graspy.
Keywords: Python, graph analysis, network analysis, statistical inference, machine learn-ing
1. Introduction
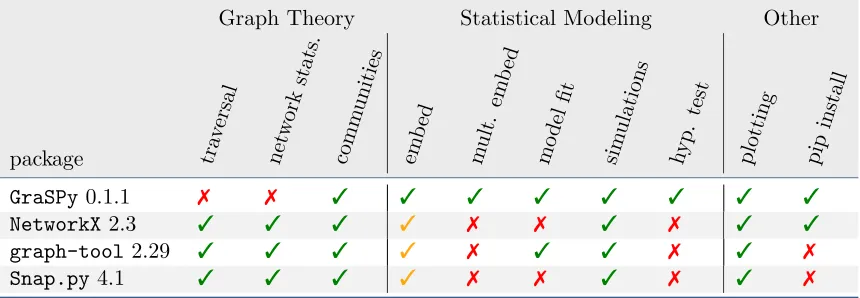
Graphs, or networks, are a mathematical representation of data that consists of discrete objects (nodes or vertices) and relationships between these objects (edges). For example, a brain can be represented with nodes corresponding to each brain region and edges rep-resenting the presence of a structural connection between regions (Vogelstein et al., 2019). Since graphs necessarily deal with relationships between nodes, classical statistical assump-tions about independence are violated. Thus, novel methodology is required for performing statistical inference on graphs and populations of graphs (Athreya et al., 2018). While the theory for inference on graphs is highly developed, to date, there has not existed a numerical package implementing these methods. GraSPy fills this gap by providing implementations of algorithms with strong statistical guarantees, such as graph and multi-graph embedding methods, two-graph hypothesis testing, and clustering of vertices of graphs. Many of the algorithms implemented inGraSPyare flexible and can operate on graphs that are weighted or unweighted, as well as directed or undirected. Table 1 provides a comparison of GraSPy
c
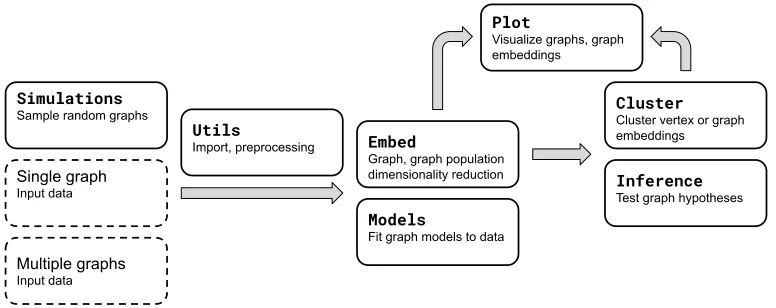
Simulations
Sample random graphs
Single graph Input data
Multiple graphs Input data
Utils
Import, preprocessing
Plot
Visualize graphs, graph embeddings
Embed
Graph, graph population dimensionality reduction
Models
Fit graph models to data
Cluster
Cluster vertex or graph embeddings
Inference
Test graph hypotheses
Figure 1: Illustration of modules and procedure for statistical inference on graphs, popula-tions of graphs, or simulated data. A detailed description of each module is given in Section 2.
to other existing graph analysis packages (Hagberg et al., 2008; Peixoto, 2014; Leskovec and Sosiˇc, 2016).
2. Library Overview
GraSPy includes functionality for fitting and sampling from random graph models, per-forming dimensionality reduction on graphs or populations of graphs (embedding), testing hypotheses on graphs, and plotting of graphs and embeddings. The following provides brief overview of different modules ofGraSPy. An example workflow using these modules is shown in Figure 1. More detailed overview and code usage can be found in the tutorial section of GraSPy documentation at https://graspy.neurodata.io/tutorial. All descriptions here correspond to GraSPyversion 0.1.1.
Simulations Several random graph models are implemented in GraSPy, including the
Erd˝os-R´enyi (ER) model, stochastic block model (SBM), degree-corrected Erd˝ os-R´enyi (DCER) model, degree-corrected stochastic block model (DCSBM), and ran-dom dot product graph (RDPG) (Holland et al., 1983; Karrer and Newman, 2011; Young and Scheinerman, 2007). The simulations module allows the user to sample random graphs given the parameters of one of these models. Additionally, the user can specify a distribution on the weights of graph edges.
UtilsGraSPyincludes a variety of utility functions for graph and graph population
import-ing and preprocessimport-ing. GraSPy can import graphs represented as NetworkX objects or NumPy arrays. Preprocessing examples include finding the largest connected com-ponent of a graph, finding the intersection or union of connected comcom-ponents across multiple graphs, or checking whether a graph is directed.
EmbedInferences on random graphs can leverage low-dimensional Euclidean
Graph Theory Statistical Modeling Other
package tra
versal net
work stats.
comm unities
em bed
mult. em
bed
mo del
fit
sim ulations
hyp. test
plotting pip install
GraSPy0.1.1 7 7 3 3 3 3 3 3 3 3
NetworkX2.3 3 3 3 3 7 7 3 7 3 3
graph-tool 2.29 3 3 3 3 7 3 3 7 3 7
Snap.py 4.1 3 3 3 3 7 7 3 7 3 7
Table 1: Qualitative comparison of Python graph analysis packages. GraSPyis largely com-plementary to existing graph analysis packages in Python. GraSPydoes not imple-ment many of the essential algorithms for operating on graphs (rather, it leverages
NetworkXfor these implementations). The focus of GraSPyis on statistical model-ing of populations of networks, with features such as multiple graph embeddmodel-ings, model fitting, and hypothesis testing. A 3 is given for packages that implement the respective feature, a 3 for packages that partially implement the respective feature, and a7is given for packages that do not implement the respective feature. Note that while a3 shows that the feature exists in the corresponding package, it does not imply that the specific algorithms are the same for all packages.
and Laplacian spectral embedding (LSE) are methods for embedding a single graph (Athreya et al., 2018). Omnibus embedding and multiple adjacency spectral em-bedding (MASE) allows for emem-bedding multiple graphs into the same subspace such that the embeddings can be meaningfully compared (Levin et al., 2017; Arroyo et al., 2019). GraSPyincludes a method for choosing the number of embedding dimensions automatically (Zhu and Ghodsi, 2006).
ModelsGraSPyincludes classes for fitting random graph models to an input graph (Figure
2). Currently, ER, SBM, DCER, DCSBM, and RDPG are supported for model esti-mation. After fitting a model to data, the model class can also output goodness-of-fit metrics (mean squared error, likelihood) and the number of estimated model param-eters, allowing for model selection. The model classes can also be used to sample new simulated graphs based on the fit model.
Inference Given two graphs, a natural question to ask is whether these graphs are both
IER
RDPG
DCSBM
DCER
SBM
ER
K P O I
K
P
O I
K P O I
K
P
O I
K P O I
K
P
O I
K P O I
K
P
O I
K P O I
K
P
O I
K P O I
K
P
O I
0.0 0.2 0.4 0.6 0.8 1.0
Figure 2: Connectome model fitting using GraSPy. Heatmaps show the probability of po-tential edges for models of graphs fit to theDrosophilalarva right mushroom body connectome (unweighted, directed) (Eichler et al., 2017). The node labels corre-spond to cell types: P) projection neurons, O) mushroom body output neurons, I) mushroom body input neurons. The graph models are: inhomogeneous Erd˝ os-R´enyi (IER) model in which all potential edges are specified, random dot prod-uct graph (RDPG), corrected stochastic block model (DCSBM), degree-corrected Erd˝os-R´enyi (DCER), stochastic block model (SBM), and Erd˝os-R´enyi (ER). Blocks (cell types) are sorted by number of member vertices and nodes are sorted by degree within blocks. The code used to generate the figure is a tutorial section athttps://neurodata.io/graspy.
can be performed on graphs without vertex alignment, or even with slightly different numbers of vertices (Tang et al., 2014).
ClusterGraSPyextends Gaussian mixture models (GMM) and k-means fromscikit-learn
to evaluate the quality of estimators (Schwarz et al., 1978). Silhouette score is used to choose the number of clusters for k-means (Rousseeuw, 1987). Clustering is often useful for computing the the community structure of vertices after embedding. Plot GraSPy extends seaborn to visualize graphs as adjacency matrices and embedded
graphs as paired scatter plots (Waskom et al., 2018). Individual graphs can be vi-sualized using heatmap function, and multiple graphs can be overlaid on top of each other using gridplot. The nodes in both graph visualizations can be sorted by various node metadata, such as node degree or assigned node labels. Pairplot can visualize high dimensional data, such as embeddings, as a pairwise scatter plot.
3. Code example
Given the connectomes of theDrosophila larva left and right mushroom bodies, one natural question to ask is: how similar are these graphs (Eichler et al., 2017)? We can frame this question as whether these graphs are generated from the same distribution of latent positions (Tang et al., 2014). We can use the latent distribution test to test this hypothesis:
f r o m g r a s p y . d a t a s e t s i m p o r t l o a d _ d r o s o p h i l a _ l e f t , l o a d _ d r o s o p h i l a _ r i g h t f r o m g r a s p y . i n f e r e n c e i m p o r t L a t e n t D i s t r i b u t i o n T e s t
# L o a d d a t a
l e f t _ g r a p h = l o a d _ d r o s o p h i l a _ l e f t () r i g h t _ g r a p h = l o a d _ d r o s o p h i l a _ r i g h t ()
# I n i t i a l i z e h y p o t h e s i s t e s t o b j e c t and c o m p u t e p - v a l u e
ldt = L a t e n t D i s t r i b u t i o n T e s t ( n _ c o m p o n e n t s=3 , n _ b o o t s t r a p s=500 ) p _ v a l u e = ldt . fit ( l e f t _ g r a p h , r i g h t _ g r a p h )
p r i n t(" p - v a l u e : " + str( p _ v a l u e ) ) p-v a l u e: 0 . 002
4. Conclusion
GraSPy is an open-source Python package to perform statistical analysis on graphs and graph populations. Its compliance with thescikit-learnAPI makes it an easy-to-use tool for anyone familiar with machine learning in Python (Buitinck et al., 2013). In addition,
GraSPy is implemented with an extensible class structure, making it easy to modify and add new algorithms to the package. As GraSPy continues to grow and add functionality, we believe it will accelerate statistically principled discovery in any field of study concerned with graphs or populations of graphs.
Acknowledgments
This work is graciously supported by the DARPA, under agreement numbers FA8650-18-2-7834 and FA8750-17-2-0112. We thank all the contributors for assisting with writing
References
Jes´us Arroyo, Avanti Athreya, Joshua Cape, Guodong Chen, Carey E Priebe, and Joshua T Vogelstein. Inference for multiple heterogeneous networks with a common invariant sub-space. arXiv preprint arXiv:1906.10026, 2019.
Avanti Athreya, Donniell E. Fishkind, Minh Tang, Carey E. Priebe, Youngser Park, Joshua T. Vogelstein, Keith Levin, Vince Lyzinski, Yichen Qin, and Daniel L Sussman. Statistical inference on random dot product graphs: a survey. Journal of Machine
Learn-ing Research, 18(226):1–92, 2018. URL http://jmlr.org/papers/v18/17-448.html.
Lars Buitinck, Gilles Louppe, Mathieu Blondel, Fabian Pedregosa, Andreas Mueller, Olivier Grisel, Vlad Niculae, Peter Prettenhofer, Alexandre Gramfort, Jaques Grobler, Robert Layton, Jake VanderPlas, Arnaud Joly, Brian Holt, and Ga¨el Varoquaux. API design for machine learning software: experiences from the scikit-learn project. In ECML PKDD
Workshop: Languages for Data Mining and Machine Learning, pages 108–122, 2013.
Katharina Eichler, Feng Li, Ashok Litwin-Kumar, Youngser Park, Ingrid Andrade, Casey M Schneider-Mizell, Timo Saumweber, Annina Huser, Claire Eschbach, Bertram Gerber, et al. The complete connectome of a learning and memory centre in an insect brain.
Nature, 548(7666):175, 2017.
Aric Hagberg, Pieter Swart, and Daniel S Chult. Exploring network structure, dynamics, and function using networkx. Technical report, Los Alamos National Lab.(LANL), Los Alamos, NM (United States), 2008.
Paul W Holland, Kathryn Blackmond Laskey, and Samuel Leinhardt. Stochastic blockmod-els: First steps. Social networks, 5(2):109–137, 1983.
Brian Karrer and Mark EJ Newman. Stochastic blockmodels and community structure in networks. Physical review E, 83(1):016107, 2011.
Jure Leskovec and Rok Sosiˇc. Snap: A general-purpose network analysis and graph-mining library. ACM Transactions on Intelligent Systems and Technology (TIST), 8(1):1, 2016. Keith Levin, Avanti Athreya, Minh Tang, Vince Lyzinski, and Carey E Priebe. A central limit theorem for an omnibus embedding of multiple random dot product graphs. pages 964–967, 2017.
F. Pedregosa, G. Varoquaux, A. Gramfort, V. Michel, B. Thirion, O. Grisel, M. Blon-del, P. Prettenhofer, R. Weiss, V. Dubourg, J. Vanderplas, A. Passos, D. Cournapeau, M. Brucher, M. Perrot, and E. Duchesnay. Scikit-learn: Machine learning in Python.
Journal of Machine Learning Research, 12:2825–2830, 2011.
Tiago P. Peixoto. The graph-tool python library. figshare, 2014. doi: 10.6084/m9.figshare. 1164194. URLhttp://figshare.com/articles/graph_tool/1164194.
Gideon Schwarz et al. Estimating the dimension of a model. The annals of statistics, 6(2): 461–464, 1978.
Minh Tang, Avanti Athreya, Daniel L. Sussman, Vince Lyzinski, and Carey E. Priebe. A nonparametric two-sample hypothesis testing problem for random dot product graphs.
Journal of Computational and Graphical Statistics, art. arXiv:1409.2344, September 2014.
Minh Tang, Avanti Athreya, Daniel L Sussman, Vince Lyzinski, Youngser Park, and Carey E Priebe. A semiparametric two-sample hypothesis testing problem for random graphs. Journal of Computational and Graphical Statistics, 26(2):344–354, 2017.
Joshua T Vogelstein, Eric W Bridgeford, Benjamin D Pedigo, Jaewon Chung, Keith Levin, Brett Mensh, and Carey E Priebe. Connectal coding: discovering the structures linking cognitive phenotypes to individual histories. Current Opinion in Neurobiology, 55:199– 212, 2019.
Michael Waskom, Olga Botvinnik, Drew O’Kane, Paul Hobson, Joel Ostblom, Saulius Lukauskas, David C Gemperline, Tom Augspurger, Yaroslav Halchenko, John B. Cole, Jordi Warmenhoven, Julian de Ruiter, Cameron Pye, Stephan Hoyer, Jake Vanderplas, Santi Villalba, Gero Kunter, Eric Quintero, Pete Bachant, Marcel Martin, Kyle Meyer, Alistair Miles, Yoav Ram, Thomas Brunner, Tal Yarkoni, Mike Lee Williams, Constan-tine Evans, Clark Fitzgerald, Brian, and Adel Qalieh. mwaskom/seaborn: v0.9.0 (july 2018), July 2018. URL https://doi.org/10.5281/zenodo.1313201.
Stephen J Young and Edward R Scheinerman. Random dot product graph models for social networks. InInternational Workshop on Algorithms and Models for the Web-Graph, pages 138–149. Springer, 2007.