109 Copyright © 2011-15. Vandana Publications. All Rights Reserved.
Volume-5, Issue-1, February-2015
International Journal of Engineering and Management Research
Page Number: 109-116
Adsorption of Lead from Industrial Effluents using Rice Husk
IhsanHabibDakhil
Chemical Engineering Department, College of Engineering, Al-Muthanna University, Al-Samawah, IRAQ
ABSTRACT
Rice husk a very low cost material has been utilized as adsorbent for the removal of lead from industrial effluents. Adsorption studies have been carried out at 28°Cand the effect of initial lead concentrations (100-1000) mg/l, adsorbent dosage (0.05-1) g, pH (2-10) and contact time (10-180) min on lead uptake to establish a mathematical model description percentage removal of Pb (II). The influence of four parameterson the percentage removal of Pb(II) was examined using a response surface methodological approach. Box- Wilson design of experiments was adopted to find a useful relationship betweenthese parameters andthe removal efficiency. The experiment data collected by this method successfully fitted to a second order polynomial mathematical model. The optimum operating conditions of initial Pb (II) concentrations, adsorbent dose, pH and contact time were 325 mg/l, 0.7625 g, 4 and 137 min, respectively with high value of correlation coefficients (R= 0.9877). At these conditions, the maximum percentage removal of Pb(II) was 95.55% and lead uptake was 102.97 mg/g.The experimental data were analyzed using Langmuir and Freundlich isotherm models were applied in the adsorption studies. Langmuir model is found very well represent the equilibrium data with correlation factor is close to unity than the Freundlich model.
Keywords— Adsorption, Removal, Lead, Rice husk, Isotherms.
I.
INTRODUCTION
The removal of toxic and polluting metal ions from industrial effluents is an important challenge to avoid one of the major causes of water and soil pollution. Lead is attracting wide attention of environmentalist as one of the most toxic heavy metals. Ionic lead, an exceedingly toxic metal, is released into the environment by wastewater from storage battery manufacture, printing, pigment manufacturing, petrochemicals, fuel combustion and photographic materials [1].In water, Pb(II) tends to
accumulate in aquatic organisms through the food chain and by direct uptake. It can damage practically all tissues, particularly the kidneys and the immune system. Intense exposure to high Pb(II) levels (from 100 to 200 gram/day) causes encephalopathy with the following symptoms: vertigo, insomnia, migraine, irritability, and even convulsions, seizures, and coma [2] and[3].
The EPA and WHO drinking water standard for Pb(II) is 0.05 mg/L and 0.01mg/L, respectively. Pb(II) accumulates mainly in bones, brain, kidney and muscles and may cause many serious disorders like anemia, kidney diseases, nervous disorders and sickness even death [4]. It is therefore, essential to remove Pb(II) from wastewater before disposal. A number of treatment methods for removal of heavy metals from industrial wastewater include chemical precipitation, ion exchange, membrane separation, and adsorption. Among them adsorption process is found to be the most effective purification method for removing dissolved metal ions from wastes [5]. The aim of this work is to investigate the ability of rice husk used as an adsorbent for removal of Pb(II) ion from industrial effluents and to study the effects of initial Pb(II) concentration, adsorbent dosage, pH value and contact time on the adsorption process byestablished the mathematical model relating the removal efficiency of Pb(II) with operating variables, then find the optimum conditions for adsorption process. In addition, the experimental equilibrium data are used to fit Langmuir and Freundlich isotherm models using the optimum conditions.
II.
MATERIALS AND METHODS
MATERIALS
110 Copyright © 2011-15. Vandana Publications. All Rights Reserved. CHEMICALS
A stock solution of Pb(II) (1000 mg/l) was prepared by dissolving an accurate weight quantity of Pb(NO3)2
The adsorption experiments were carried out in isothermal batch process at 28°C ± 1°C and the effect of different parameters such as initial Pb(II) concentration, adsorbent dose, pH and contact time were studied. The experiments were conducted by adding an amount of adsorbent varied between (0.05-1) g with 100 ml of Pb(II) solution of different initial concentration (100-1000) mg/l in 250 ml stopper conical flasks. These flasks were placed in a thermostatic water bath shaker and agitation was provided at 150 rpm for 180 min to ensure equilibrium was reached. At different intervals of time, samples were drawn out of the adsorber using syringe(2ml). The percentage removal of lead was calculated as follows: in double distillate water. This solution is diluted
as required to obtain the standard solutions containing (100-1000) mg/l of Pb(II). The concentration of Pb(II) ions after adsorption was determined by atomic absorption spectrophotometer. The pH of each test solution was adjusted to the required value with diluted 0.1 N HCl or 0.1 N NaOH solutions using digital pH meter to perform the measurements.
ADSORPTION STUDIES
100 C
C C R %
o e
o− ×
= ….(1)
The amount of adsorption at equilibrium, qe
W C C V e
q = ( o− e)
(mg/g), was calculated by:
…. (2)
where Co and Ce
STATICAL DESIGNOF EXPERIMENTS
(mg/l) are the concentrations of Pb(II) at initial and equilibrium, respectively. V (L) is the volume of the solution and W (g) is the mass of dry sorbent used.
To study the effects of initial lead concentration (X1), adsorbent dosage (X2), pH (X3) and contact time (X4
1 2 2 + +
= q q
N
) on the removal efficiency of lead (Y). Box-Wilson experimental design method was used to establish a mathematical model relating the efficiency of removal of lead to the four operating variables [6]. The needed number of experiments (N) depends on number of variable (q) and was estimated according to the following equation:
…(3)
Thus, for four variables process, the number of experiments needed is 29 experiments. For four variables the form of a quadratic (second order model) polynomial is illustrated by the following equation:
∑
≤ = ∑
= +
+ ∑
= +
= K
K i
K
i k
X i X ik K
i i
X ik K
i i
X i o
Y
1 , 1
2
1
β β
β
β (4)
where Y is the percentage of Pb(II) adsorbed, β o
β
is the offset term, i is the first-order main effect, β ik
β
is the second order main effect, and ik is the interaction effect. The method of least squares was applied to estimate the parameters in the polynomial equation by using Statistics–Software version 7. It was made under “non-linear estimation”. The experimental variables, initial
Pb(II) concentration, adsorbent dosage, pH, and contact time, are designated as X1, X2, X3 and X4
III. RESULTS AND DISCUSSION
, respectively. The goodness of fit of the model was calculated via the coefficient of determination (R) and the analysis of variance.The mathematical model can be estimated most effectively if proper experimental design is used to collect the data. To evaluate the optimum conditions that give the maximum response (highest removal efficiency) were determined using analysis by a central composite experimental to get desirability operating variables [7].ANALYSISOFEXPERIMENTAL RESULTS
The response of experimental work conducted according to Box-Wilson design is represented by the mathematical model that described the removal efficiency (Y) of Pb(II) from aqueous solution on rice husk which gave:
Y = 18.717966 + 0.054689 X1+ 97.96154 X2+ 5.054287
X3+ 0.32235 X4 – 0.000042 X12–51.3389 X22– 0.380208
X32– 0.001188 X42 – 0.007018 X1 X2 – 0.001111 X1 X3– 0.000105 X1 X4– 2.36842 X2 X3– 0.037152 X2 X4+ 0.002941 X3 X4..(5)
Correlation coefficient (R) = 0.9877 Variance Explained (S) = 97.55%
The optimum conditions for the four factors that give maximum adsorption capacity are:
X1*: optimum initial Pb(II) concentration = 325 mg/l X2*: optimum amount of adsorbent dose = 0.7625 g X3*: optimum pH solution value = 4
X4*: optimum time contact = 137 min Ymax.
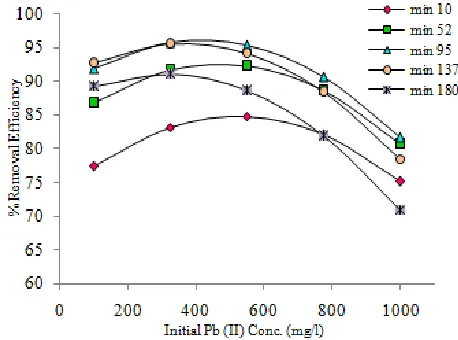
Fig.1 shows the effect of Initial lead concentration on the removal efficiency for different amount of adsorbent dose (0.05-1) g and at constant optimum value of pH and contact time, 4 and137 min,
: maximum removal percentage = 95.55 %
111 Copyright © 2011-15. Vandana Publications. All Rights Reserved. respectively. The result indicated that the percentage of
lead removal increases with increasing the adsorbent dose. The high sorption at the initial concentration may be due to an increased number of vacant sites on the adsorbent available at the initial stage. As concentration of initial Pb(II) is increased there is a decrease in percentage removal of lead. This can be attributed to the accumulation of Pb(II) particles on the surface of adsorbent. This observation is in a good agreement with the findings on mineral adsorbents [8] and on sawdust[1].
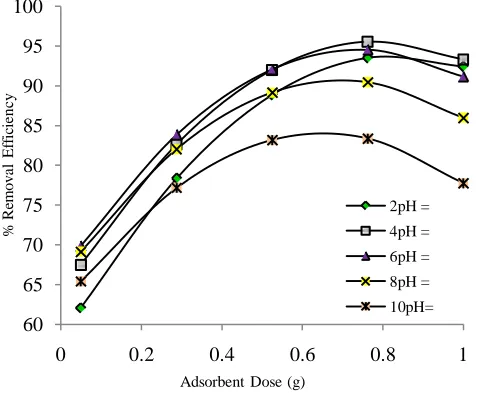
Fig.2 shows the same effect but for different pH values and optimum conditions of adsorbent dose (0.7625g), optimum contact time (137 min). Also, it can be seen that the percent of removal is favored at pH value near 4.
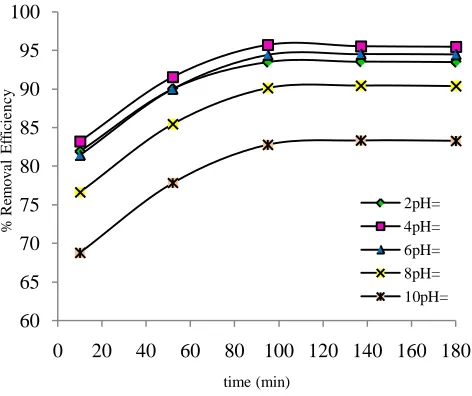
Fig.3 shows the same effect but for different contact time and optimum conditions of adsorbent dose (0.7625 g) and pH value (4). The results showed that more than 90% of the Pb(II) was adsorbed within a period of 80 min. The maximum uptake of Pb(II) was (102.54 mg/g) observed within 137 min.
EFFECTOF ADSORBENT DOSAGE
112 Copyright © 2011-15. Vandana Publications. All Rights Reserved. Fig. 5 shows the same effect but for different pH
value and optimum conditions of initial lead concentration (325) mg/l and optimum contact time (137 min). The result showed that the percentage of lead removal increases with increasing the adsorbent dose.
Fig. 6 shows the same effect but for different contact times and optimum conditions of initial lead concentration (325 mg/l) and optimum pH value (4). It can be, also, seen that increasing the contact time shall increase the percentage removal of lead. Similar results were obtained by almost all assorbents such as on Naion 117 membrane [12] and on nano-silver coated activated carbon [13]. The results also clearly indicated that the removal efficiency increases up to the optimum dosage.
EFFECT OF pH
Earlier studies have indicated that the pH of adsorbate is an important parameter affecting adsorption of heavy metals. The effect of pH value on the percentage removal of lead at optimum values of the others factor is shown in Fig.s7,8 and 9. From these figures it can be shown that the removal of lead increases slightly with increasing the pH value from 2 to 4, then, fast decreases at pH 6-10. In general, the lead uptake decreases at low and high pH values. At low pH values, the uptake of lead is less due to the presence of H+ ions under extreme acidic condition compete with the Pb(II)ions for the adsorption sites in the system, which in turn leads to partial releasing the later. This means that at high H+ concentration, the adsorbent 60
65 70 75 80 85 90 95 100
0 0.2 0.4 0.6 0.8 1
%
R
em
o
v
a
l
Ef
fic
ie
n
c
y
Adsorbent Dose (g)
pH = 2
pH = 4
pH = 6
pH = 8
pH= 10
50 55 60 65 70 75 80 85 90 95 100
0 0.2 0.4 0.6 0.8 1
%
R
emo
v
a
l
E
ff
ici
en
cy
Adsorbent Dose (g)
10 min
52 min
95 min
137 min
180 min
55 60 65 70 75 80 85 90 95 100
0 2 4 6 8 10 12
%
R
em
o
v
a
l
Ef
fic
ie
n
c
y
pH
100 mg/l
325 mg/l
550 mg/l
775 mg/l
1000 mg/l
Fig-5: Effect of adsorbent dosage on removal efficiency at different pH
Fig-6: Effect of adsorbent dosage on removal efficiency at different contact times
113 Copyright © 2011-15. Vandana Publications. All Rights Reserved. surface becomes more positively charge thus reducing the
attraction between adsorbent and metal cations [14]. On the other hand, as pH increases, more negatively charged surface becomes available thus facilitating greater metal uptake [15]. For this reason, Pb(II) uptake was slightly increases by increasing of pH value and the maximum adsorption capacity was recorded at pH 4. Similar behavior has been reported during the adsorption onto activated carbon [16] and onto carbon aerogel[17].
EFFECT OF CONTACT TIME
The effect of contact time on the percentage removal of lead at optimum conditions of the others factor is the presented in Fig.s10,11 and 12. These figures show the removal of lead increases with increasing mixing contact time attains equilibrium in 137 min. After this period the removal of lead versus time curves are smooth
and continue leading to saturation. These results indicated that the sorption process can be considered very fast because of the large amount of lead attached to the sorbent within the first 80 min of adsorption. The higher sorption rate at initial period can be attributed to the increase of number of vacant site on the adsorbent available at the initial stage. This result is in agreement with those obtained by Abdel-Ghani[1] and by Senthil [13].
60 65 70 75 80 85 90 95 100
0 2 4 6 8 10 12
% R em o v a l Ef fic ie n c y pH 0.05 g 0.2875 g 0.525 g 0.7625 g 1 g 60 65 70 75 80 85 90 95 100
0 2 4 6 8 10 12
% R em o v a l Ef fic ie n c y pH 180 min 137 min 95 min 52 min 10 min 70 75 80 85 90 95 100
0 20 40 60 80 100 120 140 160 180
% R em o v a l Ef fic ie n c y time (min) 100 mg/l 325 mg/l 550 mg/l 775 mg/l 1000 mg/l 45 50 55 60 65 70 75 80 85 90 95 100
0 20 40 60 80 100 120 140 160 180
% R em o v a l Ef fic ie n c y time (min) 0.05 g 0.2875 g 0.525 g 0.7625 g 1 g
Fig-8: Effect of pH on removal efficiency at different adsorbent dosages
Fig-9: Effect of pH on removal efficiency at different contact time
Fig-10: Effect of contact time on removal efficiency at different initial lead concentrations
114 Copyright © 2011-15. Vandana Publications. All Rights Reserved.
IV.
ADSORPTION EQUILIBRIUM
Several models have been published in the literature to describe experimental data of adsorption isotherms. The Langmuir and Freundlich models are the most frequently employed models. In this work, both models were used to describe the relationship between the lead adsorbed and optimum conditions. The equilibrium isotherms were determined at 28o
e l
e l o e
C K
C K q q
+ =
1
C under optimized conditions. The Langmuir adsorption isotherm was represented by the following equation [18]:
… (6)
where qoand Klare Langmuir parameters related
to maximum adsorption capacity (mg of solute per gm of adsorbent) and free energy of adsorption, respectively. Ce
is the equilibrium concentration in the solution (mg/l) and qe
e l o o
e q q K C q
1 . 1 1
1 = +
is the equilibrium adsorption capacity of adsorbent (mg of adsorbate per gm of adsorbent). The linear form of the Langmuir isotherm model is given by:
… (7)
The Langmuir constant qo and Klcan be
calculated from the intercept and slope of the linear plot of experimental data of 1/qeversus 1/Ce as shown in Fig. 13and are presented in Table-1.
To confirm the favorability of the adsorption process, the essential characteristics of the Langmuir isotherm can be expressed in terms of a dimensionless constant separation factor for equilibrium parameter[19], RL
o l L
C K R
+ =
1 1
, which is defined as:
… (8)
The value of RL indicates the shape of the isotherms to be either unfavorable (RL> 1), linear (RL = 1), favorable (0 <RL< 1) or irreversible (RL = 0) [20]. The calculated RL values at different initial Pb(II) concentration which is found in the range of 0.6481 and 0.1555 (0 <RL< 1) which confirms the favorable adsorption process for Pb(II) removal using rise husk. The calculated RL values are shown in Fig.14. Also, higher RL
n e f e K C
q = . 1
values at lower ion concentrations showed that adsorption was more favorable at lower concentration.
The Freundlich model is an empirical equation based on sorption on heterogeneous surface. It is given by the following equation [21]:
… (9) where Kf
e f
e C
n K
q ln 1 ln
ln = +
and n are the Freundlich constants that indicate the adsorption capacity and intensity, respectively. The linear form of Freundlich model can be written as:
… (10)
The value of Kf and n are evaluated from both intercept and slope, respectively, of the linear plot of the experimental data of lnqe versus lnCe
Fig. 13 and Fig. 15 show the Langmuir and Freundlich curves for lead adsorption onto rice husk, respectively. The isotherm constants and correlation factors are summarized in Table-1. In general, R
as illustrated in Fig. 15.
2 values, which are a measure of goodness fit to Langmuir isotherm model, could adequately describe the adsorption data. From Table-1, it can be seen that the values of correlation factor R2is close to unity for Langmuir model which indicates the good representation of this modelthan Freundlich model.
Fig.16 shows the maximum adsorption capacity at different Pb(II) concentration and optimum other factors.The comparison of maximum monolayer adsorption capacity of Pb(II) onto various adsorbents is presented in Table-2. It shows that the rise husk studied in thiswork has a large adsorption capacity.
60 65 70 75 80 85 90 95 100
0 20 40 60 80 100 120 140 160 180
%
R
em
o
v
a
l
Ef
fic
ie
n
c
y
time (min)
pH= 2
pH= 4
pH= 6
pH= 8
pH= 10
Fig-13: Langmuir isotherm for Pb(II) adsorption
115 Copyright © 2011-15. Vandana Publications. All Rights Reserved.
V.
CONCLUSIONS
116 Copyright © 2011-15. Vandana Publications. All Rights Reserved.
REFERENCES
[1]. Abdel-Ghani N. T., Hefny M., El-Chaghaby G. A. F., (2007), "Removal of Lead from Aqueous Solution Using Low Cost Abundantly Available Adsorbents", Int. J. Environ. Sci. Tech., 4(1), pp. 67-73.
[2]. Smith E. A., (1992), "Heavy Metals", Health Science Bookstall, 142.
[3]. World Health Organization (W.H.O), (1998),
"Environmental Health Criteria", No. 200, Lead. - CH- 1211 Geneva 27, Switzerland.
[4]. Naseem Z., (2012), "Lead Removal from Water by Low Cost Adsorbents: A Review", Pak. J. Anal. Environ. Chem., Vol.13, No.1, pp.1-8.
[5]. Aslam M.M., Hassan I., Malik M., and Matin A., (2004), "Removal of Copper from Industrial Effluent by Adsorption with Economical Viable Material", electronic Journal of Environment, Agriculture and Food Chemistry, ISSN: 1579-4377, Vol. 3, pp.658-664.
[6]. Box, G. E. and Hunter, J. C., (1957), "Multifactor Experimental Design for Exploring Response surface", Ann. Math, Vol.28, 195.
[7]. Zivorad R., (2004), "Design of Experiments in
Chemical Engineering", Wiley-VCH, ISBN:
3.527.31142.4.
[8]. Rashed M. N., (2001), "Lead Removal from Contaminated Water Using Mineral Adsorbents", The Environmentalist, Vol. 21, pp.187-195.
[9]. Park H. J., M. Kim, S. M. Shim, G. H. Kim, (2005), "Adsorption of Cadmium and Lead by Various Cereals from Korea", Bull. Environ. Contam. Toxicol. , Vol. 74, pp.470-476.
[10]. Iulia N., Monica I., Manuela F. S., M. Ghiurea C. Petcu and Otilia C., (2007), "The Adsorption of Heavy Metal Ions on Porous Calcium Alginate Microparticles",Anul XVI (serienouă), Vol. 1, pp. 59-67. [11]. Hashem A., A. Abou-Okeil, A. Shafie and M. El-Sa- khawy, (2006), “Grafting of High ά-Cellulose Pulp
Extracted from Sunflower Stalks for Removal of Hg(II) from Aqueous Solution”, Polymer Plastics Technology and Engineering, Vol. 45, pp. 135-141.
[12]. Mohamed M.N., Abdul Hamid Y.,(2009), "Adsorption of some heavy metal ions from aqueous solutions on Nafion 117 membrane", Desalination 249, pp. 677-681.
[13]. Senthil Kumar P., C.Vincent, K. Kirthika and K. Sathish Kumar, (2010),"Kinetics and Equilibrium Studies of Pb+2
[15]. Chang, J.S., Law, R., Chang, C.C., (1997), "Biosorption of Lead, Copper and Cadmium by Biomass of Pseudomonas Aeruginosa PU21", Water Res., 31 (7), pp.1651-1658.
[16]. Periasamy K., Namasivayam C.,(1995), "Adsorption of Pb(II) by Peanut Hull Carbon from Aqueous Solution", Sep. Sci. Tech., 30, pp. 2223-2237.
[17]. Jyotsna G., K. Kadirvelu, C. Rajagopal and V. K. Garg, (2005), "Removal of Lead(II) from Aqueous Solution by Adsorption on Carbon Aerogel Using a Response Surface Methodological Approach", Ind. Eng. Chem. Res., 44, pp. 1987-1994.
[18]. Davis, T.A., Volesky, B., Mucci, A., (2003), “ A review of the Biochemistry of Heavy Metal Biosorption by Brown Algae”, Wat. Res., 37, pp. 4311-4330.
[19]. Weber T. and Chakraborti R., (1974), “Pore and Solid Diffusion Models for Fixed Bed Adsorbents”, AIChE J., 20, pp. 228–238.
[20]. McKay G., Blair H. and Gardener J., (1982), “Adsorption of Dyes on Chitin. I. Equilibrium Studies”, J. Appl. Polym. Sci., 27, pp. 3043 – 3057.
[21]. Freundlich H., (1906), “Adsorption in Solution”, Phys.Chem. Soc., 40, pp. 1361-1368.
[22]. Girgis B.S. and Hendawy A.N.A., (1997),"Capacity of activated carbon from date pips in the removal of organic pollutants and heavy metals", In 1st international conference on chemistry education, Cairo, Egypt, pp. 55– 62.
[23]. Marisa N., Paulo S., Moreira S. and Vicente P. S., (2009),"Adsorption of Heavy Metal Cations Using Coal Fy Ash Modifiedby Hydrothermal Method", Fuel, 88,pp. 1714-1719.
[24]. Mohapatra M., L. Mohapatra, P. Singh, S. Anand and B.K. Mishra, (2010), "A Comparative Study on Pb(II), Cd(II), Cu(II), Co(II) Adsorption from Single and Binary Aqueous Solutions on Additive Assisted Nano-Structured Goethite", Int. J. of Eng. Sci. and Tech., Vol. 2, No. 8, pp. 89-103.
[25]. Dwivedi C. P., Sahu J. N., Mohanty C. R., Mohana B. R. and Meikap B. C., (2008),"Column Performance of Granular Activated Carbon Packed Bed for Pb(II) Removal", J. Hazard. Mater., 156, pp.596-603.
[26]. Giraldo L. and Moreno-Pirajan J. C., (2008),"Pb Adsorption from Aqueous Solutions on Activated Carbons Obtained from Lignocellulosic Residues", Braz. J. Chem. Eng., 25, pp.143-151.
[27]. Calero M., Hernainz F., Blazquez G., Martin-Lara M. A. and Tenorio G., (2009), "Biosorption Kinetics of Cd(II), Cr (III) and Pb (II) in Aqueous Solutions by Olive Stone", Braz. J. Chem. Eng., 26, pp.265-273.
Ion Removal from Aqueous Solutions by Use of Nano-Silversol-Coated Activated Carbon", Braz. J. of Chem. Eng., 27, No.2, pp. 339-346.