Selenium in Seleniferous
Environments
H. F. Mayland
USDA-Agricultural Research Service Kimberly, Idaho
L. F. James and K. E. Panter USDA-Agricultural Research Service Logan, Utah
J. L. Sonderegger
Montana Bureau of Mines and Geology Butte, Montana
ABSTRACT
Selenium is biologically important because (i) it is essential in animal and possi-bly plant metabolism, (ii) in many areas diets do not contain sufficient Se to meet, animals' needs, and (iii) in other areas it is toxic to animals when it occurrs in high concentrations in soil, water, plants, fly ash, or in aerosols. Animals require 0.05 to 0.1 mg Se/kg in their diets to prevent Se deficiency but suffer Se toxicosis when dietary levels exceed 5 to 15 mg Se/kg. The earth's crustal materials generally con-tain <0.1 mg Se/kg. Higher concentrations are found in Cretaceous shales. The Se-accumulator plants growing on the seleniferous soils may contain hundreds or even thousands of mg Se/kg. However, the nonaccumulator grasses and forbs seldom ac-cumulate >50 mg Se/kg and more often contain <5 mg Se/kg. Soils and plants may discharge volatile forms of Se into the atmosphere. However, plants may also ab-sorb measurable amounts of gaseous Se from the atmosphere. Anthropogenic activi-ties impact the amount of Se entering our nation's lakes, rivers, and the atmosphere. Combustion of coal and incineration of municipal waste exhaust Se into the environ-ment. In addition, crop-fallow and irrigation practices that allow leaching waters to pass through seleniferous strata prior to intersecting with surface flow, augment the Se levels encountered by plant and animal life.
In 1857, U.S. Army Surgeon T.W. Madison described toxicity symptoms in horses (Equus caballus) grazing near Fort Randall, SD (Rosenfeld & Beath, 1964). Since then, ranchers in that area have continued to experience livestock losses. They associated the toxicosis with the saline seeps and outcrops,
com-Copyright © 1989 Soil Science Society of America and American Society of Agronomy, 677 S. Segoe Rd., Madison, WI 53711, USA. Selenium in Agriculture and the Environment, SSSA Special Publication no. 23.
mon to much of the area, and named the problem alkali disease. Not until 1931 did researchers associate alkali disease with selenosis. Since then, researchers have continued to characterize Se in soils and plants and its toxi-cosis in animals, Early efforts succeeded in describing areas in the western USA and Canada where Se accumulator plants contained concentrations of 50 to 500 mg Se/kg or higher (Rosenfeld & Beath, 1964; Fig. 2-1).
Research continued on soil, plant, and animal factors associated with high Se levels, but by 1958, nutritional deficiencies of Se were noted in the diets of many animals including grazing livestock (NAS-NRC, 1983). Areas of the USA were then mapped where plants contained <0.1 mg Se/kg (Fig. 2-2) and where Se deficiency disorders were likely to occur in livestock and poultry. In general, Se concentrations of 0.05 to 0.1 mg Se/kg diet and 5 to 15 mg Se/kg diet may be considered as critical levels of adequacy and toxicity, respectively.
Knowledge of Se in the environment prior to the mid-1970s has been summarized in a number of excellent reviews: Allaway et al. (1967), Alla-way (1968), Anderson et al. (1961), Anderson and Scarf (1983), Brown and Shrift (1982), Gissel-Nielsen et al. (1984), Koller and Exon (1986), Martin (1973), Moxon and Rhian (1943), NAS-NRC (1974, 1976, 1983), Reuter (1975), Sharma and Singh (1983), and Shrift (1958, 1969, 1973). Selenium information is also given in the recent publications by Adrian() (1986), Combs and Combs (1986), Ihnat (1989), and Levander (1986).
Since the mid-1970s human activities have introduced new sources of Se into the ecosystem, and much attention is now being given to the anthropo-genic impact of Se cycling in seleniferous environments. This chapter will briefly describe Se in the various compartments that were characterized through the mid-1970s but will elaborate in more detail on the impact of human activities. However, those aspects associated with the central Califor-nia experience will be detailed in other chapters of this special publication.
Low, medium or adequate, and high levels of bioavailable Se, as used in this chapter, will refer to those levels in the soil that result in concentra-tions of < 0.1, 0.1 to 1.0, and > 1.0 mg Se/kg, respectively, in the non-Se-accumulator plants growing on such soils.
GEOCHEMISTRY
Selenium occurs in nearly all materials of the earth's crust and is present in magmatic rocks in concentrations generally <0.05 mg/kg (Table 2-1). During volcanic activity, much of the Se escapes as high-temperature vola-tile gases (Reuter, 1975); thus, igneous rocks are usually low in Se. The ele-ment is rarely seen in eleele-mental form (Se°) but may be found in association with sulfide ore bodies (Anderson et al., 1961).
Selenium concentrations are higher in sedimentary rocks where it is as-sociated with the clay fraction, and thus, larger concentrations of Se are found in shales than in limestones or sandstone. Even in shales, the concentrations
Table 2-1. Selenium concentration in magmatic and sedimentary rocks (compiled from Kabata-Pendias & Pendias, 1984).
Rock type Se conc., mg/kg
Magmatic rocks
Ultramafic rocks (Dunites, Pendotites, Pyroxeuites) 0.02-0.05 Mafic rocks (Basalts, Gabbros) 0.01-0.05 Intermediate rocks (Diorites, Syenites) 0.02-0.05 Acid rocks (Granites, Gueissas) 0.01-0.05 Acid rocks—volcanic (Rhyolites, Trachytes) 0.02-0.05 Sedimentary rocks
Argillaceous sediments 0.4-0.6
Shales 0.6
Sandstones 0.05-0.08
Phosphorites 1-100
are seldom > 500 mg Se/kg. Values range from <1 to nearly 300 mg Se/kg in the Cretaceous black shales in Wyoming (NAS-NRC, 1983). Approximately 2 mg Se/kg occurs in the Cretaceous Pierre and related shales, which are the parent material for much of the seleniferous soil in the northern Great Plains of the USA and the Prairie region of Canada. These seleniferous soils may have higher concentrations of Se in the subsoil because of chemical weathering. Shales are also the principal sources of Se-toxic soil in Ireland, Australia, Israel, and several other countries of the world (Abuereish & Lahham, 1987; Anderson et al., 1961; Lakin, 1948; Rosenfeld & Beath, 1964; Swaine, 1955; NAS-NRC, 1983).
The relatively high concentration of Se in some phosphate rocks (Rader & Hill, 1935), particularly western phosphates (1-178 mg Se/kg), is signifi-cant because of the wide use of phosphate fertilizers. Robbins and Carter (1970) suggested that normal superphosphate can be expected to retain about 60% and concentrated superphosphate about 40% of the Se found in the original rock. The decrease in the Se concentration results from volatiliza-tion and loss of some Se during the smelting process.
Coal often contains from 1
to
20 mg Se/kg, although some coal from the People's Republic of China has > 1000 mg Se/kg (D.E. Olson, 1986, personal communication). Upon combustion, coal releases large amounts of Se into the ecosystem. This topic will be covered in more detail later in this chapter. Crude oil also contains Se. Elirich et al. (1985) measured the Se and S concentrations in 45 crude oils of southern West Germany and reported a range of 0.02 to 0.2 mg Se/kg. The Se and S values were highly correlated. There are no known ore deposits sufficiently high in Se to permit min-ing it exclusively. Most commercially available Se is extracted from copper refinery slime along with the recovery of other precious metals (NAS-NRC, 1976, 1983). Total production of Se in the world was 1.89 x 10 6 kg Se in 1983, including 200 x 10 3 kg in the USA (Jensen, 1985). Production by continent was as follows:North America 645 x10 3 kg
South America 330
Europe 395
Africa 230
Asia 190
Oceana 95
Selenium is used in the manufacture of batteries, glass, and electronic equip-ment, and as a reagent in remedies for eczema, fungus infections, antidan-druff products, veterinary therapeutic agents, injectables, feed additives, and fertilizers. The demand for fertilizer Se may exceed 28 x 103 kg by 1990 (Korkman, 1985).
SELENIUM IN SOIL
20
and 38 mg Se/kg as water-soluble selenate have been reported in selenifer-ous areas of the world (Lakin, 1948; Swaine, 1955). Soils developed from the Cretaceous shales of South Dakota, Montana, Wyoming, Nebraska, Kan-sas, Utah, Colorado, and New Mexico tend to have high Se values ranging from 1 to > 10 mg Se/kg. It is in these areas where natural Se toxicosis has occurred historically. The Se content of some Hawaiian surface soils varies from 1 to 20 mg/kg, but this Se is unavailable for vegetation because of it complexation with the Fe and Al minerals (Anderson et al., 1961; Rosenfeld & Beath, 1964).
Low-Se soils in the USA include those derived from sedimentary rocks that predate the major Cretaceous period (northeastern USA). Other low-Se soils include those that are formed from recent volcanic ash deposits or lees-sal material derived from the ash (Pacific Northwest). Soils in the very low-Se region of the eastern USA are formed from coastal deposits consisting of weathered, recycled sediments (South Atlantic seaboard).
The soil parent materials of the low-Se areas in Montana and parts of Idaho are mostly derived from granites and old metamorphic rocks. Low total-Se concentrations occur in the tertiary volcanic rocks of Arizona and New Mexico. Most of the soils from low-Se areas of the USA contain <0.5 mg Se/kg. Many of these low-Se areas correspond to areas where Se-deficiency disorders such as white muscle disease occur.
As with other elements, the total concentration of Se in soils shows little relationship to the concentration of Se in plants grown on those soils (Lakin, 1972). This is because Se in soil exists in several chemical forms that differ widely in their solubility and. availability to plants (Anderson & Scarf, 1983). These chemical forms are:
Selenide, See- , HSe , H2Se (aq) Elemental selenium, Se p
Selenite, Se03 - , HSeOT , H 2SeO3 (aq) Selenate, SeOi - , HSe0, H2SeO4 (aq) Organic Se
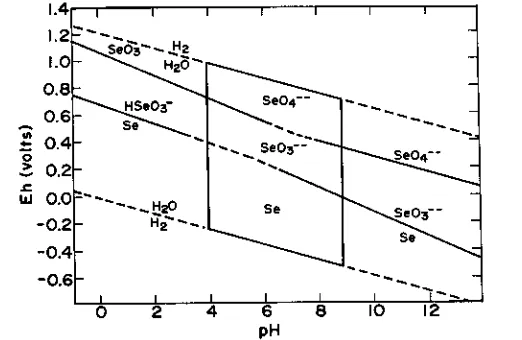
The chemical forms of Se present in soils and sediments are closely related to the oxidation-reduction potential and pH of the soil (van Dorst & Peter-son, 1984, Fig. 2-3). Inorganic Se exists predominately as the oxyanions, selenite and selenate, in the aqueous solutions of well-aerated alkaline soils. In poorly aerated acid soils, inorganic Se predominates as the relatively in-soluble selenide and elemental forms. Howard (1977) summarized the Se geochemistry, as affected by Fe, and concluded that the geochemistry of Se is largely controlled by that of Fe, with which Se is closely affiliated in both oxidizing and reducing environments.
ex-1.4 1.2
1-Se03--- 42 1.0- Hzi5
0.8
-0.6 - se
0.4-0 0.4-
0.2-u.1 0.0 H20
0.2
- -0.4-
-0.6-0
2
4
6 8pH
Fig. 2-3. Variation of oxidation potentials for the predominating states of Se as a function
of pH. A line intersecting the point Eh = 0.4 and pH = 4 and the point Eh = 0.1 and pH =9 divides the oxidized soils above and the reduced soils below (adapted from Lakin & David-son, 1967 and NAS-NRC, 1976).
amined the bioavailability of soil Se by using ammonium bicarbonate-DTPA (diethylenetriaminepenta acetic acid) as a soil extractant. Alfalfa
(Medicago
sativa
L.) contained in excess of 5 mg Se/kg when growing on mollisols con-taining more than 45 mg extractable Se/kg soil. Alfalfa yields were reduced when the extractable soil Se exceeded 500 mg/kg. The acutal amount of Se for toxicosis will depend on species of plant, species and age of animal, and other factors including concentrations of SO4-S, P, and sesquioxides in the soil.Soils that were formed from either high or low Se parent materials, but have poor aeration; acid pH; and high rainfall are likely to be soils that may be deficient in either total or at least bioavailable Se. Plants growing on these latter soils may not contain sufficient Se to meet animal requirements. More detail on the uptake and accumulation of Se by agricultural crops is pre-sented in Chapter 4 of this publication.
SELENIUM IN WATER
Selenium occurs as a minor constituent in drinking water in a concen-tration range of <0.1 to 100 11,g/L (NAS-NRC, 1983). Samples rarely
22 MAYLAND ET AL.
Rumble (1985) measured water quality parameters, including Se, in surface-coal and bentonite-mine impoundments and livestock ponds in the Northern High Plains. He reported mean Se values of 2.2, 10.6, and 1.1 pg Se/L in the three potential livestock-water sources, respectively. H.F. May-land (1986, unpublished data) also sampled livestock-water impoundments throughout central Montana in known seleniferous areas and found 0.4 to 0.7 pg Se/L in most of these waters. A few samples contained as high as 270 pg Se/L, many times greater than the USEPA (1977) allowable value of 10µg Se/L in drinking water but is near the 100 peg/L level of Se in blood considered adequate for animal requirements.
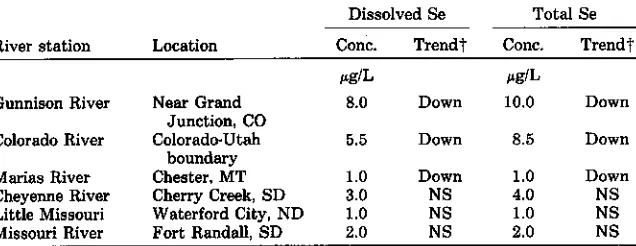
In a report on water-quality trends in the nation's rivers, Smith et al. (1987) noted that, over an 8-yr period, 75% of the 211 stations reported values at or below the 1µg Se/L laboratory detection limit. Four sites had higher concentrations in 1981 than in 1974, whereas 23 had lower concentrations. Rivers draining some of the seleniferous regions contained relatively high Se concentrations. Selenium mean values and trends for specific stations (R.A. Smith, 1987, personal communication, Table 2-2) show a decline in flow-corrected values of Se in three rivers flowing out of seleniferous areas. These decreases in Se outflow were also accompanied with decreases in total dis-solved salts (TDS) from the two Colorado sites. The TDS information was not available for the Montana site. Improvements in irrigation water manage-ment in western Colorado and modifications of the crop-fallow system in north-central Montana have occurred during this same period. These prac-tices would account for decreases in river-Se levels if also accompanied by decreases in overall salinity.
Smith et al. (1987) reported an increasing trend in arsenic (As) and cad-mium (Cd) concentrations in many of the rivers. Fossil-fuel combustion, the largest source of both elements, introduces these elements into the aquatic environment through (i) atmospheric deposition of combustion products and (ii) runoff from fly ash storage areas near power plants and other nonfer-rous smelters. Fossil-fuel combustion also releases Se to the environment
Table 2-2. Mean Se values and concentration trends over the 1974 through 1981 sampling period for river systems in seleniferous areas (R.A. Smith, 1987, personal communi-cationl.
Dissolved Se Total Se
River station Location Conc. Trendt Conc. Trend'
ikg/L pg11,
Gunnison River Near Grand 8.0 Down 10.0 Down Junction, CO
Colorado River Colorado•Utah boundary
5.5 Down 8.5 Down
Marias River Chester. MT 1.0 Down 1.0 Down
Cheyenne River Cherry Creek, SD 3.0 NS 4.0 NS Little Missouri Waterford City, ND 1.0 NS 1.0 NS Missouri River Fort Randall, SD 2.0 NS 2.0 NS
10 100 1,000 SELENIUM. mg/kg
10 100 1.000 10,000 I SELENIUM. mg/kg
r2ag ioo
c" 0 E >a 80 act
N 2
60
Nd 0.
4 oz zw
0?
O
z 20
0
ce
0.
where it could eventually appear as fallout. However, Se concentrations in many rivers may be less than the present detection limits, so changes as noted for As and Cd may not yet be measurable.
SELENIUM IN PLANTS
Accumulators versus Nonaccumulators
Rosenfeld and Beath (1964) and Shrift (1973) divided plants into three groups on the basis of their ability to accumulate Se when grown on high-Se soils. The first two groups of plants are referred to as Se accumulator or
indicator plants. These grow well on soil containing high levels of available
Se, and some have been used to locate seleniferous soils. Plants in Group 1 are called primary indicators and include many species of Astragalus,
Machaeranthera, Haplopappus, and Stanleya. These species absorb high
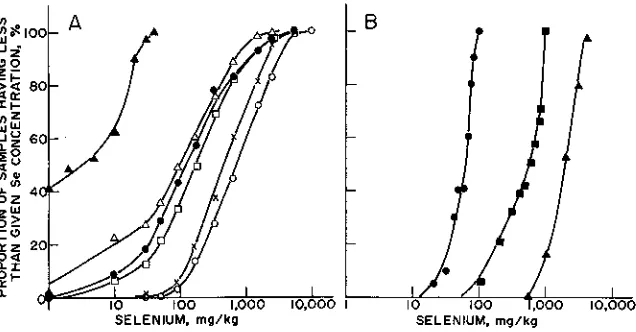
con-centrations of Se that may be in the hundered or occasionally even thou-sands of milligrams per kilogram, dry wt. (Fig. 2-4).
Plants in Group 2 are referred to as secondary Se absorbers. They be-long to a number of genera including Aster, some species of Astragalus,
Atriplex, Castilleja, Grindelia, Gutierrezia, some species of Machaeranthera, and Mentzelia. They rarely concentrate more than 50 to 100 mg Se/kg. Plants in Group 3 include grains, grasses and many forbs that do not usually ac-cumulate Se in excess of 50 mg Se/kg when grown on seleniforous soil.
Fig. 2-4. Proportion of samples having less than given Se concentration ( 070. (A) n — n Data for western wheatgrass (Pascopyrum smithii IRydb.l A. Love) and Sandberg bluegrass (Poo
secunda Presl.) sampled from seleniferous areas of Montana and Wyoming by H.F.
May-land, (1987, unpublished data); • — a Stankya spp.; • — n Xylorhiza section of Mach-aeranthera; o — q Astragalus bisulcalus; X—X Astragalus pectinatus; and o — o Oonopsis
section of Haplopappus; latter data adapted from Rosenfeld & Beath (1964). (B) • — • Data
are for vegetative wheat (Triticum aestivum L.); n — a Astragalus bisulcatus; and n — n
24
Some plants growing on seleniferous soils accumulate surprisingly low levels of Se. White clover (Trifolium repens L.), buffalograss (Buchloe
dac-tyloides [Nutt.1 Engelm.), and grama (Bouteloua sp.) are poor
accumula-tors of Se. On the other hand, high sulfur (S)-containing plants like the
Brassica sp. (mustard, cabbage, broccoli, and cauliflower) and other
Cruci-ferae are relatively good concentrators of Se (NAS-NRC, 1983). Absorption
of Se and S by plants may be correlated (Shrift, 1973).
Plant Response to Selenium Species
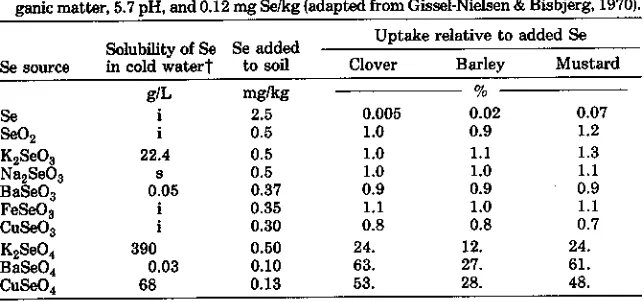
Gissel-Nielsen and Bisbjerg (1970) evaluated Se uptake by agricultural plants from various Se compounds (Table 2-3). They found in greenhouse and field studies that over a 2-yr period, red clover (Trifolium pratense L.), barley (Hordeum vulgare L.), and white mustard (Sinapis alba L.) absorbed <0.107 of the applied elemental Se, about 1.0% of the SeO2 and Seleuite forms, and 12 to 60% of the Se added as selenate (Table 2-3). In another study, Se uptake by alfalfa, barley, and sugar beet (Beta vulgaris L.) was one-third or less of that taken up by the Cruciferous mustard. Uptake by red clover decreased by a factor of six over the eight successive harvests regardless of the Se source. Selenium concentrations in clover grown on the selenate sources were 25 to 50 times that obtained from selenite, and the decrease in selenate uptake with time was about four times greater.
In another study, Gissel-Nielsen (1973) again reported that more Se was taken up from selenate than selenite by barley and red clover. With subsequent cropping, there was a greater decline in uptake from the 75Se labeled sodi-um selenate source than from the labeled sodisodi-um selenite source. Adding sulfate (Se), at rates of 0 to 375 mg S/kg soil, greatly decreased the up-take of Se from the selenate source but had a lesser effect on Se uptake from the selenite source. The ratio of Se in roots to Se in tops shows that Se is more readily translocated from the roots when taken up from added selenate than from added selenite.
Table 2-3. Selenium solubility in water and relative uptake of Se by plants from differ-ent sources labeled with 75Se in pot experiments using a loamysand having 2.8% or-ganic matter, 5.7 pH, and 0.12 mg Se/kg (adapted from Gissel-Nielsen & Bisbjerg, 1970).
Uptake relative to added Se Clover Barley Mustard mg/kg
Se
i
2.5 0.005 0.02 0.07Se02 0.5 1.0 0.9 1.2
1{2Se03 22.4 0.5 1.0 1.1 1.3
Na2 Se03 a 0.5 1.0 1.0 1.1
BaSe03 0.05 0.37 0.9 0.9 0.9
FeSe0 0.35 1.1 1.0 1.1
CuSe03 0.30 0.8 0.8 0.7
Ii2Se04 390 0.50 24. 12. 24.
BaSe04 0.03 0.10 63. 27. 61.
•uSe04 68 0.13 53. 28. 48.
Hamilton and Beath (1964) grew vegetable plants in soil-pots contain-ing either 3 mg Se/kg as selenate or 20 mg Se/kg as finely ground powder of the Se accumulating plants,
Astragalus bisulcatus
orA. preussii.
Vege-table plants grew satisfactorily and most accumulated higher concentrations of Se from the organic Se source, probably because a greater amount of bio-available Se was produced by the larger application. The absorbed Se was stored in soluble organic and inorganic forms. Selenate, but not selenite, was detected in these test plants.Selenite, selenate, and organic Se at several rates were included in another study (Hamilton & Beath, 1963) of Se uptake involving rangeland forbs and grasses. Selenium from the selenate form was generally absorbed more effi-ciently than that from the selenite form. Selenium from the seleniferous plant source was absorbed least efficiently. However, plants identified in Groups 1 and 2 (see above) absorbed comparatively large amounts of organic Se from
the soil.
-Plant uptake of selenate-Se occurs at higher rates than that of the selenite-Se. Peterson et al. (1981) suggested that selenate may be taken up actively by plants, whereas selenite may be absorbed passively and in lesser concen-trations. Nevertheless, it is the selenate source that is subject to competition from SOi- and other anions.
Plant Response to Low Bioavailable Selenium
Of plants growing on moderately low-Se soil, alfalfa accumulates more Se than does red clover, timothy
(Phkum pratense
L.) or brome grass(Bro-mus inermis
Leyss.) (Massey & Martin, 1975). Differences in Se uptake may occur, because some plants like alfalfa are deeply rooted and may access more bioavailable Se in the deeper, more alkaline subsoil horizons. No definite differences in Se accumulations have been noted among species growing on very low levels of available Se.Crops growing on neutral or acid soil absorb very little Se, and any attempt to increase crop Se uptake by shifting to some other species has been viewed with some skepticism (Ehlig et al., 1968). However, small but sig-nificant differences have been noted among selection of tall fescue growing on soil having moderately low levels of available soil Se (preliminary work by D. Sleper and H.F. Mayland, 1987). Therefore, some opportunity may exist to breed forage grasses that would take up greater concentrations of Se and could be planted in areas now considered to be Se-deficient for animals.
The Se in forages and cereal grains may not differ much among species in areas where available Se levels in the soil are low. Selenium concentra-tions in legumes and grasses vary when these plants are grown on soils where bioavailability of Se to forages is adequate for animal requirements. However, alfalfa usually contains the highest level, which may be several times as much as is in the grass forages (Massey & Martin, 1975). In these same areas, Se levels in wheat (Triticum aestivum L.) grain have been shown to be higher than in oat (Avers sativa L.) or barley.
Westermann and Robbins (1974) noted that, in many areas where S is deficient for plant growth, Se may also be inadequate for animal require-ments. Application of fertilizer S to increase forage yields may further lower forage Se concentrations either by direct competition between SO and SeOr at the soil root interface, by stimulation of growth and dilution of Se, or both.
Williams and Thornton (1972) evaluated, in the glass house, the effect of several soil additives on the plant uptake of Se from soils containing <4 to 230 mg Se/kg. Ammonium sulphate and elemental S markedly decreased the Se uptake by perennial ryegrass and red clover, with the ammonium salt giving the most persistent effect. Both the ammonium and the sulphate ions seem to be involved. Calcium orthophosphate and potassium sulphate some-times increased Se uptake, so use of these fertilizers on Se-toxic soils should be considered with caution.
Plant Response to High Bioavailable Selenium
Selenium is known to be required for animal health (0.05-0.1 mg Se/kg diet) but is not yet considered as an essential element for plant growth. Several earlier studies strongly suggested that Se was required at least for the ac-cumulator plant species. Trelease and Trelease (1938, 1939) reported a pronounced stimulating effect in the growth of Astragalus racemosus (Pursh) and A. pattersonii (Gray) ex. Brand, grown in nutrient cultures containing up to 9 mg Se/L as selenite. Both species are identified as Se accumulator plants. Astragalus crassicarpus Nutt. (also named A. succulentus by Rosen-feld & Beath, 1964), which is a nonaccumulator, was poisoned by Se at rates as low as 0.3 mg/L. These findings led the Treleases' and others (Rosenfeld & Beath, 1964; Shrift, 1969) to suggest that Se may be an essential element for the Se indicator plants. This apparent Se requirement by the accumula-tor species may be confounded by a Se x P interation, whereby the increased growth in the presence of Se could have been due to a depression of P toxici-ty by selenite (Breyer et al., 1972a). However, evidence for the P x Se inter-action was obtained using solution culture, and proof would be difficult to establish using soil cultures.
In an in-depth, solution-culture study of ionic sorption interactions in
Astragalus sp., Broyer et al. (1972b) reported the following observations:
macro-nutrient cations and the micromacro-nutrient metals in interactions which often resulted in yield differences. Where the influences were relatively well
balanced, plant growth was favorable and yields were relatively constant. Brayer et al. (1972a) observed floral initiation in 6 of 25 replicate Astragalus
bisulcatus grown in 20 ig Se/L as selenite, whereas no flowering occurred
in plants grown in the control cultures. This result, indicating a possible beneficial effect of Se, was also noted by Trelease and Trelease (1939) with A. racemosus. However, Broyer et al. (1972a) believed that the relatively large growth benefit from Se application reported by them for A. racemosus was at least in part, possibly related, to corrected phosphate toxicity in solution culture.
If either A. bisulcatus (accumulator) or A. crotolariae (nonaccumula-tor) has a requirement for Se, the critical level probably would be <80 peg Se/kg dry plant tops (Brayer et al., 1972a). This value is of the same order reported for alfalfa and/or subterranean clover (Trifoliurn subterraneum L.) (Broyer et al., 1966, 1972a). These values are much less than the comparable data suggested by Trelease and Trelease (1939) and Rosenfeld and Beath (1964), which were 3000 times and 15 000 times greater for the two legume crops, respectively.
Selenium Compounds in Plants
Shift (1973) has summarized the findings on the many chemical com-pounds of Se isolated from plants. Much of the Se in nonaccumulating species is found in the form of protein-bound selenomethionine. In contrast, the Se in accumulator plants is mostly water-soluble and found in nonprotein forms like Se-methylselenocysteine. Only trace amounts of the methylseleno-cysteine are found in the nonaccumulator species. Metabolic pathways of Se in plants probably diverge at the Se-cysteine stage to go toward protein-bound selenomethionine in nonaccumulators and to the nonprotein forms like methylselenocysteine in accumulator plants (Shrift, 1969, 1973).
Lewis (1976) summarized the metabolic differences between Se accumu-lators and nonaccumuaccumu-lators. Selenomethionine, selenocystine, and possibly Se-methyl selenomethionine and selenonium have been detected in non-accumulators but not in the non-accumulators that have been tested. Accumula-tor species can form selenocystathionine from selenate or selenite. The subsequent formation of methylselenocysteine has been found to occur only in accumulators and has been suggested as a biochemical basis for distin-guishing accumulators from nonaccumulators.
28
Selenium-containing transfer ribonucleic acids (tRNA) have been found in a number of aerobic and anaerobic bacteria, mammalian cells, and in accumulating and nonaccumulating plants (Wen et al., 1988). The Se-containing tRNA appears to be ubiquitous in the plant kingdom. However, the distribution of selenonucleoside(s) in tRNA species varies both qualita-tively and quantitaqualita-tively in different plants. This information provides evi-dence for a possible biological role of Se in higher plants. Nevertheless, the possibility that Se substituted for S in the nucleoside has not been evaluated. The Se metabolites in plants are, generally, analogs of S compounds. Nevertheless, Se metabolism in non-Se-accumulator plants cannot be identi-fied from known mechanisms involving Se metabolism (Shrift, 1973). Our understanding of the metabolic pathways for Se in plants remains very limited. Many microorganisms can reduce selenite to elemental Se. Some bac-teria and fungi have been found that reduce selenite or selenate to volatile, organic Se compounds (Shrift, 1973). Sulfur-Se antagonism occurs in these microorganisms. The reduction of selenite is enzymatically mediated, and many isolated enzyme systems can utilize S and Se analogs interchangeably. However, what was traditionally thought to be the mechanism of Se toxici-ty, namely, a general interference with the enzymes involving S assimilation, has proved to be more complex.
Selenium Toxicity in Plants
The toxicity of Se on the growth of grasses was noted as early as 1880 (Brown & Shrift, 1982). However, the concern about selenosis in plants did not really develop until the identification of selenosis in livestock and the probable Se-associated reductions in wheat production in the seleniferous areas (0.E. Olson, 1986 personal communication).
of Se tolerance. Selenium absorbed by the nonaccumulator plants is con-verted into Se metabolites, which act as analogues of essential S compounds and interfere with cellular biochemical reactions.
SELENIUM IN ANIMALS
Selenium toxicosis in aquatic and terrestrial animals has been well described in several reviews (NAS-NRC, 1983; Sorensen, 1986; Chapter 8 of this publication). Selenite, selenate, and organic Se sources produce simi-lar toxicological effects (Moxon & Rhian, 1943; unpublished data by L.F. James et al., 1986). Absorption rates vary between chemical forms. Mini-mum lethal doses may be 1.5 to 3.0 mg Se/kg body weight as selenate (Moxon & Rhian, 1943), although tolerance levels differ between and within animal species and nutritional conditions (Volcani et al., 1957).
Chronic toxicity studies have indicated that diets providing 4 to 5 mg Se/kg body weight or more of Se daily result in chronic toxicity in laborato-ry animals (NAS-NRC, 1983). The Food and Nutrition Board of the Na-tional Academy of Sciences (1980) has accepted 5 mg Se/kg diet as the critical level between toxic and nontoxic feeds.
In general, Se as selenomethionine is more readily absorbed when in-gested by animals than is selenite, selenate, or selenocystine (NAS-NRC, 1983). Nearly one-half of the Se in wheat grain is present as selenomethio-nine (Olson et al., 1970), so the Se in wheat is more readily available to animals than is the Se in selenocystine, Astragalus, or fish meal. Generally, Se from plant forms is more available to animals than Se from animal forms.
As in plants, Se in animals interacts with other trace elements. Frank et al. (1986) found 20% lower liver Cu concentrations in cattle Was taurus) supplemented with 0.58 mg Se/kg diet compared with 0.18 mg Se/kg in the control diet over a 7- to 8-month period. Koh and Judson (1987) evaluated the efficacies of oxidized Cu particles and Se bullets on the production responses in young cattle marginally deficient in both elements. The Se bullets exerted an antagonistic effect on the availability of Cu from the CuO parti-cles, as indicated by reduced Cu concentrations in the whole blood, plasma, blood cells, and liver. Animal weight gains were significantly increased when both Cu and Se were supplemented, but not when provided individually. This has practical applications because Cu deficiency has been reported in areas where cattle and sheep (Ovis cries) are often supplemented with Se (H.F. Mayland, 1986, personal observation).
Linseed oil meal has been found effective in reducing the toxicity of Se in rat diets (Palmer et al., 1980). The protective substances were cyanohydrin glycosides, which upon hydrolysis yield HCN. Conceivably, cyanide released from the glycosides might react with some of the Se compounds to form selenocyanates, which could be excreted by the animal. Therefore, excess levels of Se can be detoxified by feeding or injecting cyanide (Palmer & Olson,
1979), since Se and cyanide tend to counter the toxicity of the other.
FECAL AND URINARY SELENIUM
Urine is the primary route of Se excretion by monogastric animals, regardless of whether the Se is given orally or injected. The main route of Se excretion in ruminants, though, is a function of the method of adminis-tration and the age of the animal (NAS-NRC, 1983). When Se is ingested by ruminants, most of it is excreted in feces. In contrast, Se that is injected either intravenously or subcutaneously into ruminants is excreted mostly in urine. Lambs, and presumably calves, that have not developed rumen func-tion can excrete 66 to 75% of the orally ingested Se in the urine. Since most exogenous fecal Se is likely Se that has been reduced to an unavailable form such as elemental Se (Langlands et al., 1986), rumen organisms undoubted-ly contributed to this age effect.
Nearly all of the Se excreted in the feces of ruminants is in an unavaila-ble form and very little is availaunavaila-ble for uptake by plants. Peterson and Sped-ding (1963) showed that <0.3%a of the Se taken up by three pasture species originated from the Se contained in sheep manure during a 75-d study. The manure was obtained from sheep dosed orally with isotopically labeled selenite.
Trimethylselenonium ion (TMSe +) is an important urinary Se metabo-lite. When added to nutrient solutions, TMSe + was readily absorbed and translocated to leaves and stems, but not to the grain of wheat (Olson et al., 1976a). However, large differences were observed in Se uptake by barley, wheat, and alfalfa when TMSe + was applied in a soil-pot study in the green-house. The authors noted that very little of the Se from TMSe 4- was ab-sorbed by plants, and some of the abab-sorbed TMSe + was even lost to the atmosphere through volatilization from the plant. Therefore, TMSe + ex-creted in animal urine likely contributes little biologically active Se to plants. A portion of the Se added to soil as TMSe + was also biologically volatilized, and this loss was increased by liming the soil at rates to increase the pH from 5.45 (initial) to values of pH 7.05 (Olson et al., I976b). In ad-dition, 30 to 50% of the Se added as TMSe + to several different soils was sorbed to the soil particles during a 21-d period. The biologically inactive TMSe + in urine plus the stimulation of plant growth by the N and S added in the form of urine may explain the lowered Se contents in grass growing
SELENIUM VOLATILITY
Volative Se compounds are naturally released into the atmosphere as a result of biological activity in aquatic (Chau et al., 1976) and terrestrial ecosystems (Abu-Erreish et al., 1968; Doran & Alexander, 1977). The path-ways for Se volatilization in higher plants have been reviewed by Lewis (1976). The volatile compounds include dimethyl selenide (DMSe), dimethyl di-selenide, dimethylselenone, methane selenol, and hydrogen selenide (Zieve & Peterson, 1981, 1984c).
Dimethyl selenide is the principle compound released by microbial and plant respiration (Lewis et al., 1966, 1974; Francis et al., 1974). Volatile Se was first collected from accumulator and nonaccumulator plants by Lewis et al. (1966, 1974), and the volatile Se respired by the accumulator A. racemo-sus was identified as DMSe (Lewis et al., 1974). Although DMSe was not found in the volatiles from a nonaccumulator Astragalus (Evans et al., 1968), failure to detect the DMSe in this latter case may possibly relate to detection levels or to differences in metabolism.
Seven calciferous species gave off volatile Se during growth on nutrient media containing selenite or selenate. The rate of Se respiration varied from <0.05% of leaf-Se per hour to 0.40% per hour (Lewis, 1976). The DMSe was identified as the single volatile Se compound produced by fresh cabbage leaves.
Zieve and Peterson (1985) observed that 75 SeDMSe was also sorbed to soils. The amount sorbed was greater for wet soils than dry and was greater when the atmospheric concentration of DMSe was high than when it was low. Sorption of DMSe by individual soil constituents was greatest for or-ganic matter and clays, less for Mn and Fe oxides, and least for acid-washed sands. Experiments with sterilized soils indicated that microorganisms were not significantly involved in the sorption process but may have been respon-sible for the conversion of DMSe to other Se forms after sorption occurred. They concluded that the soil was an important natural sink for atmospheric DMSe.
Under certain conditions, significant quantities of Se as DMSe are respired by animals as a volatile compound having a garlic-like odor (Mar-tin, 1973; Sternberg et al., 1968). This compound is formed in animals by methylating selenite. The amount exhaled increases with increasing Se in-take and is greater for orally administered selenite than selenate, selenomethio-nine, or seleniferous wheat (Martin, 1973). The formation of DMSe can be inhibited by As, Cd, and other heavy metals. This method of Se excretion is an important mechanism by which the animal removes Se from the body, especially when the diet is relatively high in Se.
SELENIUM AS A FERTILIZER
Selenium fertilization is briefly discussed to provide information to in-terested agronomists and animal nutritionists.
The clay fraction and organic matter content in soil play a major role in the bioavailablilty of Se, especially selenite, which is readily sorbed to these soil constituents. Selenate is less readily sorbed in finer-textured soils or soils with higher organic matter concentrations. Consequently, selenate is usual-ly absorbed from soils by plants more readiusual-ly than is selenite (Carter et al., 1969). Greater absorption of selenate may also result from differences in root permeability or that selenite is reduced to elemental Se on the root surface. Although sulfate-S exerts little effect on selenite uptake, it competes with the absorption of selenate (Gissel-Nielsen, 1973; Westermann & Robbins,
1974).
The development of a safe and effective Se fertilizer must consider the chemical form, its solubility under the range in soil pH and redox poten-tials, and the rate and amount of Se uptake by the plant. The application of lime or companion fertilizer containing phosphate, sulfate, or N can also affect Se concentrations in the herbage (Gissel-Nielsen, 1973; Milchunas et al., 1983). These materials may contain small amounts of Se, or they may stimulate root growth and subsequent uptake of soil Se (Carter et al., 1972; Westermann & Robbins, 1974). Application of these nutrients often stimu-late forage yields, thereby diluting the Se concentration in the forage (H.F. Mayland, 1975 unpublished data).
Fertilizers made from rock phosphates may contain as much as 200 mg Se/kg (Rader & Hill, 1935; Robbins & Carter, 1970; Senesi et al., 1979). These concentrations are generally much higher than those measured in fertilizers derived from rock carbonates, synthetic N fertilizers, and even potassium sulfate (Senesi et al., 1979). Thus, some fertilizer materials may contribute Se for use by higher plants.
Selenium-deficient soils are often S-deficient, especially for the produc-tion of legumes. The applicaproduc-tion of sulfate fertilizers can simultaneously stimulate plant growth and compete with soil selenate for absorption sites on the root and transport mechanisms in the plant. Increasing the concen-trations of sulfate-S in the forage also may have detrimental effects on Se availability to the animal (Hintz & Hogue, 1964; Pope et al., 1979).
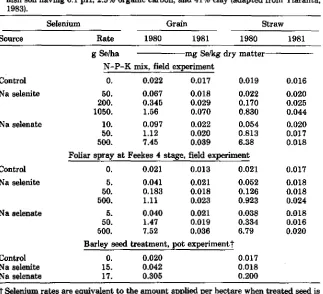
Table 2-4. Selenium uptake by barley straw and grain from soil-applied Se fertilizer, foliar-applied Se spray or Se-treated seed in 1980 and the residual response in 1981 on a Fin-nish soil having 6.1 pH, 2.5% organic carbon, and 41% clay (adapted from Ylaranta, 1983).
Selenium Grain Straw
Source Rate 1980 1981 1980 1981
g Se/ha mg Se/kg dry matter
N-P-K mix, field experiment
Control 0. 0.022 0.017 0.019 0.016
Na selenite 50. 0.067 0.018 0.022 0.020
200. 0.345 0.029 0.170 0.025 1050. 1.56 0.070 0.830 0.044
Na selenate 10. 0.097 0.022 0.054 0.020
50. 1.12 0.020 0.813 0.017
500. 7.45 0.039 6.38 0.018
Foliar spray at Feekes 4 stage, field experiment
Control 0. 0.021 0.013 0.021 0.017
Na selenite 5. 0.041 0.021 0.052 0.018
50. 0.183 0.018 0.126 0.018
500. 1.11 0.023 0.923 0.024
Na selenate 5. 0.040 0.021 0.038 0.018
50. 1.47 0.019 0.334 0.016
500. 7.52 0.036 6.79 0.020
Barley seed treatment, pot experimemtt
Control 0. 0.020 0.017
Na selenite 15. 0.042 0.018
Na selenate 17. 0.305 0.200
t Selenium rates are equivalent to the amount applied per hectare when treated seed is planted at the rate of 200 kg/ha.
The addition of selenite to acid or neutral soils results in immobiliza-tion of some Se. This process includes sorpimmobiliza-tion of selenite, probably by hydrous sesquioxides, which reduces the solubility of Se to plants so that they can take up protective (for animal requirements), but not toxic levels of Se. The other major process resulting in the immobilization of Se is the reduction of selenite to elemental Se, selenide, or both. This reduced Se ap-parently is unavailable to plants in the short term and its oxidation to more available forms may be slow (Cary et al., 1967).
fer-34
tilizers and (ii) spraying plants at the midtillering stage (Feekes 4), but not by seed treatment (Table 2-4). On the basis of these investigations, one can
conclude that selenite is a better source than selenate when the
concentra-tion in plants is to be raised to a sufficient but not excessive level for livestock nutrition.
The application of 10 g Se/ha as selenite to pastures has been suggested (Gissel-Nielsen, 1984). The Se is applied with a carrier fertilizer such as cal-cium ammonium phosphate. A method now legally used in New Zealand is the top-dressing of pastures with Se prills (Gissel-Nielsen, 1984). Kork-man (1985) reported that only New Zealand and Finland had approved the addition of Se to fertilizers with which feedstuffs and food were produced. Contrary to the suggestions of Gissel-Nielsen, both countries use the selenate form at rates of about 10 g Se/ha. In New Zealand, 1 070 Se granulate is mixed with the granulated fertilizer in bulk blending equipment, whereas in Fin-land a 1% Se solution is sprayed into a granulation drum and Se is thus dis-tributed into all fertilizer granules at an equivalent rate of 6 g Se/ha for silage and 16 g Se/ha for cereal. In New Zealand about 0.5 x 10 6 ha and in Fin-land about 2.3 x lo b ha would be treated annually, beginning in 1985.
SELENIUM IN COAL AND MUNICIPAL REFUSE COMBUSTION
Redistribution of Selenium
Natural weathering of the earth's crustal material results in an estimated 1.0 x 10 6 kg and 7.2 x 10⁶ kg Se being mobilized annually and transport-ed by rivers draining the land mass in the continental USA and world, respec-tively (Goldberg et al., 1971; Turekian, 1971). In addition, relarespec-tively small, but often detectable amounts of volatile Se compounds are released into the atmosphere as a result of biological activity in terrestrial and aquatic ecosystems (Peterson, 1980; Zieve & Peterson, 1984b). This small amount may be quite important on a global basis.
vapors are discharged as aerosols to the atmosphere, only to enter the ter-restrial and aquatic environment by wet or dry deposition.
A Se mass balance study was conducted at the Allen Steam Plant in Mem-phis, TN (Andren et al., 1975). This plant was equipped with a high-efficiency electrostatic precipitator that allowed only 0.5% of the total incoming fly ash to be exhausted to the atmosphere. However, as much as 15 to 20% of the 0.1 to 0.5 MMAD particles and a very large portion of the <0.1
yin MMAD particles were lost as aerosols. Of the 2.2 mg Se/kg coal
enter-ing the boiler, 0.3% exited with the slag, 68% was with the precipitated fly ash particles, and the remaining 32% was associated with the vapor phase. The Se in the slag, fly ash, and vapor phases was identified as elemental Se. However, some of this Se must occur as or eventually become bioavailable, because fly ash is a good source of Se for higher plants (see section on Bio-availability of Fly Ash Selenium, below).
An estimated 6 x 10 !1 and 28 x 10 11 kg of coal (having about-11% ash) are combusted annually in the USA and world, respectively (Andren et al., 1975). Perhaps coal consumption has been reduced or data were cal-culated differently, because Eisenberg et al. (1986) quoted a figure of 4.5
x 10 10 kg of fly ash produced in the USA in 1980.
Upon combustion, about 40% of the ash occurs as bottom ash or slag, 60% as fly ash, and < 1% as aerosols that escape to the atmosphere (Eisen-berg et al., 1986). These proportions may differ for other coal-boiler plants, because of design and operating conditions. Selenium concentrations in these components at the Allen Steam Plant were 2.2, 0.08, 28, and 88 mg Se/kg for the bulk coal, slag, fly ash, and aerosol fractions, respectively.
Selenium Enrichment Factors in Aerosols, Particulates, and Precipitation
The Se enrichment of a given fraction relative to crustal rocks provides a useful index to follow the preferential movement of Se (or other elements) in the environment. The enrichment factor (EF) for Se is calculated as follows:
EF = (Se/Al)aerosol/(Se/AI)crust
The term (Se/A Oaerosol is the ratio of the Se concentration to that of AI in the aersol and the (Se/A1)crust is the ratio of the elements in igneous rocks of the upper continental crust (Wedepohl, 1971). This approach assumes that Al is conserved in the combustion process and thus the EF for Al is 1.0. The EF values could also be calculated for the Se enrichment in the ash or other carrier. Similar EF values of 84 and 132 were calculated for Se in ash from 11 coal-fired power plants in the United Kingdom and 23 in the USA, respec-tively (Wadge et al., 1986; Furr et al., 1977).
36
calculated EF of the 2 MMAD particle was 2 times that of the 50-pm particle. In another study conducted in the USA (Campbell et al., 1978), the EF for Se in the fine particles compared to larger particles was 9.9, illustrat-ing that some variation occurs between coal plants or in samplillustrat-ing and ana-lytical techniques.
High combustion temperatures volatilize some of the Se in the coal, which then leaves the furnace in the gaseous phase. Fly ash and gases begin to condense as they move through the particle scrubbers and ascend the stacks. Most of the larger particles and the Se associated with them are trapped by the scrubbers. However, the remaining Se probably condenses on the smaller particles that escape the stack and enter the atmosphere as aerosols. The degree of preferential enrichment may be a function of the individual power plant and current operating conditions. The amount of Se leaving the stack will be a function of the Se content of the coal, particle size, combustion temperature, efficiency of particle scrubbers, temperature of flue-gases, and exit velocity.
Another source of aerosols that can enter the atmosphere and contrib-ute to global cycling of Se is the incineration of refuse. Nationally we gener-ate 16 x 101° kg of municipal refuse annually in the USA (Lemley, 1987). While incineration of wastes would reduce this mass, it would also be a source of aerosol and ash residues. In the United Kingdom, municipal refuse in-cineration consumed 3 x 10⁹ kg of material annually generating 1 x 10⁹ kg ash residue (Wadge et al., 1986). Unlike coal-fired power plants, more bottom ash is produced than fly ash. Refuse incinerators operate at lower temperatures (800-1100 °C) compared to coal furnaces that operate at near-ly 1500 °C. Coal fnear-ly ash is composed of cenospheres of < 20 pm MMAD, whereas refuse fly ash consisted mostly of amorphous particles of < 50 pm MMAD.
Wadge et al. (1986) reported that refuse fly ash from an incinerator located in the United Kingdom contained 2.5 to 6.6 mg Se/kg with a mean value of 4.4. The Se in this refuse fly ash had an EF of 93 compared with an EF of 98 reported for refuse fly ash from an incinerator in the USA (Green-berg et al., 1978a). These EF values are similar to those given for coal-derived fly ash of 84 and 132 given above. Greenberg et al. (1987b) reported an EF of 4500 for Se in aerosols above a refuse incinerator in the USA, possibly reflecting the larger particle sizes and cooler incinerator temperatures when compared with data for coal furnaces (Andrean et al., 1975). Although the EF values of Se are similar for the two refuse incinerators, one should not assume that all municipal refuse is alike or their Se concentrations the same. Measurable differences may exist among Se concentrations in refuse from rural vs. industrial vs. metropolitan areas.
1971; Rahn & Lowenthal, 1985; Scheff et al., 1984). The EF for Se increased exponentially as particle size decreased. About 79% of the aerosol Se was associated with the <2.0 pm MMAD particles.
The relative Se sorption to the particle is inversely related to particle size (Chiou & Manuel, 1986) and is likely a surface phenomena. A halving of the diameter of a sphere causes a doubling of the surface area for the same mass of particles. The particle distribution at Rolla, MO, may have been affected by the lead mines and smelters in the area. Most important is the fact that 70% of the particles collected by Chiou and Manuel (1986) were < 2.0 p.m compared to the > 2.0 tan particles collected in other studies reported here.
The computed EF values for select elements in the bulk Missouri aero-sol (particles of 0.01-7 Am MMAD) were:
Tellurium 12 000
Selenium 2 200
Antimony 1 900
Sulfur 780
Arsenic 320
Zinc 110
Chlorine 56
Manganese 5.6
Calcium 1.7
Aluminum 1.0
Small EF values indicate little redistribution of the element among various materials, whereas the large EF values indicate considerable redistribution. The EF for the Se in the 0.01 to 1.1 Am MMAD particles was about 50 000, which is much greater than the 2200 value calculated for the bulk aerosol. Upon combustion, coal-derived Se is preferentially partitioned to the submicron-sized particles, which are easily transported over long distances. This might account for the high enrichment factors of 18 000 reported for Se aerosols at the South Pole (Zoller et al., 1974) and the similar EF of 22 000 reported at Memphis, TN (Andren et al., 1975). Although these values are greater than the value of 2200 calculated for the Se in aerosols captured in Missouri (Chiou & Manuel, 1986), the two previous aerosols likely contained much smaller particles than those from Missouri.
en-38
riches Se in wet depositional fluxes to western Atlantic surface waters. They measured an average of 30 and 170 ng Se/L in rainwater samples collected over Bermuda and Lewes, DE, respectively. On occasion, values as high as 300 ng Se/L were encountered over the Lewes site. They calculated that the wet depositional flux at Lewes, DE, was about 15 ng Se/cm 2 per year (given as 190 pmol/cm 2 per year). That amount is equivalent to 1.5 g Se/ha an-nually, which is about one-tenth the amount of fertilizer Se that is applied annually in Se-deficient areas such as Finland and New Zealand. The wet depositional flux calculated by Cutter and Church (1986) falls between the values estimated by Ross (1985) for remote continental (75 pmol/cm 2 per year) and urban (840 pmol/cm 2 per year) wet deposition.
Selenium's oxidation state in precipitation may be a sensitive oxidation-reduction (redox) tracer (Cutter & Church, 1986). The authors found that the range of selenite/selenate values was generally small [Se(IV)/Se(VI) =
1.26 ± 0.95]. Two samples with the highest selenite/selenate ratios (15-20) came from storms traveling in northerly directions, placing the coal-fired Indian River Station power plant 30 km upwind of the rain sampler. They calculated an apparent redox intensity of the precipitation, but suggested that more data were needed to accurately determine the oxidation intensity of air masses.
Andren et al. (1975) reported that Se in the fly ash and aerosols retrieved from the Allen Steam Plant was all in the elemental form (Se 0). Cutter and Church (1986) detected selenide plus elemental Se in only one sample account-ing for 28% of the total Se. The remainaccount-ing (72%) Se occurred as selenite and selenate. Fly ash has been shown to contain sufficient concentrations of bioavailable Se that it could serve as a supplemental nutrient source for plants and animals (Purr et al., 1975, 1976a, 1977, 1978).
Suzuki et al. (1981) and Cutter (1978) reported that selenite was the major Se species in rainwater samples collected in Japan and on the California coast. Robberecht and van Grieken (1980) reported variable quantities of both selenite and selenate in the rain and snow samples collected from an urban area in Belgium.
Bioavailability of Aerosol Selenium
the blood was different, but once absorbed, both chemical forms behaved identically. In a second study, Weissman et al. (1983) used beagle dogs
(Canis
familiaris)
and calculated that the animals absorbed 52 and 73% of the Sefrom the Se metal and selenious acid aerosols, respectively. In this study the aerosols had 0.7 and 0.5 MMAD, respectively. Selenium absorption from the Se° or H2SeO 3 forms was 73 and 96% when given by stomach pump and
10 and 50% when given in the feed, respectively. Selenium that was absorbed into the blood was translocated to various organs with a whole-body biolog-ical half-life of 34 d. Urine was the major route of excretion, accounting for 70 to 80% of the excreted Se.
Atmospheric deposition patterns, based on elemental concentrations in mosses, have been reported in Norway (Rambaek & Steinnes, 1980). More recently, Froslie et al. (1985) measured the trace element concentration in the livers of 6 to 8 month old lambs that had grazed on unfertilized moun-tain pastures at 11 different geographical areas in that country. They reported correlation coefficients for elemental concentrations in liver vs. atmospheric deposition of each element as follows:
Pb: 0.94*** Cd: 0.78" Se: 0.73** As: 0.66** Mo: 0.30 Zn: 0.04 Cu: —0.21
(**P<0.01, ***P<0.001)
These values strongly indicate a relationship between atmospheric deposi-tion of several trace elements, including Se, and intake by grazing animals. The Se intake by the lambs may not only be due to the metal concentration sorbed by the plants from the atmospheric fallout but could be affected by ingestion of soil (Mayland et al., 1975), since surface soils showed a similar trace element contamination pattern. Froslie et al. (1985) concluded that the Se fallout from aerosol sources over southern and southwestern Norway played a beneficial role in reducing the incidences of Se-deficiency disorders in livestock.
Bioavailahility of Fly Ash Selenium
Approximately 26 to 33 x 10 9 kg fly ash were generated annually in the USA between 1975 and 1980 (Combs et al., 1980; Furr et al., 1976a). Some of this fly ash has been used as a soft aggregate in construction appli-cations and as filter aids in processing municipal sewage. Because these ap-plications consume only a small fraction of the total production, its possible use in agriculture has been investigated.
Fly ashes vary greatly, not only in particle size and elemental composi-tion, but also in pH (Furr et al., 1977). Use of these ashes as soil amend-ments could affect the availability of Se and other eleamend-ments, both in the ash and in the soil, and should be carefully evaluated. The pH of the ash, con-centration of total soluble salts, and presence of elements toxic to plants are factors that affect growth and elemental concentration in the plant.
Several studies have shown that at least a portion of the Se in fly ash is available for uptake by plants grown naturally or experimentally on fly ash or on soils amended with fly ash (Combs et al., 1980; Furr et al., 1976a, 1978; Gutenmann et al., 1979; Stoewsand et al., 1978). Furr et al. (1976a) found that the amount of Se absorbed by the edible portion of several vegeta-bles was proportional to the amount of coal-derived fly ash amendment added to the soil. In that study, the plants absorbed less Se during the second crop-ping than during the first. In another study (Gutenmann et al., 1979), the Se in fly ash was steadily released over five successive cuttings of alfalfa, birdsfoot trefoil (Lotus corniculatus L.), bromegrass, orchardgrass, and timothy.
Agricultural uses of refuse-incinerator fly ash may be more restricted than those for coal-derived fly ash. For example, the incinerator fly ash used in a study by Wadge and Hutton (1986) not only contained 4.3 mg Se/kg but also had high concentrations of Cd (450 mg Cd/kg) and Pb (8200 mg Pb/kg). These heavy metals can affect plant growth and have a negative im-pact on the nutritional value of the crops. Cabbage [Brassica oleracea
(Capita-ta Group)] and barley were grown on soil con(Capita-taining from 0 to 40% (wt./wt.)
of the incinerator fly ash. Plant growth was reduced by the fly ash, and the yield of the barley crop in the 40% amendment group was only about 30% of the control value. The first crop of cabbage and barley contained 0.51 and 1.08 mg Se/kg, respectively, when grown in media containing 20% ash (wt./wt.) compared with 0.01 and 0.07 mg Se/kg when grown in the control media not containing ash.
Corn (Zea mays L.) was grown in two successive years on soil amended with 1 x 10 6 kg/ha (500 tons/acre) coal-derived fly ash (Combs et al., 1980). Use of the fly ash resulted in a sevenfold increase in total Se in corn grain produced during the two seasons after application of the fly ash. The Se in this corn had a bioavailability to chicks (Gallus gallus) of about 46% when compared with that of selenite.
[Melilo-tus officinallis (L.) Pa11.], grown on fly ash containing 5.3 mg Se/kg, was
formulated at 35 070 of a diet fed to hamsters (Mesocricetus auratus) and guinea pigs (Cavia porcellus) for 90 d (Furr et al., 1975). Sheep and goats (Capra
hircus) were fed a pelleted diet containing seleniferous white sweet clover (Melilotus alba Medik.) harvested from a fly ash disposal area. The sweet
clover contained 66 mg Se/kg, but as prepared contained only 15.5 mg Se/kg, which was fed for 173 d. In yet another study, wheat grain containing 5.7 mg Se/kg, was fed to Japanese quail (Coturnix coturnix japonica). The wheat had been grown on fly ash containing 21 mg Se/kg (Stoewsand et al., 1978). Feed consumption and weight gains in each of these studies were not ad-versely affected by the seleniferous diets. Although body tissues from animals fed the seleniferous diets contained elevated levels of Se, outward signs of selenosis were not evident.
SELENIUM IN MUNICIPAL SEWAGE SLUDGE
Municipal sewage sludge represents a major portion of the national solid-waste disposal problem with an estimated 4.5 x 10 1° kg produced in 1968 (Furr et al., 1976b). Furr et al. (1976c) measured the elemental concentra-tions in sludges collected from 16 U.S. cities and reported that the spectrum and concentration of heavy metals in the sludge was generally a function of the industry in the area. Selenium concentrations in the 16 sludges ranged from 1.7 to 8.7 mg Se/kg, with an average of 3.2 mg Se/kg.
The bioavailability of the Se (and other metals) becomes an important factor in the disposal of sewage sludges. A heat-treated, waste-activated sludge from the city of Milwaukee, WI, has been marketed commercially as Milor-ganite, a soil conditioner for application on lawns and gardens. The product contains 1.8 mg Se/kg. Furr et al. (1976b) grew a variety of garden crops in pots with soil containing 10% Milorganite by weight. At harvest, the edible portions of these crops had significantly greater concentrations of Se than for those plants grown on the control soil, but the increase may not have been biologically significant.
Waste from feed lots, poultry houses, and municipal sewage treatment plants have also been evaluated as a supplemental feed for livestock. The manures tested by Capar et al. (1978) contained 0.5 to 0.7 mg Se/kg, whereas the Denver municipal sludge contained 4.6 soluble and 7.2 mg/kg total Se. Feeding the Denver sludge as 0, 4, or 12% of diet to 340 kg steers provided diets containing 0.16, 0.35, or 0.72 mg Se/kg (Kienholz et al., 1979). The sludge provided very little metabolizable energy, and animal weight gains were less compared with control animals. There was a trend (P > 0.05) for increasing Se concentrations in liver; 1.3, 1.7, and 4.2 mg Se/kg (dry basis) for the three treatments, respectively. Selenium concentrations in dried blood were 1.3, 1.7, and 12 mg Se/kg, respectively (P < 0.05).
42 MAYLAND ET AL.
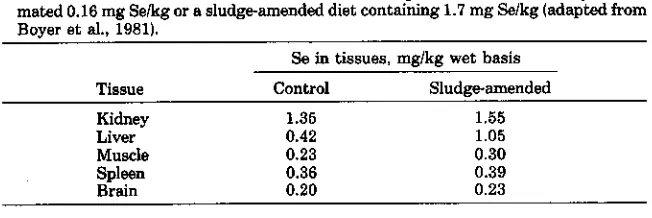
Table 2-5. Selenium levels in tissues of cattle receiving a basal diet containing an esti-mated 0.16 mg Selkg or a sludge-amended diet containing 1.7 mg Selkg (adapted from Boyer et al., 19811.
Se in tissues, mg/kg wet basis
Tissue Control Sludge-amended
Kidney 1.36 1.55
Liver 0.42 1.05
Muscle 0.23 0.30
Spleen 0.36 0.39
Brain 0.20 0.23
provided 1.7 mg Se/kg of diet. Tissues obtained after slaughter of these animals showed small, but consistent, increases in Se concentration as a result of sludge supplementation, compared with tissues from animals on the basal diet (Table 2-5).
Although the energy-depleted sludges are not likely to be used in livestock rations because of reduced animal performance, these wastes could be used as soil conditioners in gardening, landscaping, and cropping situations where they provide organic matter and some plant nutrients. However, the Se con-centrations found in municipal sludges tested to date are not threatening the quality of edible produce grown on sludge-amended soil.
AGRONOMIC IMPACTS ON SELENIUM WEATHERING
Crop-Fallow Versus Seleniferous Cretaceous Materials
Humans have also impacted the natural weathering rate of seleniferous materials by choice of cropping systems. This has occurred in many areas of the Great Plains that once were rangelands, but now are largely in dryland grain production. This type of agriculture has been possible because of the adoption of a crop-fallow system.
Fallowing in alternate years conserves extra water for use by the next year's grain crop. However, this cropping system, especially in years of above average precipitation, allows excess water to percolate beyond the root zone where it may contact the underlying Cretaceous geologic formations (Brown et al., 1983). The percolating water may then encounter impervious layers and move laterally to intersect the surface, forming a spring or seep. These
seeps have a detrimental impact on the area because of their high salinity.
7.9 mg/L. Colorado 7.6 275 866 1317 17.7 0.28 12.1 534 141 6041 57 4.6 9262 0.308 Montana 120 71 670 6.1 0.26 11.6 722 177 1143 6.1 2.0 2928 0.0276 F ratiot 7.1 37 41 12 NS NS NS 8 NS 38 32 26 32 35 Component pH Ca Mg Na Fe Si02 fiCO3 CI 804 NO3 Sr TDS Se
Table 2-6. Water chemical-data for samples taken from the Cretaceous-aged Colorado or Montana Group formations in central Montana (Donavan et al., 1981).
t F ratios for chemical constituents calculated in a one-way analysis of variance between data of the two groups. F = 6.75 or 11.1 at P 0.01 or 0.001, respectively. NS = not significant, all F values <1.0.
unweathered shale in areas where saline-seep discharges occur. The hydrol-ogy of these local hydrologic systems, including both contributing and seep area, is described by Brown et al. (1983) and Donovan et al. (1981).
Water chemistries were determined on 81 samples collected from domes-tic, livestock, or research wells drilled into the cretaceous formations of central Montana (Donovan et al., 1981). The chemistry of each sample was closely related to the particular geological source (Table 2-6). Water samples from the Colorado group have higher proportions of Mg, SO4 , NO3 , and Se when compared with water obtained from the Montana formations. Selenium con-centrations in these waters ranged from <2 to 1400 Ag Se/L.
Irrigation Versus Seleniferous Cretaceous Materials
Humans have also impacted the Se cycle through the use of leaching fractions to remove excess salts from the root zone of irrigated agricultural crops. In the western part of the San Joaquin Valley, these leaching frac-tions have intercepted soluble Se initially derived from the Cretaceous Moreno shales (Tanji et al., 1986). Drains were installed to lower the groundwater table underlying the farmland. The drainage water contained soluble salts including Se, which were then drained to and concentrated in the evapora-tion ponds at the Kesterson Reservoir. The Se was now accessible to aquatic life and sufficiently available to alter the spectrum of bacterial genera present (Burton et al., 1987) and to cause chronic and acute toxicosis of the aquatic wildlife (see Chapter 8 of this publication).
SUMMARY
re-44 MAYLAND ET AL.
quirements in many areas, and (iii) its toxicity to animals and plants in other areas where it occurs in high concentrations in soil, water, plants, or in aerosols. Animals require 0.05 to 0.1 mg Se/kg in their diets to prevent Se deficiency, but suffer Se toxicosis when dietary levels exceed 5 to 15 mg Se/kg. If plants require Se, the critical level is <0.08 mg/kg.
Selenium occurs in several valency states controlled by the pH and Eh of the soil. The Se 6+ , and to a lesser extent Set+ , salts are water soluble and are the predominant forms absorbed by plants. Animals easily absorb selenate and to a lesser extent selenite sources, but seem to best utilize the amino and proteinaceous forms found in plants.
The earth's crustal materials generally contain <0.1 mg Se/kg. Higher concentrations are found in Cretaceous shales. The Se-accumulator plants growing on seleniferous soils may contain hundreds or even thousands of mg Se/kg. However, the nonaccumulator grasses and forbs seldom accumu-late >50 mg Se/kg and more often contain <5 mg Se/kg.
Anthropogenic activities impact the amount of Se entering our nation's lakes, rivers, and the atmosphere. Combustion of coal and incineration of municipal waste exhaust Se into the environment. In addition, crop-fallow and irrigation practices that allow leaching waters to pass through selenifer-ous strata, prior to intersecting with surface flow, augment the Se levels en-countered by various segments of plant and animal life.
An improved understanding of Se in the agroecosystem will allow us to constructively manage this element in areas where it is now deficient for animal nutrition and other areas where it exists at levels leading to toxicosis in animals and plants.
ACKNOWLEDGMENTS
The authors thank Drs. W.H. Allaway, E.E. Cary, A.C. Chang, O.E. Olson, M. Coburn Williams, and the anonymous reviewers for their helpful comments. The senior author especially thanks Dr. I.S. Palmer for allowing access to his extensive file of Se literature.
REFERENCES
Abuereish, G.M., and J.N. Lahham. 1987. Selenium in soils and plants of the Jordan Valley. J. Arid Environ. 12:1-7.
Abu-Erreish, G.M., E.I. Whitehead, and 0.E. Olson. 1968. Evolution of volatile selenium from soils. Soil Sci. 106:415-420.
Adriano, D.C. 1986. Trace elements in the terrestrial environment. Springer-Verlag, New York. Allaway, W.H. 1968. Agronomic controls over the environmental cycling of trace elements.
Adv. Agron. 20:235-274.
Allaway, W.H., E.E. Cary, and C.F. Ehlig. 1967. The cycling of low levels of selenium in soils, plants and animals. p. 273-296. In G.H. Muth (ed.) Symposium: Selenium in biomedi-cine. AVI Publishing Co., Westport, CT.
Anderson, M.S., H.W. Lakin, K.C. Beeson, F.F. Smith, and E. Thacker. 1961. Selenium in agriculture. USDA Agric. Handb. 200. U.S. Gov . Print. Office, Washington, DC. Andres, A.W., D.J. Klein, and Y. Talmi. 1975. Selenium in coal-fired steam plant emissions.
Environ. Sci. Technol. 9:856-858.
Bennett, W.N., A.S. Brooks, and M.E. Boraas. 1986. Selenium uptake and transfer in an aquatic food chain and its effects on fathead minnow larvae. Arch. Environ. Contain. Toxicol. 15:513-517.
Bertram, P.E., and A.S. Brooks. 1986. Kinetics of accumulation of selenium from food and water by fathead minnows. Water Res. 20:877-884•
Boyer, K.W., I.W. Jones, D. Linscott, S.K. Wright, W. Stroube, and W. Cunningham. 1981. Trace element levels in tissues from cattle fed a sewage sludge-amended diet. J. Toxicol. Environ. Health 8:281-295.
Brown, P.L., A.D. Halvorson, F.H. Siddoway, H.F. Mayland, and M.R. Miller. 1983. Saline-seep diagnosis, control, and reclamation. Conserv. Res. Rep. U.S. Dep. Agric. 30:1-22. Brown, T.A., and A. Shrift. 1982. Selenium: Toxicity and tolerance in higher plants. Biol. Rev.
57:59-84.
Broyer, T.C., C.M. Johnson, and R.P. Huston. 1972a. Selenium and nutrition of Astragalus. I. Effects of selenite or selenate supply on growth and selenium content. Plant Soil 36:635-649.
Broyer, T.C., C.M. Johnson, and R.P. Huston. 1972b. Selenium and nutrition of Asiragalus. II. Ionic sorption interactions among selenium, phosphate, and the macro- and micronutrient cations. Plant Soil 36:651-669.
Broyer, T.C., D.C. Lee, and C.J. Asher. 1966. Selenium nutrition of green plants. Effect of selenite supply on growth and selenium content of alfalfa and subterranean clover. Plant Physiot. 41:1425-1428.
Burton, G.A. Jr., T.H. Giddings, P. DeBrine, and R. Fall. 1987. High incidence of selenite-resistant bacteria from a site polluted with selenium. Appl. Environ. Microbiol. 53:185-188. Campbell, J.A., J.C. Laul, K.K. Nielson, and R.D. Smith. 1978. Separation and chemical
charac-terization of finely-sized fly-ash particles. Anal. Chem. 50:1032-1040.
Capar, S.G., J.T. Tanner, M.H. Friedman, and K.W. Boyer. 1978. Multielement analysis of animal feed, animal waste, and sewage sludge. Environ. Sci. Technol. 12:785-790. Carter, D.L., M.J. Brown, and C.W. Robbins. 1969. Selenium concentrations in alfalfa from
several sources applied to a low selenium, alkaline soil. Soil Sci. Soc. Am. Proc. 33:715-718. Carter, D.L., C.W. Robbins, and M.J. Brown. 1972. Effect of phosphorus fertilization on the selenium concentration in alfalfa (Medicago saliva). Soil Sci. Soc. Am. Proc. 36:624-628. Cary, E.E., G.W. Wieczorek, and W.H. Allaway. 1967. Reactions of selenite-seleniurn added
to soils that produce low selenium forages. Soil Sci. Soc. Am. Proc. 31:21-26. Chau, Y.K., P.T.S. Wong, B.A. Silverberg, P.L. Luxon, and G.A. Bengert. 1976.
Methyla-lion of selenium in the aquatic environment. Science (Washington, DC) 192:1130-1131. Chiou, K.Y., and O.K. Manuel. 1986. Tellurium and selenium in aerosols. Environ. Sci.
Tech-nol. 20:987-991.
Combs, G.F,, Jr., S.A. Barrows, and F.N. Swader. 1980. Biologic availability of selenium in corn grain produced on soil amended with fly ash. J. Agric. Food Chem. 28:406-409. Combs, G,F., Jr., and S.B. Combs. 1986. The role of selenium in nutrition. Academic Press,
New York,
Cutter, G.A. 1978. Species determination of selenium in natural waters. Anal. Chim. Acta 98:59-66.
Cutter, G.A., and T.M. Church. 1986. Selenium in western Atlantic precipitation. Nature (Lon-don) 322:720-722.
Davies, E.B., and J.H. Watkinson. 1966. Uptake of native and applied selenium by pasture species. N.Z. J. Agric. Res. 9:317-327.
Donovan, J., J.L. Sonderegger, and M.R. Miller. 1981. Inliestigations of soluble salt loads, controlling mineralogy, and factors affecting the rates and amounts of leached salts. Montana Water Resour. Res. Center Rep. 120. Montana State Univ., Bowman, MT.
Doran, J.W., and M. Alexander. 1977. Microbial formation of volatile selenium compounds in soil. Soil Sci. Soc. Am. J. 41:70-73.
Ehlig, C.F., W.H. Allaway, E.E. Cary, and J. Kubota. 1968. Differences among plant species in selenium accumulation from soils low in available selenium. Agron. J. 60:43-47. Eisenberg, S.H., M.E. Tittlebaum, H.C. Eaton, and M.M. Soroczak. 1986. Chemical