Yasodha et al. World Journal of Pharmaceutical and Life Sciences
DEVELOPMENT AND VALIDATION OF RP-HPLC METHOD FOR THE
SIMULTANEOUS ESTIMATION DANAZOL IN API AND COMBINED DOSAGE
FORM
Prathibha K., Jagya and Dr. A. Yasodha*
Department of Pharmaceutics, Dhanvanthri College of Pharmaceutical Sciences, Mahabubnagar- 509002, Telanagana, India.
Article Received on 22/08/2018 Article Revised on 12/09/2018 Article Accepted on 02/10/2018
INTRODUCTION
Danazol is a derivative of the synthetic steroid ethisterone, amodified testosterone. It was approved by the U.S. Food and Drug Administration (FDA) as the first drug to specifically treat endometriosis, but its role as a treatment for endometriosishas been largely replaced by the gonadotropin-releasing hormone (GnRH) agonists.[1] Danazol has antigonadotropic and anti-estrogenic method for the estimation of Danazol as per ICH guidelines 19.Moreover this method also find advantage and Even though analytical methods have been developed, a simple, rapid and sensitive method when compared with existing method.[2,3]
Danazol acts as an anterior pituitary suppressant by inhibiting the pituitary output of gonadotropins. Chromatography in which separation is based mainly on difference between the adsorption affinities of the sample components for the surface of an active solid. The analyte interact with solid stationary surface and are displaced with eluent for active sites on surface.[4-7] It possess some androgenic properties. To develop new simple, sensitive, accurate and economical analytical method for estimation of danazol. The utility of the developed method to determine the content of drug in commercial formulation was also demonstrated.[8]
Validation of the method was done in accordance with USP and ICH guideline for the assay of active
ingredient. The method was validated for parameters like system suitability, linearity, precision, accuracy, specificity, ruggedness, robustness, limit of detection and limit of quantification. The method provides means to quantify the component.[9] The proposed method was suitable for the analysis of Pharmaceutical dosage forms estimation of Danazol in bulk and pharmaceutical formulations.[10,11] Hence we developed a simple, rapid, sensitive and economical RP (Reverse Phase)-HPLC (High Performance Liquid Chromatography) The results obtained were promising.
MATERIALS AND METHOD
Chemicals used
Standard were purchased from sura labs,water and methanol for HPLC from LICHROSOLV(MERCK), Acetonitrile for HPLC Merch.
World Journal of Pharmaceutical and Life Sciences
WJPLS
www.wjpls.org SJIF Impact Factor: 5.088
*Corresponding Author: Dr. A. Yasodha
Department of Pharmaceutics, Dhanvanthri College of Pharmaceutical Sciences, Mahabubnagar- 509002, Telanagana, India.
[1]
ABSTRACT
A rapid and precise reverse phase high performance liquid chromatographic method has been developed for the validated of Danazol, in its pure form as well as in tablet dosage form. Chromatography was carried out on ODS C18 (4.6 X250mm, 5µm) column using a mixture of Methonol (100% v/v) as the mobile phase at a flow rate of 1.0 ml/min, the detection was carried out at 274nm.The retention time of the Danazol was 2.252 + 0.02min.The methodproduce linear responses in the concentration range of 5-25µm/ml of Danazol. The method precision for the determination of assay was below 2.0%RSD.The method is useful in the quality control of bulk and pharmaceutical formulations.
Equipments
HPLC (Waters Alliance 2695 Separation Module, Software: Empower 2, 486 PDA Detector),
pH meter (Labindia),
Weighing machine (Sartorius).
Preparation of standard solution
Accurately weigh and transfer 10 mg of Danazol working standard into a 10ml of clean dry volumetric flasks add about 7ml of Methanol and sonicate to dissolve and removal of air completely and make volume up to the mark with the same Methanol.
Preparation of mobile phase
Accurately measured 1000 ml (100%) of HPLC Methanol in a 1000ml volumetricflask.
Chromatographic conditions
Waters ODS C18 column having dimentions 4.6 X 150mm, 5µm particle size. Mobile phase used was methanol (100% v/v), injection volume 10µl.UV detector wavelength used was 274nm and flow 1ml/min.
Method validation
The developed method was validation as per the ICH guidance. The method was validated for specificity, selectivity, linearity, sensitivity, accuracy, precision, robustness and ruggedness.
Specificity and selectivity
Specificity of the developed method was carried out by comparing the standard and the sample retention time with six injections and the lack of interference peak were studied. The selected chromatographic condition should be ideal and should be free from impurities, matrix, degradants, excipients, preservatives and related impurities on selected standard retention time and peak.
Linearity and Sensitivity
Linearity was carried by plotting a calibration graph of analyte peak area (y axis) versus concentration (x axis) ranging from 10.0-100.0 µg/ ml. Linear regression analysis was followed and the correlation of coefficient (r2) was used as measure of linearity. Limit of detection (LOD) and limit of quantitation (LOQ) were reported as 3 and 10 times the noise level obtained from three replicate injections of blank samples respectively.
Accuracy
Accuracy was evaluated to determine recovery of the standard solution form the sample solutions. Mean percentage (%) recovery of analytes was used as a measure of accuracy. Each sample concentration was spiked with the standard concentration and injected in triplicate and the percentage recovery was determined. Accuracy was evaluated to determine recovery of the standard solution form the sample solutions. Mean percentage (%) recovery of analytes was used as a
Precision and repeatability
Intermediate precision (intra- and interday) and repeatability were carried out on the analytes sample. Percentage relative standard deviation (% RSD) was considered as a measure of precision and repeatability. The analytes sample were prepared at three different concentration of low, middle and high concentration of linearity sample and injected six time on the same day and on three consecutive day for intra- and interday precision respectively.
Robustness and Ruggedness
The developed method was evaluated for robustness and ruggedness by slight changing the parameters such as instruments and operators, slight change in the optimized chromatographic conditions such as column temperature, flow rate and pH.
RESULTS AND DISCUSSION
Optimization of the chromatographic condition was carried out based on the sharp peak, ideal separation, stability and repeatability of the standards as the results are shown in the Table 1&2.Numbers of trails were carried out to achieve the above criteria by changing the mobile phase parameters such as buffer concentration, buffer strength, organic concentration, pH ratio and standard phase such as different column as C8 and C18. Based on the trial and error method the developed method was optimized at the mobile phase concentration of 25mM of methanol and acetonitrile at the ratio of 50: 50 v/v with the pH of 4 respectively.
Among the different solvent acetonitrile showed maximum solubility. Stationary phase used was C18 column (250 x 4.6 mm, i.d. 5μm). Detection of the optimized chromatograph was carried out at 274 nm as shown in the Table 3. The developed method for danazol showed good separation at the retention time of 8 min respectively. Broadening of the peak was observed when decrease in the concentration of organic phase while shifting of peak was observed towards the void volume side due to the high solubility.
Similarly in aqueous phase when the concentration increase no peak was observed due to the low solubility where else decrease in the concentration of aqueous phase broadening of peak was observed. Change in the pH shows that peak splitting. Increase or decrease of the detection wavelength shows decrease in the response.
Linearity was carried by plotting a calibration graph of analyte peak area (y axis) versus concentration (x axis) ranging from 10.0-100.0 µg/mL was found to be linear in range as shown in the fig 1. Linear regression analysis was followed and the correlation of coefficient (r2) was used as measure of linearity. Regression equation for the linearity and the range was found to be 0.994 respectively. Accuracy was carried out by recovery studies by spiking the known standard concentration to the sample solution as shown in the fig 2 and found to be consistent at all the levels as shown in the Table 5.
Precision study was carried out at two different levels of intra- and interday levels. Six injection of three different
concentration of low, middle and high concentration of linearity such as 20, 60 and 100 µg/mL were injected and the percentage RSD and standard deviation were calculated and results are well within the limits as shown in the Table 6.
The developed method showed no change in the chromatographic condition when evaluated for the robustness and ruggedness and found to be rugged and robust. Limit of detection and limit of quantification for danazol were studied base on the signal to noise ratio and found to be 50 ng/mL and200ng/ml.
Table 1: Results of system suitability for Danazol.
Sl. No. Peak name RT Area (μV*sec) Height (μV) USP Plate Count USP Tailing
1 Danazol 2.277 1419842 198640 6291 0.85
2 Danazol 2.277 1429006 170366 6346 0.85
3 Danazol 2.267 1418422 169256 6985 0.86
4 Danazol 2.265 1408754 1532657 6584 0.85
5 Danazol 2.277 1425462 180021 6325 0.86
Mean 1420297
Std. Dev. 7737.69
% RSD 0.54
Table 2: Peak results for assay standard.
Sl. No. Name RT Area Heaight USP Tailing USP Plate Count Injection
1 Danazol .265 1417834 167270 0.85 6291 1
2 Danazol 2.267 1421060 168871 0.85 6549 2
3 Danazol 2.267 1419161 168999 0.85 6982 3
Table 3: Chromatographic data for linearity.
Concentration Level (%) Concentration µg/ml Average Peak Area
33 5 478475
66 10 1001129
100 15 1416507
133 20 1841573
166 25 2283778
Table 4: Results for repeatability for Danazol.
Sl. No. Peak name RT Area (μV*sec) Height (μV) USP Plate Count USP Tailing
1 Danazol 2.293 1413527 173368 6413 0.85
2 Danazol 2.276 1401699 175290 6214 0.85
3 Danazol 2.286 1411309 175314 6528 0.85
4 Danazol 2.277 1425886 176294 6624 0.85
5 Danazol 2.280 1412465 178661 6982 0.85
Mean 1412977
Std. Dev. 8619.49
Table 5: Results of intermediate precision analyst for Danazol.
Sl. No. Peak name RT Area (μV*sec) Height (μV) USP Plate Count USP Tailing
1 Danazol 2.277 1405886 176294 6463 0.85
2 Danazol 2.255 1406800 178900 6251 0.85
3 Danazol 2.265 1413406 182073 6985 0.85
4 Danazol 2.255 1418482 181769 6235 0.85
5 Danazol 2.253 1412766 181366 6598 0.85
6 Danazol 2.252 1409515 359346 6458 0.85
Mean 1411143
Std. Dev. 4706.682
%RSD 0.33
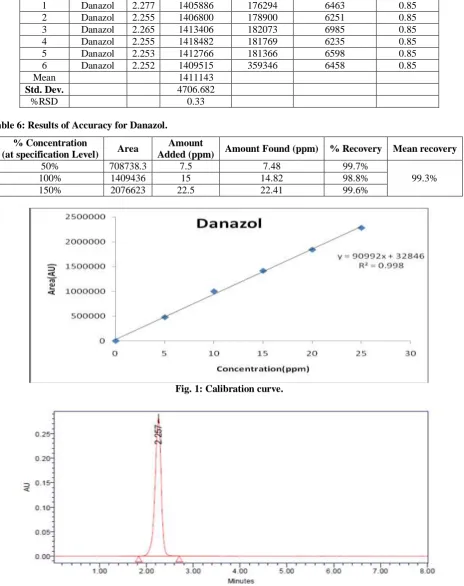
Table 6: Results of Accuracy for Danazol.
% Concentration
(at specification Level) Area
Amount
Added (ppm) Amount Found (ppm) % Recovery Mean recovery
50% 708738.3 7.5 7.48 99.7%
99.3%
100% 1409436 15 14.82 98.8%
150% 2076623 22.5 22.41 99.6%
Fig. 1: Calibration curve.
Fig. 2: Chromatogram showing accuracy-50% injection.
CONCLUSION
A simple, rapid, cost effective and sensitive method was
ACKNOWLEDGEMENTS
The authors would like to acknowledge their dear collegues for their support rendered. The authors extend their heartfelt regards to the management Dhanvanthri college of pharmaceutical sciences, Mahaboobnagar for their constant support through out the research works.
BIBLIOGRAPHY
1. YE, Yi-qing; LIN, Jun; ZHANG, Xin-mei; YANG, Feng-liang; YU, He-yong. HPLC determination of danazol in rat plasma and uterus tissue. Chinese Journal of Pharmaceutical Analysis, 2008; 28(2): 216-218.
2. Shah A d, Patel C N, Implementation of QbD approach to the RP-HPLC Method development and validation of Roflumilast in bulk and tablet dosage form: an application in degradation study, World Journal of Pharmacy and Pharmaceutical Sciences, 2014; 3(6): 2281- 2307.
3. Rahman a., hoffman N.E., Determination Of Danazol In Plasma By High Performance Liquid Chromatography. Analytical Letters, 1989; 22(2): 377-386.
4. Draft ICH Guidelines on Validation of Analytical Procedures Definitions and terminology. Federal Register, vol 60. IFPMA, Switzerland, 1995; 1126. 5. Selinger K, Hill HM, Anslow JA, Gash D. A Liquid
Chromatographic Method for the Determination of
Danazol In Human Serum. Journal of
Pharmaceutical and Biomedical Analysis, 1990; 8(1): 79-84.
6. Snyder LR practical HPLC method development, 2nd edition. John Wiley and sons, New York, 1997; 180-182.
7. Breaux J and Jones K: Understanding and implementing efficient analytical method development and validation. Journal of Pharmaceutical Technology, 2003; 5: 110-114. 8. ICH Q2A, “validation of analytical methods,
definitions and terminology”, ICH Harmonized tripartite guideline, 1999.
9. Code Q2B, Validation of Analytical Procedures; Methodology. ICH Harmonized Tripartite Guidelines, Geneva, Switzerland, 1996; 1- 8. 10. Kirthi A, Shanmugam R, Mohana Lakshmi S, Ashok