359
Volume-4, Issue-4, August-2014,
ISSN No.: 2250-0758
International Journal of Engineering and Management Research
Available at:
Page Number: 359-366
Experimental Investigation of Tribological Behaviour on
AA6061/SiC/Al
2O
3/Gr Metal Matrix Composite with Application of
Taguchi Technique
Davender Singh1, Rachit Marwaha2, Satpal Kundu3 1
M.Tech Student Shree Krishan Institute of Engineering and Technology KKR, Haryana, INDIA 2,3
Assistant Professor in Mechanical Department at SKIET, Kurukshetra, Haryana, INDIA
ABSTRACT
Tribological behaviour of aluminium alloy AA6061T6 reinforced with silicon carbide and alumina oxide particles (15%weight percentage of SiC, Al2O3 and Gr particles)
fabricated by stir casting process was investigated. The wear and frictional properties of the metal matrix composites was studied by performing dry sliding wear test using a computerized pin-on-disc wear tester. Experiments were conducted based on the plan of experiments generated through Taguchi’s technique. A L9 Orthogonal array was
selected for analysis of the data. Investigation is to find the influence of applied load, sliding speed and sliding distance on wear rate, as well as the coefficient of friction during wearing process was carried out using ANOVA and regression equations for each response were developed for 15% SiC, Al2O3 and Gr particles reinforced AA-6061 T6
MMC’s. Objective of the model was chosen as “smaller the better” characteristics to analyse the dry sliding wear behaviour. Results show that sliding speed has the highest influence followed by applied load and sliding distance was found most affecting term the wear rate and coefficient of friction respectively.
Keywords---- Metal Matrix Composites, Stir casting,
Taguchi’s techniques, orthogonal array, Analysis of variance, wear behaviour, Pin-on-disc machine.
I.
INTRODUCTION
General Engineering materials have some limitations in achieving optimum levels of strength, stiffness, density, toughness and wear resistance. To overcome these short comings, discontinuously reinforced MMC aluminium metal matrix composites are gaining importance due to their high specific strength, high stiffness, low density and good wear resistance and they have the potential to replace their monolithic counter parts primarily in automotive, aerospace and energy applications [1].
Fabrication of MMCs has several challenges like porosity formation, poor wettability and improper distribution of reinforcement. Achieving uniform distribution of reinforcement is the foremost important work. A new technique of fabricating cast Aluminium matrix composite has been proposed to improve the wettability between alloy and reinforcement. In this, all the materials are placed in graphite crucible and heated in an inert atmosphere until the matrix alloy is melted and followed by two step stirring action to obtain uniform distribution of reinforcement.
The fabrication techniques of MMCs play a major role in the improvement of mechanical and tribological properties. The performance characteristics of Al alloy reinforced with 5% volume fraction of SiC fabricated through stir casting and found that the stir casting specimen have higher strength compared to powder metallurgy specimen. The size and type of reinforcement also has a significant role in determining the mechanical and tribological properties of the composites. The effect of type of reinforcements such as SiC whisker, alumina fiber and SiC particle fabricated by Powder Metallurgy on the properties of MMCs has been investigated. It was found that there existed a strong dependence on the kind of reinforcement and its volume fraction. The results revealed that particulate reinforcement is most beneficial for improving the wear resistance of MMCs. [2]
360
performance of DRAMMCs like load, sliding velocity, sliding distance, reinforcement size and reinforcement volume fraction. There has been an increasing interest in composites containing low density and low cost reinforcements. [3]
II.
METHODOLOGY
Taguchi Design And Analysis
The Taguchi approach to experimentation provides an orderly way to collect, analyze and interpret data to satisfy the objectives of the study. Essentially, traditional experimental design procedures are too complicated and not easy to use. A large number of experimental works have to be carried out when the number of process parameters increases. To solve this problem, the Taguchi method uses a special design of orthogonal arrays to study the entire parameter space with only a small number of experiments. The greatest advantage of this method is the saving of effort in conducting experiments; saving experimental time, reducing the cost, and discovering significant factors quickly. Taguchi’s robust design method is a powerful tool for the design of a high-quality system. In addition to the S/N ratio, a statistical analysis of variance (ANOVA) can be employed to indicate the impact of process parameters on metal removal rate values [4]. A plan order for performing the experiments was generated by Taguchi method using orthogonal arrays. This method yields the rank of various parameters with the level of significance of influence of a factor or the interaction of factors on a particular output response [5]. The major aim of the present investigation is to analyse the influence of parameters like load, sliding speed and fly ash content on dry sliding wear of aluminium/SiC/Al2O3
Material Selection
hybrid metal matrix composites using Taguchi technique. A multiple linear regression model is developed to predict the wear rate of the hybrid composites.
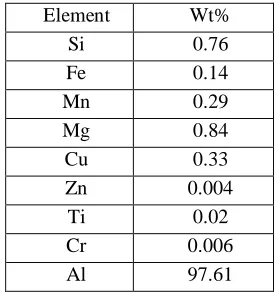
In the present investigation, AA6061 T6 alloy was chosen as the base matrix since its properties can be tailored through heat treatment process. The SiC and Alumina (Al2O3) oxides are used as reinforcement in composite along with AA6061. The particle size of both kinds of reinforcement is of 400 µm size. Graphite is also used as reinforcement having particle size 200 µm. and there are sufficient literatures elucidating the improvement in wear properties through the addition of SiC, Al2O3 and Graphite. Addition of Silicon carbide, Alumina oxide and Graphite into aluminium base matrix, results into improved wear resistance, high strength, low density, low coefficient of thermal expansion and high thermal conductivity of metal matrix composite.
Element Wt%
Si 0.76
Fe 0.14
Mn 0.29
Mg 0.84
Cu 0.33
Zn 0.004
Ti 0.02
Cr 0.006 Al 97.61
Table 1- Chemical Composition of AA6061T6 alloy
Composite Preparation
In order to achieve high level of mechanical properties in the composite, a good interfacial bonding between the dispersed phase and the liquid matrix has to be obtained. Stir casting technique is most simplest and cost effective method to fabricate metal matrix composites which has been adopted by many researchers. This method is most economical to fabricate composites with discontinuous fibres and particulates and was used in this work to obtain the as cast specimens. Care was taken to maintain an optimum casting parameter of pouring temperature (650°C) and stirring time fifteen mints. The reinforcements were preheated prior to their addition in the aluminium alloy melt. Degassing agent (hexachloro ethane) was used to reduce gas porosities. The molten metal was then poured into a permanent cast iron mould of diameter 50mm and length 320mm. The die was released after 6 hours and the cast specimens were taken out.
361
Fig.2Pin on Disc wear testing machine
Fig.3 Molding
Wear Behaviour
The aim of the experimental plan is to find the important factors and combination of factors influencing the wear process to achieve the minimum wear rate and coefficient of friction. The experiments were developed based on an orthogonal array, with the aim of relating the influence of sliding speed, applied load and sliding distance. These design parameters are distinct and intrinsic feature of the process that influence and determine the composite performance. Taguchi recommends analysing the S/N ratio using conceptual approach that involves graphing the effects and visually identifying the significant factors. The above mentioned pin on disc test apparatus was used to determine the sliding wear characteristics of the composite. Specimens of size 12 mm diameter and 30 mm length were cut from the cast samples, and then machined. The contact surface of the cast sample (pin) was made flat so that it should be in contact with the rotating disk. During the test, the pin was held pressed against a rotating EN31 carbon steel disc (hardness of 65HRC) by applying load that acts as counterweight and balances the pin. The track diameter was taken 100mm for each batch of experiments and the parameters such as the load, sliding speed and sliding distance were varied in the range given in Table 2. A LVDT (load cell) on the lever arm helps determine the wear at any point of time by monitoring the movement of the arm. Once the surface in contact wears
out, the load pushes the arm to remain in contact with the disc. This movement of the arm generates a signal which is used to determine the maximum wear and the coefficient of friction is monitored continuously as wear occurs and graphs between co-efficient of friction and time was monitored for both of the specimens, Al6061T6/SiC/Al2O3MMC’s. Further, weight loss of each specimen was obtained by weighing the specimen before and after the experiment by a single pan electronic weighing machine with an accuracy of 0.0001g after thorough cleaning with acetone solution. The difference between the initial and final mass of the pin gave the mass loss due to sliding wear. The volume loss due to wear was calculated by the use of corresponding density values of the pin. The wear rate of the composite pins was then calculated (ratio of volume loss to sliding distance).The results for various combinations of parameters were obtained by conducting the experiment as per the Orthogonal array and show the Table 3. The measured results were analysed using the commercial software MINITAB 16 specifically used for design of experiment applications..
Fig.4Pin on Disc wear measuring apparatus
Plan of Experiments
362
assigned with parameters. The response to be studied was the wear with the objective as smaller the better. The experiments were conducted as per the orthogonal array with level of parameters given in each array row. The wear test results were subject to the analysis of variance.
Controllable Factors
Load(L) (N)
Sliding Speed(S) (m/s)
Sliding distance(D) (m)
Level 1 20 1.5 600
Level 2 30 2 1200
Level 3 40 2.5 1800
Table 2: Parameters and their levels
In this investigation, an L9 OA which has 9 rows corresponding to the number of tests and 26 degrees of freedom (DOFs) with 13 columns at three levels is chosen. To check the DOFs in the experimental design, for the three level test, the three main factors take 8 [3×(3-1)] DOFs. The DOF for three second-order interactions (L × S, L × T, S × T) is 12 [3×(3-1)×(3-1)] and the total DOFs required is 18. As per the Taguchi method, the total DOFs of selected OA must be greater than or equal to the total DOFs required for the experiment and hence the L9 OA has been selected. As per the requirements of the L9
S/N = -10 log [1/n (Σy
OA, the 1st column is assigned to applied load (L), the 2nd column is assigned to sliding speed (S), the 5th column is assigned to sliding distance (D) and six columns are assigned to the two-way interactions of the first three factors while the remaining three columns are for error terms. In this study, “smaller the better‟ characteristic was chosen to analyse the dry sliding wear resistance. The S/N ratio for wear rate and coefficient of friction using “smaller the better”characteristic given by Taguchi, is as following formula:
2
Where y1, y2...yi are the response of friction and sliding wear n is the number of observations.
)]
Fig. 5 Pin-on- Disc in Testing Condition
Fig. 6 Specimen
III.
RESULT ANALYSIS
Sr No Load Speed Distance Wear Rate S/N-WR COF S/N-COF
1 20 1.5 600 0.105616 18.5196 0.554650 5.492122
2 20 2 1200 0.018405 35.2167 0.498277 6.309562
3 20 2.5 1800 0.076412 23.4651 0.564652 5.122305
4 30 1.5 1200 0.125641 18.6765 0.654275 3.676142
5 30 2 1800 0.093142 20.6576 0.315468 10.05216
363
7 40 1.5 1800 0.145327 16.5626 0.495621 6.115261
8 40 2 600 0.012331 38.1561 0.458164 7.014267
9 40 2.5 1200 0.078941 23.1654 0.458671 6.864593
Table3-Result of L
9orthogonal array
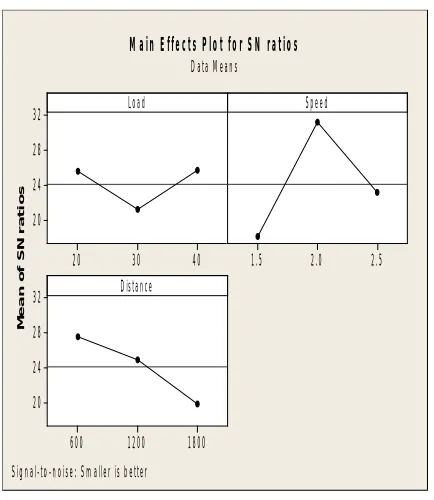
Level load(N) speed(m/s) distance(m)
1 25.52 18.10 27.54
2 21.19 31.17 24.92
3 25.66 23.11 19.90
Delta 4.48 13.07 7.64
Rank 3 1 2
Table 4 Response Table for Signal to Noise ratios- Smaller is better (Wear rate)
40 30 20 32
28
24
20
2.5 2.0 1.5
1800 1200 600 32
28
24
20
Load
M
e
a
n
o
f
S
N
r
a
t
io
s
Speed
Distance
Main Effects Plot for SN ratios
Data Means
Signal-to-noise: Smaller is better
Fig.7 Main Effects Plot for SN ratios (Wear rate)
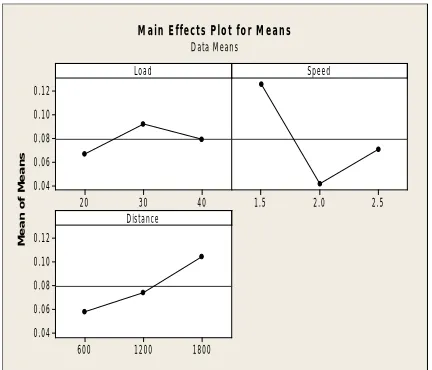
Level load(N) speed(m/s) distance(m)
1
0.06681
0.12553
0.05822
2
0.09184
0.04129
0.07433
3
0.07887
0.07069
0.10496
Delta 0.02502
0.08424
0.04674
Rank
3
1
2
364 40 30 20 0.12 0.10 0.08 0.06 0.04 2.5 2.0 1.5 1800 1200 600 0.12 0.10 0.08 0.06 0.04 Load M e a n o f M e a n s Speed Distance
Main Effects Plot for Means
Data Means
Fig. 8 Main Effects Plot for Means-Wear rate
Level load(N) speed(m/s) distance(m)
1 5.378 4.967 4.622
2 5.225 7.617 5.502
3 6.549 4.568 7.027
Delta 1.324 3.049 2.405
Rank 3 1 2
Table 6 Response Table for Signal to Noise Ratios- Smaller is better (Coefficient of friction)
40 30 20 8 7 6 5 2.5 2.0 1.5 1800 1200 600 8 7 6 5 Load M ea n of S N r at io s Speed Distance
Main Effects Plot for SN ratios
Data Means
Signal-to-noise: Smaller is better
Fig. 9 Main Effects Plot for SN ratios-coefficient of friction
Level load(N) speed(m/s) distance(m)
1 0.5392 0.5682 0.6034
2 0.5890 0.4240 0.5371
3 0.4708 0.6069 0.4586
Delta 0.1182 0.1829 0.1448
Rank 3 1 2
Table 7 Response Table for Means- Smaller is better (Coefficient of friction
Fig. 10 Main Effects Plot for Means (coefficient of friction) 35 30 25 0.56 0.52 0.48 0.44 0.40 2.5 2.0 1.5 2100 1400 700 0.56 0.52 0.48 0.44 0.40 load(N) M e a n o f M e a n s speed(m/s) disatnce(m)
365
IV.
ANALYSIS OF VARIANCE OF WEAR RATE AND COEFFICIENT OF
FRICTION
Wear Rate
Table 8 Analysis of Variance - Wear
From this ANOVA table, we give the results that following parameters such as applied load [8.8%],sliding speed [58.9%] and sliding distance [20.4%] which are influencing wear rate. Wear rate is influenced by applied load, sliding speed and sliding distance respectively. We know that wear rate which is volumetric loss of composite material is highly influenced by sliding speed.
Coefficient of Friction
Source D F Seq SS Adj SS Adj MS F P %
Load 2 3.148 3.148 1.574 0.27 0.787 7.85
Speed 2 16.481 16.481 8.240 1.42 0.413 41.08
Distance 2 8.885 8.885 4.442 0.77 0.566 22.14
Residual Error 2 11.610 11.610 5.805 28.93
Total 8 40.124
Table 9 Analysis of Variance - coefficient of friction
From this ANOVA table, we give the results that following parameters such as applied load [7.85%], sliding speed [41.08%] and sliding distance [22.14%] which are influencing coefficient of friction . Coefficient of friction
is influenced by applied load, sliding speed and sliding distance respectively. We know that coefficient of friction of composite material is highly influenced by sliding speed.
Source D F Seq SS Adj SS Adj MS F P %
Load 2 38.84 38.84 19.42 0.74 0.575 8.8
Speed 2 260.80 260.80 130.40 4.97 0.168 58.9
Distance 2 90.47 90.47 45.23 1.72 0.367 20.4
Residual Error 2 52.52 52.52 26.26 11.9
366
The regression equation For Wear Rate:
wear rate(mm3
From the regression equations for wear rate, we can conclude that wear rate of composite is direct proportional to applied load, sliding distance and inversely proportional to speed.
/m) = 0.124 + 0.00060 Load(N) - 0.0548 Speed(m/s) + 0.000039 Distance(m)
For Coefficient Of Friction:
COF = 0.703 - 0.00342 Load(N) + 0.039 Speed(m/s) - 0.000121 Distance(m)
From the regression equations for coefficient of friction, we can conclude that coefficient of friction is directly proportional to sliding speed and inversely proportional to applied load, sliding distance
V.
CONCLUSION
The following conclusion reviews that:
1) Successful Casting of different composition of SiC/Al2O3
2) From Analysis of variance, we find the different parameters which are most influencing on wear rate and coefficient of friction of SiC/Al
/Graphite and Al6061 T6 MMC by Stir casting technique.
2O3
3) Wear rate was highly influenced by applied load, sliding speed and sliding distance respectively
/Graphite and Al6061 T6 MMC.
4) Coefficient of friction was highly influenced by sliding speed, sliding distance and applied load respectively 5) From the regression equations for wear rate and coefficient of friction we found that wear rate of composite is directly proportional to sliding speed and applied load and Coefficient of friction is directly proportional to sliding speed and inversely proportional to load and sliding distance.
REFERENCES
[1] N. Radhika, R. Subramanian, S. Venkat Prasat
“Tribological Behaviour Of Aluminium/Alumina/Graphite Hybrid Metal Matrix
Composite Using Taguchi’s Techniques”Journal Of Minerals & Materials Characterization & Engineering, Vol. 10, No.5, Pp.427-443, 2011
[2] Dinesh. A, S. Basavarajappa And G. Chandramohan “Dry Sliding Wear Studies On Hybrid Mmc’s – A Taguchi Technique” International Symposium Of Research Students On Materials Science And Engineering December 20-22, 2004, Chennai, India
[3] S. Suresha, B.K. Sridhara (2012) Friction Characteristics Of Aluminium Silicon Carbide Graphite Hybrid Composites Materials And Design 34 (2012) 576– 583.
[4] Harish K.Garg, Ketan Verma, Alakesh Manna, Rajesh Kumar” Hybrid Metal Matrix Composites And Further Improvement In Their Machinability- A Review” International Journal Of Latest Research In Science And
Technology Issn(Online):2278-5299vol.1,Issue1:36-44,May-June(2012)
[5] Anandha Moorthy, Dr. N. Natarajan, R. Sivakumar,M. Manojkumar, M. Suresh” Dry Sliding Wear And Mechanical Behavior Of Aluminium/Fly Ash/Graphite Hybrid Metal Matrix Composite Using Taguchi Method” International Journal Of Modern Engineering Research (Ijmer) Www.Ijmer.Com Vol.2, Issue.3, May-June 2012 Pp-1224-1230 Issn: 2249-6645
[6] S. Basavarajappa, G. Chandramohan (2006) Application Of Taguchi Techniques To Study Dry Sliding Wear Behaviour Of Metal Matrix Composites, Materials And Design 28 (2007) 1393–1398.
[7] Ashok Kr. Mishra, Rakesh Sheokand, Dr. R K Srivastava”Tribological Behaviour Of Al-6061 / Sic Metal Matrix Composite By Taguchi’s Techniques” International Journal Of Scientific And Research Publications, Volume 2, Issue 10, October 2012 1 Issn 2250-3153