61
Copyright © 2018. IJEMR. All Rights Reserved.
Volume-8, Issue-2, April 2018
International Journal of Engineering and Management Research
Page Number: 61-65
Performance Optimzation in Turning of Alluminium 8019 Alloy
Soubhagya Ranjan Sahoo1 and S.K. Sethi2
1
Scholar, Department of Mechanical Engineering, Centurion Institute of Technology, Odisha, INDIA
2
Assistant Professor, Department of Mechanical Engineering, Centurion Institute of Technology, Odisha, INDIA
1Corresponding Author: [email protected]
ABSTRACT
This paper presents reduction of surface roughness in dry turning of Aluminum 8019 alloy using TiN-TiCN-Al2O3-ZrCN multilayer coated cemented carbide & uncoated
cryo-treated inserts. Effect of cutting velocity, feed rate, depth of cut and machining duration is studied on the surface roughness. Taguchi’s design of experiment is used to find the optimum factor levels. From this experiment we came into a conclusion that the feed rate has much effect in producing lower surface roughness followed by speed. The depth of cut has lesser role on surface roughness. The result of Taguchi method shows that cutting speed of 2000 rpm, feed rate of 0.2 mm/rev and depth of cut of 0.75mm should be maintained as optimal parameter settings for both coated and uncoated tools.
Keywords— Cryogenic, Dry Turing, Surface roughness, Taguchi Method
I.
INTRODUCTION
Now-a-days, determination of optimum values of process parameters in manufacturing are the areas of great interest for researchers and manufacturing engineers. For modern machining, it is necessary to focus on the achievement of high quality in terms of product dimensional accuracy, surface quality, high production rate, less tool wear and economy of machining. Surface roughness is among the inevitable customer requirements as it is caused by the influence of the cutting tool during the machining process. Roughness is the dominant magnitude related to the machinability of the processed material, the tool form, the machining conditions, and the tolerance requirements. Therefore, attempt should be made to minimize surface roughness because higher unevenness leads to functional discrepancies.
CNC Turning is that the one among the foremost wide used machine for manufacturing rounded form work
piece in shorter time at affordable prize with smart surface and metallic element is widely accustomed manufacture the elements of the vehicles by turning method due its light-weight weight. It is extremely desired that product having smart surface quality area unit factory-made in short time. The surface quality of product is usually determined in terms of the measured surface roughness. Surface roughness usually depend upon the cutting parameters such as: cutting speed, feed rate and depth of cut. Proper choice of the management factors for the experiment is very important so as to supply the parts with smart surface end and high tolerance in brief time. within the previous few decades, lots of labor has been dole out to boost the standard of the merchandise and potency in machining. Still varied aspects associated with this paper area unit however to be explored. Ravindra Thamma [1] has found completely different models to obtain optimal machining parameters for needed surface roughness for an aluminium 8019 work items. He complete that Spindle speed, feed rate, and nose radius have significant control factors for surface roughness. sander surfaces will be created once machined with a bigger spindle speed, smaller feed rate, and nose radius Depth of cut has a
significant influence on surface roughness. H.
62
Copyright © 2018. IJEMR. All Rights Reserved.
1.1 Surface roughnessR value, the arithmetic average roughness (center line average), determined from deviations about the center line within the evaluation length is the most popular parameter for a machining process and product quality control. This parameter is easy to define, easy to measure
even in the least suitable profile-meters and gives a general description of surface amplitude. Though it lacks physical significance, it is established in almost every national standard for measuring roughness. The average surface roughness is given by
Here, Ra is the arithmetic average deviation from the mean line; l is the sampling length, y coordinate of the profile curve.
Figure 1 Evaluation of surface roughness
1.2 Taguchi DOE
Taguchi’s design of experiment methodology is a convenient tool to optimize the cutting parameters with less experimental runs [2]. Taguchi primarily recommends experimental design as a tool to make products more robust – to make them less sensitive to noise factors. The experimental design procedure is suitable tool for reducing the effect of variation on product and process quality characteristics [3]. Analysis of Variance (ANOVA) can be employed to identify the most significant
Variables and interaction effects [4] In turning, many researchers have modeled surface roughness. Davim [5] has presented a study of the influence of cutting parameters on the surface roughness obtained in turning of free machining steel using Taguchi design and shown that the cutting velocity has a greater influence on the roughness followed by the feed rate. Lin et al. [6] have shown that feed rate is the critical parameter in turning to affect the surface roughness as increase of feed rate increases the surface roughness. Suresh et al. [7] have shown that surface roughness decreases with an increase in cutting speed in turning of mild steel. Arbizu and Perez [8] have developed models to determine surface quality of parts obtained through turning processes and shown that surface roughness increases with increase in depth of cut and feed rate. Sahin and Motorcu[9] have developed a surface roughness model for turning of mild steel with coated carbide tools and shown that feed rate is the main influencing factor on surface roughness. Surface roughness increases with increase in feed rate but decreases with increase in cutting speed and depth of cut. The literature survey shows that mainly three cutting parameters viz. cuttings peed, feed rate and depth of cut are the common parameters considered for most of the studies. The present research has two purposes. The first is to demonstrate the use of Taguchi’s parameter design in order to identify the
optimum parametric combination to minimize surface roughness. The second is to propose a predictive methodology for estimating surface roughness using data obtained during experimentation conducted as per Taguchi design.
II.
EXPERIMENTAL DETAILS
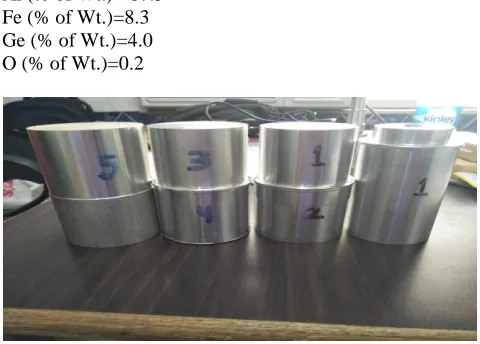
2.1 Work piece material
Al (% of Wt.)= 87.5 Fe (% of Wt.)=8.3 Ge (% of Wt.)=4.0 O (% of Wt.)=0.2
Job material (step turned Al)
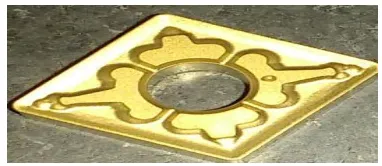
2.2 Cutting tool material
63
Copyright © 2018. IJEMR. All Rights Reserved.
Cutting tool (carbide tipped tool CNMG120408TM-T9125)
2.3 Machine tool
The turning operations were carried out in a rigid CNC turning machine AMS India, Bangalore. The tool holder used for machining is MCLNR 2525 M12.
Machining Set Up(Super Jobber CNC Turning)
2.4 Surface roughness Measurement
Surface roughness was measured using a portable stylus-type profilometer, Talysurf (Taylor Hobson, Surtronic 3+, UK)
Shows the Talysruf surface roughness testing device for measurement of surface roughness(Ra)
2.5 Cryo-treatment
In the present investigation, PVD coated carbide inserts were subjected to deep cryogenic treatment (-190°C). Cryotreatment (CT) is a secondary process to conventional heat treatment that involves deep freezing of materials at cryogenic temperatures to enhance the mechanical and physical properties.
2.6 Experimentation
Three cutting parameters with their levels are
shown in Table1. A L27 orthogonal array was chosen for
conducting experiments [11, 12]. The complete
experimental plan along with response (surface roughness) for Coated and Cryotreated uncoated tools is shown in Table 2. The responses are converted into signal-to-noise ratio (S/N ratio) for lower-the-better quality characteristic. Analysis of responses is carried out by MINITAB 14 software. S/N ratio for ‘lower the better’ type response is given by
S/N ratio= -10log [(1/n (y12+y22+……..+yn2)] (2)
Where y1, yn are the responses of values of quality
characteristic for the trial condition repeated ‘n’ times. Experimental conditions are shown in Table.1.
Table -1: Name of the Table
Exp No.
SPEE D (V)
rpm FEE
D (F) mm/ rev
DEPTH OF CUT (D) mm
SURFA CE ROUG HNESS
OF COATE
D (Ra) µm
SURFA CE ROUGH
NESS OF CRYOT
REATE D
1 1000 0.2 0.5 0.823 0.81
2 1000 0.2 0.75 0.957 0.932
3 1000 0.2 1.5 0.965 0.925
4 1500 0.2 0.5 0.952 0.932
5 1500 0.2 0.75 0.795 0.783
6 1500 0.2 1.5 0.882 0.835
7 2000 0.2 0.5 0.809 0.802
8 2000 0.2 0.75 0.668 0.656
9 2000 0.2 1.5 1.06 0.969
10 1000 0.5 0.5 3.03 2.792
11 1000 0.5 0.75 3.12 2.885
12 1000 0.5 1.5 2.18 1.98
13 1500 0.5 0.5 1.87 1.53
14 1500 0.5 0.75 2.78 2.328
15 1500 0.5 1.5 2.62 2.255
16 2000 0.5 0.5 3.10 2.82
17 2000 0.5 0.75 2.74 2.454
18 2000 0.5 1.5 1.88 1.456
19 1000 0.35 0.5 2.10 1.865
20 1000 0.35 0.75 2.15 1.869
21 1000 0.35 1.5 2.44 2.14
22 1500 0.35 0.5 2.85 2.35
64
Copyright © 2018. IJEMR. All Rights Reserved.
24 1500 0.35 1.5 2.71 2.54
25 2000 0.35 0.5 3.25 2.965
26 2000 0.35 075 2.54 2.168
27 2000 0.35 1.5 1.99 1.64
Chart -1: M e a n o f M e a n s 2000 1500 1000 2.5 2.0 1.5 1.0 0.50 0.35 0.20 75.00 1.50 0.75 0.50 2.5 2.0 1.5 1.0
SPEED (V) rpm FEED (F) mm/rev
DEPTH OF CUT (D) mm
Main Effects Plot (data means) for Means
SPEED (V) rpm
0.50 0.35 0.20 3.0 2.5 2.0 1.5 1.0 2000 1500 1000 3.0 2.5 2.0 1.5 1.0
FEED (F) mm/rev
SPEED 2000 (V) rpm 1000 1500 FEED 0.50 (F) mm/rev 0.20 0.35 Interaction Plot (data means) for Means
Standardized Residual P e r c e n t 2 1 0 -1 -2 99 90 50 10 1 Fitted Value S ta n d a r d iz e d R e s id u a l 3.0 2.5 2.0 1.5 1.0 2 1 0 -1 -2 Standardized Residual F r e q u e n c y 2 1 0 -1 -2 4.8 3.6 2.4 1.2 0.0 Observation Order S ta n d a r d iz e d R e s id u a l 26 24 22 20 18 16 14 12 10 8 6 4 2 2 1 0 -1 -2
Normal Probability Plot of the Residuals Residuals Versus the Fitted Values
Histogram of the Residuals Residuals Versus the Order of the Data Residual Plots for Means
Chart -2: M e a n o f M e a n s 2000 1500 1000 2.4 2.0 1.6 1.2 0.8 0.50 0.35 0.20 75.00 1.50 0.75 0.50 2.4 2.0 1.6 1.2 0.8
SPEED (V) rpm FEED (F) mm/rev
DEPTH OF CUT (D) mm
Main Effects Plot (data means) for Means
SPEED (V) rpm
0.50 0.35 0.20 2.5 2.0 1.5 1.0 2000 1500 1000 2.5 2.0 1.5 1.0
FEED (F) mm/rev
SPEED 2000 (V) rpm 1000 1500 FEED 0.50 (F) mm/rev 0.20 0.35 Interaction Plot (data means) for Means
Standardized Residual P e r c e n t 2 1 0 -1 -2 99 90 50 10 1 Fitted Value S ta n d a r d iz e d R e s id u a l 2.5 2.0 1.5 1.0 0.5 2 1 0 -1 -2 Standardized Residual F r e q u e n c y 2 1 0 -1 -2 8 6 4 2 0 Observation Order S ta n d a r d iz e d R e s id u a l 26 24 22 20 18 16 14 12 10 8 6 4 2 2 1 0 -1 -2
Normal Probability Plot of the Residuals Residuals Versus the Fitted Values
Histogram of the Residuals Residuals Versus the Order of the Data Residual Plots for Means
65
Copyright © 2018. IJEMR. All Rights Reserved.
III.
CONCLUSION
In this paper, the effects of the machining parameters were evaluated on surface roughness ,when step turning of Al Alloy under dry cutting condition were performed by using Taguchi methodology. The following specific conclusions are achieved based on the results:
For machining Aluminium alloy feed rate is the
most significant control factor.
Average surface roughness decreased with
increasing cutting speed during machining using carbide tipped tool inserts.
For obtaining better surface finish for machining
of material, the control parametric combinations are 3rd level spindle speed (2000 rpm), 1st level feed rate(0.2 mm/rev) and 1st level depth of cut(0.75 mm).
REFERENCES
[1] H.M.Somashekara & Dr. N. Lakshmana Swamy. (2012). Optimizing surface roughness in turning operation
using taguchi t echnique and anova. International Journal
of Engineering Science and Technology, 4(5), 1967- 1973.
[2] Gaurav Vohra, Palwinder Singh, & Harsimran Singh Sodhi. (2013). Analysis and optimization of boring process
parameters by using taguchi method. IJCSCE Special issue
on Recent Advances in Engineering & Technology,
232-237.
[3] Ranganath M S, Vipin, & R. S. Mishra. (2013). Optimization of process parameters in turning operation of aluminium (6061) with cemented carbide inserts using
taguchi method and anova. International Journal of
Advance Research and Innovation, 1(1), 13-21.
[4] Biswajit Das, R. N. Rai & S. C. Saha. (2013). Analysis of surface roughness on machining of al-5cu alloy in cnc
lathe machine. International Journal of Research in
Engineering and Technology, 2(9), 296-299.
[5] Md. Tayab Ali & Dr. ThuleswarNath. (2014). Cutting parameters optimization for turning aa6063-t6 alloy by
using taguchi method. International Journal of Research
in Mechanical Engineering & Technology, 4(2), 82-86.
[6] Ali Abdallah, BhuveneshRajamony, & Abdulnasser Embark. (2014). Optimization of cutting parameters for surface roughness in CNC turning machining with
aluminum alloy 6061 material. IOSR Journal of
Engineering, 4(10), 1-10.
[7] S.V.Alagarsamy & N.Rajakumar. (2014). Analysis of influence of turning process parameters on mrr & surface roughness of aa7075 using taguchi‟s method and rsm. International Journal of Applied Research and Studies,
3(4), 1-8.
[8] Taguchi G. (1990). Introduction to quality engineering.