Abstract—On 31 May 2003, the scan line corrector (SLC) of the Landsat 7 Enhanced Thematic Mapper Plus (ETM+) sensor which compensates for the forward motion of the satellite in the imagery acquired failed permanently, resulting in loss of the ability to scan about 20% of the pixels in each Landsat 7 SLC-off image. This permanent failure has seriously hampered the scientific applications of ETM+ images. In this study, an innovative gap filling approach has been introduced to recover the missing pixels in the SLC-off images using multi-temporal ETM+ SLC-off auxiliary fill images. A correlation is established between the corresponding pixels in the target SLC-off image and two fill images in parallel using the multiple linear regressions (MLR) model. Simulated and actual SLC-off ETM+ images were used to assess the performance of the proposed method by comparing with multi-temporal data based methods, the LLHM method which is based on simple linear regression (SLR) model. The qualitative and quantitative evaluations indicate that the proposed method can recover the value of un-scanned pixels accurately, especially in heterogeneous landscape and even with more temporally distant fill images.
Index Terms—ETM+SLC-off images, gap filling, multiple Linear Regression (MLR), simple linear regression (SLR).
I. INTRODUCTION
Since the first launch of the Landsat satellite series in 1972, the Landsat program has provided the longest continuous
_______________________________________________________________
ARO-The Scientific Journal of Koya University
Volume IV, No 2(2016), Article ID: ARO.10147, 10 pages DOI: 10.14500/aro.10147
Received 09 June 2016; Accepted 08 August 2016 Regular research paper: Published 09 September 2016 Corresponding author’s e-mail: [email protected]
Copyright © 2016 Asmaa S. Abdul Jabar , Ghazali B. Sulong, Loay E. George, Mohd Shafry and Zinah S. Abduljabar. This is an open access article distributed under the Creative Commons Attribution License.
multi-spectral data of the Earth's surface with excellent spatial resolution. The wealth of information that is provided from this observation has tremendously benefited and boosted scientists, researchers and common users in many fields such as soil mapping, agriculture, monitoring climate change, forestry, city planning, disaster response and relief, water management and other applications (Chen, Ye and Zhao, 2012; Zhu and Liu, 2014).In 1999, Landsat 7 with Enhanced Thematic Mapper Plus (ETM+), considered to be one of the most powerful satellites in Landsat program with the advancement of ETM+ over TM sensors, was launched. Consequently, it improved the spatial resolution of the thermal band 6 from 120 m to 60 m with the addition of a panchromatic band (band 8) of spatial resolution of 15m. Furthermore, the spatial resolution of the remaining multispectral bands (bands 1-5 and 7) is enhanced to 30 m. Notably, the ETM+ sensor visits every location on Earth every 16 days with a narrow field of view (15°) and swath of 185 km (Reza and Ali, 2008; Chen, et al., 2011).
The Scan Line Corrector (SLC) is an electromechanical instrument in the optical track of the ETM+ sensor on board of Landsat 7 which was exploited to compensate the forward motion of the satellite through the data gain (Markham, et al., 2004; Mohammdy, et al., 2014). Due to sudden and permanent collapse of this SLC instrument on May 31, 2003, nearly 20% of the pixels in an ETM+ image have not been scanned. These missing pixels caused the appearance of un-scanned locations (gaps) and severely hindered the use of these valuable data. Therefore, the individual image scans alternately overlapped instead of aligning in parallel scans thus creating such gaps ranging in width from a single pixel near the center of the scanned image to about 14 pixels toward the edges of the scene (Storey, et al., 2005; Wulder, et al., 2008).
Fortunately and despite the SLC failure, the radiometric and geometric qualities of the defective Landsat 7 images were not affected and about 80% of the pixels in the image were scanned in an appropriate manner without flaws (Chen, Tang
Reconstruction the Missing Pixels for Landsat
ETM+SLC-off Images Using Multiple Linear
Regression Model
Asmaa S. Abdul Jabar
1,2, Ghazali B. Sulong
1, Loay E. George
3, Mohd Shafry
1and
Zinah S. Abduljabar
21
UTM-IRDA Digital Media Center (MaGIC – X), Faculity of Computing, Universiti Technologi Malaysia UTM Skudai, 81310 Johor, Malaysia
2
Department of Computer, College of Science, University of Al-Mustansiriyah, Baghdad, F.R. - Iraq
3
and Qiu, 2010). Since then, the ETM+ images acquired with the SLC failure are referred to as "Landsat 7 SLC-off images". In contrast, the images obtained prior to the SLC failure are referred as "Landsat SLC-on images". Several methods are proposed and developed for recovering the missing pixels in Landsat 7 SLC-off images. Generally, the gap filling algorithms which are found to be successful in such image recovery are classified into single source and multi-source approaches.
In a single source approach, typically the gapped areas are reconstructed using non-gapped areas in the defective image itself. Traditional interpolation approaches such as bilinear, bicubic and nearest-neighbor algorithms are used for filling the gap in Landsat 7 ETM+ SLC-off images. Despite their easy and simple implementation, the performance of these algorithms remains poor because of the occurrence of a clear boundary between the fill gaps locations and the target image. This is primarily produced due to the calculation of filled value from the pixels residing around the gap locations, and the information is not the reflection of land (Desai and Ganatra, 2012)
Zhang et al. proposed a geostatistical interpolation approach using ordinary kriging geostatistical technique to fill the data gaps in the Landsat 7 SLC-off images by considering the spatial structure of the anomalous ETM+ image itself in the interpolation process. The results indicate that this approach was appropriate for assessment of the mapping in large scale landscape areas but with inaccurate results in small scale applications (Zhang, Li and Travis, 2007).
Alternatively, in multi-source methods, auxiliary data derived from the images of the same place and over different time (multi-temporal images) are used to fill the gaps in Landsat 7 SLC-off images. The random occurrence of gaps through the multi-spectral bands in Landsat 7 images allows one to use both SLC-on and/or SLC-off image (multi-temporal) as auxiliary images to restore the gaps in target SLC-off image (Hu, et al., 2011).
Soon after the breakdown of the SLC, a study team from USGS/NASA (United States Geological Survey/National Aeronautics and Space Administration) developed and tested two phases of gap filling products. Both phases are based on utilizing a histogram based compositing technique by combining a SLC-off target image with one or more SLC-on and/or SLC-off fill images. In phase 1 product, a global histogram matching (GHM) and local linear histogram matching (LLHM) algorithms were used to locate a linear transformation between target SLC-off images and temporally SLC-on fill images. Although GHM method performs well over desert and rocky areas where the scenes consist of invariant terrain, in a LLHM algorithm a moving window is used for greater precision results than GHM method (Scaramuzza, Micijevic and Chander, 2004; He, et al., 2011). Also, in LLHM method all the valid neighboring pixels within a search window are taken into account, not the spectral similarity of these pixels and this reduces the accuracy of the estimated values which lead to difficulties with heterogeneous
landscapes where the features are smaller than the local moving window size (Hossain, et al., 2015; Shen, et al., 2015). Thereafter, in phase 2 product an adaptive window local histogram matching (AWLHM) algorithm was declared as an enhancement to LLHM method by using multiple auxiliary SLC-off images and with changeable size of moving window in recovering method (USGS & NASA., 2004; Rulloni, Bustos and Flesia, 2012). Generally, the result of AWLHM is more rational than LLHM especially in homogeneous landscape, but it has difficulty to obtaining suitable results when significant changes occur in areas smaller than the local moving window size within the scene (Jabar, Sulong and George, 2014). Generally, these products are limited in their performance and often provide an inaccurate reflection value if the scene is combined with long temporal variability, contains cloud or covered with snow in target or fill images (Prasomphan, 2012).
Maxwell introduced the spectral interpolation approach to fill the gap locations with the same scene spectral data guided by a segmentation model derived from earlier SLC-on image (Maxwell, 2004), then for further improvement a multi-scale segmentation model was utilized and performed on three different case studies. Although these approaches are demonstrated to be effective to fill the missing pixels in SLC-off images in some studies, such as forest and grass mapping, the accuracy of the reflectance prediction was low in a heterogeneous landscape, especially in narrow and tiny objects as in roads and rivers (Maxwell, Schmidt and Storey, 2007).
A multispectral projection transformation gap filling approach has been developed by Boloorani et al. using valuable pixels derived from earlier acquired auxiliary Landsat 7 SLC-on image. The results indicate the superiority of this approach in preserving the radiometric characteristics of multispectral data, but with visible gap lines still appearing in areas with sharp radiometric differences (Boloorani, Erasmi and Kappas, 2008).
A cokriging geostatistical technique was proposed by Pringle et al. to estimate the ETM+ missing values using multi-temporal auxiliary SLC-off images. This geostatistical approach was able to estimate missing values accurately, but with difficulties in well prediction of the reflectance at pixel level. In addition, the computational intensiveness of this approach limits its application for mass production (Pringle, Schmidt and Muir, 2009).
when there is a long time interval between the target SLC-off image and the multi-temporal auxiliary fill images (Zhu, Liu and Chen, 2012).
Later, a Weighted Linear Regression (WLR) was introduced by Zeng et al. as an integrated method to reconstruct the majority of data gaps in malfunction image by using multi temporal ETM+ SLC-off fill images as auxiliary information to build a weighted linear regression model between the corresponding pixels. When the auxiliary multi-temporal data cannot quite recover the missing pixels, a non-reference regularization algorithm is performed to accomplish the filling process. However, WLR algorithm fails to recover the images when the scene contains complicated textures together with abrupt changes (Zeng, Shen and Zhang, 2013).
Several studies using data from sensors other than Landsat7 have been established to contribute information derived from these sensors in recovering the gap locations in SLC-off target image. For instance, Boloorani et al. used the information observed by EO-1/ALI satellite in the recovery process (Boloorani, Erasmi, and Kappas, 2008), Reza and Ali used IRS products in estimating the value of the gap locations (Reza and Ali, 2008), while Roy et al. and Chen et al. adopted MODIS and CBERS data as auxiliary information, respectively (Roy et al., 2008; Jiang, Lan and Wu, 2009). Normally, the use of auxiliary images of other sensors is restricted to spatial resolution similarity, spectral compatibility, and economy (Zeng, Shen and Zhang, 2013).
In general, based on the advantages and at the same time the flaws of the above methods, it is determined that the temporal data based approaches are more effective, multi-temporal Landsat7 data are also highly suitable as auxiliary fill images for gaps reconstruction in Landsat 7 SLC-off images. It is recognized that the gap locations may not be filled completely using one auxiliary image due to its lack of appropriateness. As a result, many auxiliary images are used in the progressive reconstruction process by considering the last filled image as a target in the next filled process. Therefore, by considering the limitation of such multi-temporal data based method in using only one auxiliary fill image in each step of reconstruction process, the main idea of this study is to develop an innovative multi- temporal reconstruction approach for filling the gaps in Landsat 7 SLC-off images by employing a system of linear equations derived from multiple linear regression (MLR) model using complementary information from two multi temporal Landsat 7 SLC-off fill images in parallel (parallel regression technique) with a high degree of accuracy. In addition, Cramer’s rule has been used to calculate the MLR coefficients rather than using the mean and standard deviation.
The remainder of this paper is organized as follows: Section II describes the mathematical formulation of the proposed method and later on demonstrates the steps of the applied algorithm. Section III presents the results of applying the proposed algorithm on simulated and actual SLC-off images and comparing the results with multi-temporal data based method, LLHM, and finally in section IV the conclusions and discussion of the derived results have been presented.
II. METHODOLOGY
In this study and for the purpose of suitability, the SLC-off image to be recovered is defined as the target image (FT) and
the auxiliary images that are selected to fill the gaps in target images are defined as the fill images. Two fill images are simultaneously used and a system of multiple linear regression equations have been used to estimate the missing values in the target image (FT) by exploiting the information extracted from
two auxiliary images (F1) and (F2) in order to ensure that all
gap locations have been filled.
A. Mathematical Formulation of the Multiple Linear Regression (MLR) Model
Overall, a regression model can be considered as a better method for estimating the values of the spatial data within a certain amount of correlated data sets (Jiang, Lan and Wu, 2009; Guo, et al., 2015). Earlier studies used a simple linear regression model (SLR) to recover every missing pixel in Landsat 7 SLC-off images by assuming a linear relationship between the target and one multi-temporal auxiliary fill scene. The calculation is performed on locally similar pixels that are derived from both target (FT) and one fill image (FF) using the
following expression,
) , ( )
,
(x y B GF x y
FT F (1)
where B and G are the linear regression coefficients for bias and gain, respectively, which are computed from the mean and standard deviation of the locally similar pixels (Lu and Wong, 2008). Generally, a progressive linear regression can be implemented by using another auxiliary fill image to recover the possible remaining gaps.
An extension to (SLR) model called multiple linear regression (MLR) is used to ensure the accurate recovery of all missing pixels. In this model the linear relationship between the target image and two fill images are established from the locally similar pixels extracted from them using the relation,
.
)
,
(
)
,
(
)
,
(
1 1 2 2 iT
x
y
b
G
F
x
y
G
F
x
y
F
(2)
where 𝐹𝑇 is the pixel to be filled in the target SLC-off
image at a location (x,y), F1 and F2 are the corresponding
pixels in the first and second auxiliary fill images respectively and 𝜀𝑖 represent the random error term (Wooldridge, 2012).
As in (SLR) model, the least square criteria are used for minimization the residuals using (Bonate, 2011).
2 2
2 1
1 1 1
2
) ) , ( )
, ( ) , (
(F x y GF x y G F x y b S
m
i T m
i
i
(3) where 𝑆 is the sum of the square of the residuals. The
0 )) , ( ( ) ) , ( ) , ( ) , ( ( 2 1 2 2 1 1 1 1
y x F b y x F G y x F G y x F G S m iT (4)
0 )) , ( ( ) ) , ( ) , ( ) , ( ( 2 2 2 2 1 1 1 2
y x F b y x F G y x F G y x F G S m iT (5)
0
)
1
)(
)
,
(
)
,
(
)
,
(
(
2
1 2 21 1
b
y
x
F
G
y
x
F
G
y
x
F
b
S
m iT (6)
Solving this system of linear equations, one gets,
m i m i m i m i T y x F b y x F y x F G y x F G y x F y x F 1 1 1 2 1 1 2 2 1 1 1 1 ) , ( ) , ( ) , ( ) , ( ) , ( ) ,( (7)
m i m i m i m i T y x F b y x F G y x F y x F G y x F y x F 1 2 1 2 2 2 1 2 1 1 2 1 ) , ( ) , ( ) , ( ) , ( ) , ( ) ,( (8)
m i m i m i m i T b y x F G y x F G y x F 1 1 2 2 1 1 1 1 1 ) , ( ) , ( ) , ( (9)These simultaneous linear equations are further solved sing Cramer’s rule to obtain G1,G2 and b in the form of determinants (Vavra and Fowler, 2010), given by:
1 1 1 2 1 2 2 2 2 1 1 2 1 2 1 2 2 2 2 2 1 2 1 1 F F F F F F F F F F F F F F F F F F F F F G T T T (10)
1 1 2 2 1 2 2 2 2 1 1 2 1 2 1 1 2 2 2 1 1 1 2 1 F F F F F F F F F F F F F F F F F F F F F G T T T (11)
1 2 1 2 2 2 2 1 1 2 1 2 1 2 1 2 2 2 2 1 1 2 1 2 1 F F F F F F F F F F F F F F F F F F F F F F F b T T T (12)B. Multi-Temporal Reconstruction Method based on MLR Model
As mentioned, the main idea behind the proposed approach is to fill the gap areas in Landsat 7 SLC-off images simultaneously by adopting a linear relationship between the missing pixel in the target image and the corresponding pixels in two fill images (parallel linear regression) using a multiple linear regression (MLR) model. Because the gaps in the defective Landsat 7 images do not overlap completely among scenes, it is reasonable to use multiple SLC-off ETM+ images as auxiliary images to fill the gaps in the target SLC-off image (Zhu, Liu and Chen, 2012). Therefore, in this study, a number of multiple SLC-off ETM+ images which cover the same area of the target image with different time acquisition are selected, then depending on degree of gap overlap between the target and these selected images, two auxiliary fill images will be chosen to ensure that for each missing pixel in the target image there is as much as possible a corresponding valid pixel in both fill images. Also, it is worth noting that the criteria for selecting the auxiliary SLC-off images are that the images be mostly free of clouds or snow cover, and their acquisition dates are close to that of the target image to minimize the seasonal differences and land cover change compared with the target image (Sulong, Sadiq and Edwar, 2015).
Fig. 1 illustrates the main steps of the parallel linear regression method based on the MLR model that is used for such recovery, for each band of the target image and the two fill auxiliary images. This new method is a three-step-process that allows the following:
Searching about the common valid pixels (K)
Extracting a moving window of size (𝑛 × 𝑛) around the missing pixel that was required to be filled in the target image
FTand the corresponding pixels in the two fill images F1and F2. For each moving window on the target as well as the two
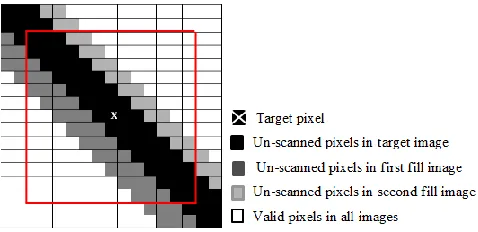
fill images, find the number of the valid pixels in the target and the two fill images (common valid pixels). Fig. 2 presents a schematic diagram of determining the common valid pixels in all input images (FT, F1and F2), because this study is based
pixel value. It is also important to specify the minimum number of these common valid pixels as reference number (RN) that will be used in the prediction of the value of the target pixel. Beginning with the initial window size (3 × 3), the number of common valid pixels (K) is counted. If the minimum number of common valid pixels (RN) is not appropriately met, the moving window size is expanded by one pixel on each side (i.e., 5 × 5 to 7 × 7…), and the common valid pixels are counted again. The extension of the window size is continued until the minimum required number of common valid pixels (RN) is achieved. If the required number of common valid pixels is not met before reaching the maximum size of the moving window, then all commonly scanned pixels in the moving window are used to predict the target pixel value, regardless of the total number of common pixels. Also, the size of moving window is determined depending on the homogeneity of the scene. In case of heterogeneous landscape, a larger window size is required to guarantee that sufficient valid pixels will be selected. Considering that, the larger window size is found to yields essentially identical results, but also will consume more computingtime. Therefore, in this study and because of using two fill images simultaneously and because of dealing with gaps with moderate size (6-8 pixels), then the maximum window size has to be set to 13 × 13 and the minimum number of common valid pixels (K) is set to 15. This means, a minimum number using 15 valid pixels at the same location from both auxiliary fill images in prediction of the target missing pixel value.
Fig. 1. The main steps of parallel linear regression method based on MLR model.
Calculating the Coefficients of MLR Model
The common valid pixels extracted from the target and two
auxiliary fill images, first and second, in previous steps are used to calculate the three MLR model coefficients, G1, G2
and b using 10,11 and 12 equations. It is noteworthy that each coefficient in the MLR model includes the summation of variables from FT, F1and F2 which is related to valid pixels in
the target, first and second fill images, and these variables are extracted from the same locations in target and two fill images simultaneously.
Fig. 2. Schematic diagram of the selection of common valid pixels from target and two SLC-off fill images within a moving window.
Calculating the Predictive Value:
After calculating the MLR coefficients, G1, G2 and b, the estimated value of missing pixel in 𝐹𝑇 is calculated using the
following multiple linear equation;
) , ( )
, ( )
,
(x y b G1F1 x y G2F2 x y
FT (13)
III. EXPERIMENTAL RESULTS
To evaluate the performance of the proposed method, experiments were implemented on both simulated and real SLC-off ETM+ images with the gap width of approximately 6-8 pixels. The L1G product acquired from the USGS website (http://glovis.usgs.gov/) was used as a dataset and all data used in this study is stored as the original 8-Byte integer value. In the simulated experiments, the quantitative accuracy of the proposed MLR method is assessed by comparing the estimated or predicted pixel (𝑋𝐸) with the actual or real pixel
(𝑋𝐴) through various statistical indices within the total
number of gaps (N) in the scene. The precision of the recovered pixels is assessed by means of the Pearson correlation coefficient (𝑟), Root Mean Square Error (𝑅𝑀𝑆𝐸) and Average Relative Error (𝐴𝑅𝐸) given by:
2 2
1
) (
) (
) )(
(
A A E E N
i
A A E E
X X X X
X X X X r
(14)N X X RMSE
N
i
A E
1
2 ) (
% 100 )) / (
( 1
N X X X ARE
N
i
A E A
(16)
where 𝑋̅𝐸 and 𝑋̅𝐴 are the mean of predicted and real values,
respectively (Chen, et al., 2011; Zeng, Shen and Zhang, 2013). Pearson indicator 𝑟 measures the strength of the linear relationship between two input variables, which varies between -1 to +1. Perfect negative correlation gives r = -1, r = +1 signifies perfect positive correlation, and r = 0 implies the complete absence of any correlation. Mean Square Error (MSE), also known as residuals, determine the difference between 𝑋𝐸and 𝑋𝐴 and RMSE is the square root of MSE.
Also, ARE is used to assess how the predictive or forecasting value is close to the actual or real value which is calculated by dividing the relative error (RE) with the total number of gaps in the scene N, and the relative error is obtained by dividing the absolute error by real value. Both RMSE and ARE are used to measure the precision of the recovering method (Zeng, Shen and Zhang, 2013). The smaller the values of RMSE and ARE, the better of the prediction.
A. Experimental Results on Simulated SLC-off Images
The region that is covered by Path 169 and Row 37 in World Reference System 2 (WRS-2) is selected for experimentation. Three true color bands (Red = band 3, Green = band 2 and Blue = band 1) with 300 x 300 pixel sub images are used. An intensive study area located within the experimental region is chosen to simulate a SLC-off test image. It is consisting of the part of the Euphrates River with its surrounding arable land. The arable lands comprise green and non-green vegetation together with a bare ground that is displayed as a gray segment in the image.
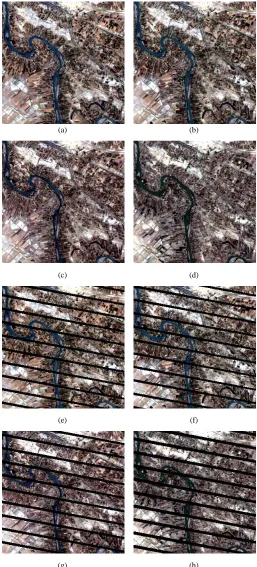
In this work and in order to provide a comprehensive study to test the performance of the proposed method, four Landsat 7 SLC-on images that covered the same study area which were acquired on different dates in 2001 were selected to create one simulated target SLC-off image and a number of auxiliary fill SLC-off images. Fig. 3(a) – Fig. 3(d) shows the four Landsat 7 SLC-on images that are used to present the simulated images and which will then be used to test the proposed method. These images were acquired in 2001 on June 6, June 22, July 8 and September 10 respectively, while Fig. 3(e) - Fig. 3(h) shows the simulated SLC-off images generated from (a-d) respectively. The indicated simulated gaps in these tested images were generated by applying a gap mask from real or actual ETM+ SLC-off images acquired in 2007, where the zero values of the gap pixels replaced the pixel values in the same locations on the test images.
Subsequently, the simulated image in Fig. 3(g) acquired on July 8 is used as the target image to be filled while the remaining simulated images (e, f and h) are used as auxiliary fill images in two case studies and on each case study, both the proposed MLR and LLHM methods were implemented and compared.
(a) (b)
(c) (d)
(e) (f)
(g) (h)
Fig. 3. Red-green-blue composites of Landsat7 SLC-on images acquired in 2001 for the simulation test: (a-d) acquired on June 6, June 22, July 8 and September 10 respectively. (e-h) the SLC-off image were simulated based on (a-d) respectively.
Fig. 4 shows the simulated images for the first case study, where the target SLC-off image (FT) in (c) is filled using two
which was acquired on June 22 and presented in Fig. 4(b), was used as a fill image.
(a) (b)
(c)
Fig. 4. The simulated SLC-off images for the first case study: (c) is the target image to be filled which was acquired in 2001 on July 8 and (a and b) are the simulated auxiliary fill images that were acquired before the time acquisition of the target image (in 2001 on Jun 6 and 22) respectively.
For further performance evaluation of the proposed method,
the fill image with time acquisition prior to the target image acquisition is used as first fill image (F1) and the fill image
with time acquisition after the target image acquisition is used as second fill image (F2). Figure 5 shows the second case
study where the same target SLC-off image (FT) in Fig. 5 (b)
is filled using two temporally distant fill images with time acquisition before and after the time acquisition of the target image simultaneously, on June 6 and September 10 respectively. It is obvious that the two images (a) and (b) are almost identical, but (b) and (c) are different, which is primarily attributed to the seasonal difference in the capture of these images, namely summer (image b) and autumn (image c). Also, with LLHM method, the simulated image in Fig. 5(a) that was acquired reasonably close to the date of the target image, June 6, was used as the fill image.
Finally, an actual SLC-on image (July 8, 2001) is used to validate the performance of the proposed MLR and the LLHM method by comparing the filled images with the real one.
Figure 6 demonstrates the filled results of the same target simulated SLC-off images in Fig. 4 and 5 by using fill images with different dates as presented in the two simulated case study, where Fig. 6 (a-b) displays the actual SLC-on image and the corresponding simulated target SLC-off image
respectively, while Fig. 6(c) – Fig. (f) shows all the filled images of the same target image in Fig. 4 and 5 using the LLHM and the proposed MLR methods respectively. Remarkably, the images recovered by the MLR method are found to be very much closer to the real or actual image in Fig. 6(a) than the one recovered via LLHM despite using different auxiliary fill images with different time acquisitions.Furthermore, the zoomed areas of these filled images reveal superior visual details of the proposed method over the LLHM method even when using temporally distant fill images. The presence of visible errors in recovering images with L LHM, especially in the land surface with abrupt changes such as near the river, implies the inaccurate prediction by the LLHM method for heterogeneous landscapes. This notable alteration in the ground features may be due to the acquisition of one of the fill images (F2 in the
second case study) in a different season from the target image. Therefore, the implementation of the proposed MLR method is generally demonstrated to be better in terms of recovering the shape of ground features as compared to the LLHM method.
(a) (b)
(c)
Fig. 5. The simulated SLC-off images for the second case study: (b) is the target image to be filled which were acquired in 2001on July 8; (a and c) are the simulated auxiliary fill images acquired before (F1) and after (F2) the time
acquisition of the target image (in 2001 on Jun 6 and September 10) respectively.
and despite using more temporally distant fill images are found to achieve higher prediction accuracy in all indicators compared to LLHM method. In addition, the Pearson index (r) attained the highest values in all bands with a remarkable relative reduction in RMSE and ARE% values. This is essentially apparent when the time interval between acquisition dates of the fill and target images is larger as in the second case study. For example, for band 2, the proposed
method slightly reduces RMSE values compared to the LLHM method (from 0.0555841 to 0.0531810) in the first case study when using temporally closer fill images, while for the same band there is a great reduction in RMSE (from 0.0707773 to 0.043823) using the proposed method when the more temporally distant fill images are used.
(a) (b)
(c) (d)
(e) (f)
Fig. 6. .Results of gap-fill for the simulated SLC-off image: (a and b) the actual image and corresponding SLC-off simulated image respectively; (c and d) results of LLHM and MLR of fig. 4 (c) respectively using two previous fill images; (e and f) results of LLHM and MLR of fig. 5 (b) respectively using temporally far fill previous and fill next images.
B. Experimental Results on Actual SLC-off Images:
For further performance evaluation of the proposed method, both proposed MLR and LLHM methods have been carried out by applying them to the real or actual Landsat7 SLC-off
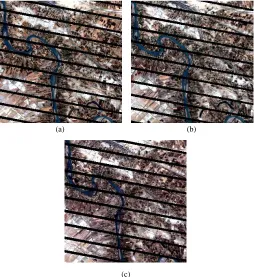
images that were acquired in 2013. The actual SLC-off image acquired on July 25 as shown in Figure 7(b) is used as the target image to be filled (FT). Meanwhile, the two SLC-off
respectively, with the proposed MLR method while with LLHM method, the first fill image (F1) was acquired
reasonably close to the date of the target image, May 22, and presented in Fig. 7(a) was used as the fill image. Figs. 7(d) and 7(e) present the results of MLR and LLHM method respectively. The present MLR method is found to achieve excellent visual clarity, where most of the gaps are recovered with high superior quality of the filled image as compared to LLHM method which displays shadow in the recovered areas indicating inaccurate estimation of the missing values.
IV. DISCUSSION AND CONCLUSION
Despite the SLC failure, the radiometric and geometric quality of the ETM+ imagery is still excellent for many applications on regional and global scales over other satellite images. Therefore, a number of recovery techniques have been developed to fill the missing data locations in Landsat 7 SLC-off images.
In this study, a new multi-temporal recovering approach has been presented and evaluated for predicting the missing pixels in Landsat 7 SLC-off images by extending a standard multi temporal data method, LLHM, which is based on a simple linear regression model. This expansion was adopted through a multi-temporal reconstruction method based on multiple linear regression (MLR) models to precisely recover the mostly degraded pixels by exploiting information derived from two multi-temporal SLC-off auxiliary fill images simultaneously. The simulated and actual SLC-off images are analyzed using the proposed model and compared with the results of LLHM method. Also, with simulated case studies, the quantitative comparison was implemented by calculating the values of r, RMSE and IS metrics for both MLR and LLHM methods.
Generally, despite using different fill images situations, two previous fill images as in first simulated case study and more temporally distant fill previous and fill next images as in second simulated case study, the experimental results on both
simulated and real case studies demonstrate that the proposed MLR approach provides a good tool in filling the missing pixels in SLC-off image where the filled locations are reasonable approximations of the actual SLC-on image more than LLHM approach. It is also obvious that the reconstructed images by the proposed method have good continuity and accuracy with no obvious shadows in filled images as in LLHM results. In addition, the statistical summary of the errors specifies that the new proposed method is found to achieve higher prediction accuracy. However, the present algorithm is tested only on specific gap width of 6 to 8 pixels. Further researches are required for estimating the missing values in the gaps with large width by assigning a suitable weight for each pixel contributing in the estimation process within the searching window.
(a) (b)
(c) (d)
(e)
Fig. 7. The experiment results of actual Landsat7 SLC-off image (taken in 2013) (a) first fill image on May 22; (b) target image on July 25 and (c) second fill image on September 27; obtained result (d) from proposed MLR method and (e) from the LLHM method.
TABLE I
THE ACCURACY OF THE RECOVERED IMAGES OBTAINED FROM LLHM AND PROPOSED MLRMETHOD IN TWO SIMULATED CASE STUDIES
Filled results of Fig. 4 Case1
Filled results of Fig. 5 Case2
Statistical
Indicator Band LLHM MLR LLHM MLR
B1 0.896294 0.929330 0.889631 0.927471
r B2 0.883729 0.927142 0.883677 0.925343
B3 0.914987 0.943002 0.869451 0.917354
B1 1.336410 1.323570 1.630620 1.360180
ARE% B2 0.977490 0.956006 1.215000 0.970970
B3 1.053240 1.091280 1.428940 1.137720
B1 0.063971 0.061942 0.080026 0.062800
RMSE B2 0.055584 0.053181 0.070777 0.043823
ACKNOWLEDGMENT
Asmaa S. Abdul Jabar is grateful to the Iraqi Ministry of Higher Education & Scientific Research and the University of Al-Mustansiriyah for their sponsoring her Ph.D. study.
REFERENCES
Boloorani, A.D., Erasmi, S. and Kappas, M., 2008, February. Multi-source image reconstruction: exploitation of EO-1/ALI in Landsat-7/ETM+ SLC-off gap filling. In Electronic Imaging 2008 (pp. 681219-681219). International Society for Optics and Photonics.
Boloorani, A.D., Erasmi, S. and Kappas, M., 2008. Multi-source remotely sensed data combination: Projection transformation gap-fill procedure.
Sensors, 8(7), pp.4429-4440.
Bonate, P. L., 2011. Linear Models and Regression:Ch.2, inUSA,(2nd Ed.): Pharmacokinetic- Pharmacodynamic Modeling and Simulation, Springer, Science+Business Media, LLC, pp.61-100.
Chen, F., Tang, L. and Qiu, Q., 2010, June. Exploitation of CBERS-02B as auxiliary data in recovering the Landsat7 ETM+ SLC-off image. In
Geoinformatics, 2010 18th International Conference on (pp. 1-6). IEEE.
Chen, F., Tang, L., Wang, C. and Qiu, Q., 2011. Recovering of the thermal band of Landsat 7 SLC-off ETM+ image using CBERS as auxiliary data.
Advances in Space Research, 48(6), pp.1086-1093.
Chen, F., Ye, H. and Zhao, X., 2012. Making Use of the Landsat 7 SLC-off ETM+ Image Through Different Recovering Approaches. Rijeka, Croatia: INTECH Open Access Publisher.
Chen, J., Zhu, X., Vogelmann, J.E., Gao, F. and Jin, S., 2011. A simple and effective method for filling gaps in Landsat ETM+ SLC-off images. Remote Sensing of Environment, 115(4), pp.1053-1064.
Desai, M. and Ganatra, A., 2012. Survey on gap filling in satellite images and inpainting algorithm. International Journal of Computer Theory and Engineering, 4(3), p.341.
Guo, G., You, W., Qian, G. and Shao, W., 2015. Parallel maximum likelihood estimator for multiple linear regression models. Journal of Computational and Applied Mathematics, 273, pp.251-263.
He, Q., Shan, B., Ma, H., Chen, Y. and Wang, X., 2011, July. Research on Algorithms for Recovering Landsat-7 Gap Data. In Control, Automation and Systems Engineering (CASE), 2011 International Conference on (pp. 1-4). IEEE.
Hossain, M. S., Bujang, J. S., Zakaria, M. H., and Hashim, M., 2015. Assessment of Landsat 7 Scan Line Corrector-off data gap-filling methods for seagrass distribution mapping. International Journal of Remote Sensing,
36(4), pp 1188-1215.
Hu, W., Li, M., Liu, Y., Huang, Q. and Mao, K., 2011, June. A new method of restoring ETM+ SLC-off images based on multi-temporal images. In
Geoinformatics, 2011 19th International Conference on (pp. 1-4). IEEE.
Jabar, A., S. , Sulong, G. and George, L.E., 2014. SURVEY ON GAP FILLING ALGORITHMS IN LANDSAT 7 ETM+ IMAGES. Journal of Theoretical & Applied Information Technology, 63(1).
Jiang, Y., Lan, T. and Wu, L., 2009, December. A Comparison Study of Missing Value Processing Methods in time series data mining. In
Computational Intelligence and Software Engineering, 2009. CiSE 2009. International Conference on (pp.1-4). IEEE.
Lu, G.Y. and Wong, D.W., 2008. An adaptive inverse-distance weighting spatial interpolation technique. Computers & Geosciences, 34(9), pp.1044-1055.
Markham, B.L., Storey, J.C., Williams, D.L. and Irons, J.R., 2004. Landsat sensor performance: history and current status. Geoscience and Remote Sensing, IEEE Transactions on, 42(12), pp.2691-2694.
Maxwell, S., 2004. Filling Landsat ETM+ SLC-off gaps using a segmentation model approach. Photogrammetric Engineering and Remote Sensing, 70(10), pp.1109-1112.
Maxwell, S.K., Schmidt, G.L. and Storey, J.C., 2007. A multi‐scale segmentation approach to filling gaps in Landsat ETM+ SLC‐off images.
International Journal of Remote Sensing, 28(23), pp.5339-5356.
Mohammdy, M., Moradi, H.R., Zeinivand, H., Temme, A.J.A.M., Pourghasemi, H.R. and Alizadeh, H., 2014.Validating gap-filling of Landsat ETM+ satellite images in the Golestan Province, Iran. Arabian Journal of Geosciences, 7(9), pp.3633-3638.
Prasomphan, S., 2012, December. Imputing Landsat7 ETM+ with SLC-off image using the similarity measurement between two clusters. In Future Generation Communication Technology (FGCT), 2012 International Conference on (pp.190-195). IEEE.
Pringle, M.J., Schmidt, M. and Muir, J.S., 2009. Geostatistical interpolation of SLC-off Landsat ETM+ images. ISPRS Journal of Photogrammetry and Remote Sensing, 64(6), pp.654-664.
Reza, M.M. and Ali, S.N., 2008. Using IRS products to recover 7ETM+ defective images. American Journal of Applied Sciences, 5(6), pp.618-625.
Roy, D.P., Ju, J., Lewis, P., Schaaf, C., Gao, F., Hansen, M. and Lindquist, E., 2008. Multi-temporal MODIS–Landsat data fusion for relative radiometric normalization, gap filling, and prediction of Landsat data. Remote Sensing of Environment, 112(6), pp.3112-3130.
Rulloni, V., Bustos, O. and Flesia, A.G., 2012. Large gap imputation in remote sensed imagery of the environment. Computational Statistics & Data Analysis, 56(8), pp.2388-2403.
Scaramuzza, P., Micijevic, E. and Chander, G., 2004. SLC gap-filled products phase one methodology. Landsat Technical Notes. Available from http://landsat.usgs.gov/documents/SLC_Gap_Fill_Methodology.
Shen, H., Li, X., Cheng, Q., Zeng, C., Yang, G., Li, H., and Zhang, L., 2015. Missing information reconstruction of remote sensing data: A technical review. IEEE Geoscience and Remote Sensing Magazine, 3(3), pp.61-85.
Storey, J., Scaramuzza, P., Schmidt, G. and Barsi, J., 2005, October. Landsat 7 scan line corrector-off gap filled product development. In Proceedings of Pecora, 16, pp. 23-27.
Sulong, G.,Sadiq, A. and Edwar , L., 2015. Single and Multi-source Methods for Reconstruction the Gaps in Landsat 7 ETM+ SLC-off Images. Research Journal of Applied Sciences, Engineering and Technology, 11(4), pp.423-428.
USGS & NASA., 2004, SLC-off Gap-Filled Products Gap-fill Algorithm Methodology: Phase2. Available from www.ga.gov.au/servlet/BigObjFileManager?bigobjid=GA4861.
Vavra, L. M., Fowler, D., 2010. Cramer’s Rule.
Wooldridge, J.M., 2012. Chapter 3: Multiple regression analysis: Estimation, in USA (5th Ed.), Introductory Econometrics, A Modern Approach,South Western.
Wulder, M.A., Ortlepp, S.M., White, J.C. and Maxwell, S., 2008. Evaluation of Landsat-7 SLC-off image products for forest change detection. Canadian Journal of Remote Sensing, 34(2), pp.93-99.
Zeng, C., Shen, H. and Zhang, L., 2013. Recovering missing pixels for Landsat ETM+ SLC-off imagery using multi-temporal regression analysis and a regularization method. Remote Sensing of Environment, 131, pp.182-194.
Zhang, C., Li, W. and Travis, D., 2007. Gaps‐fill of SLC‐off Landsat ETM+ satellite image using a geostatistical approach. International Journal of Remote Sensing, 28(22), pp.5103-5122.
Zhu, X. and Liu, D., 2014. MAP-MRF approach to Landsat ETM+ SLC-Off image classification. Geoscience and Remote Sensing, IEEE Transactions on, 52(2), pp.1131-1141.