This is an open access journal, and articles are distributed under the terms of the Creative Commons Attribution-Non Commercial-ShareAlike 4.0 License, which allows others to remix, tweak, and build upon the work non-commercially, as long as appropriate credit is given and the new creations are licensed under the identical terms.
© 2018 Journal of Advanced Pharmacy Education & Research | Published by SPER Publication
37
Estimation of validation parameters of Uv-Spectrophotometric
method for analysis of Valsartan
Dobrina Tsvetkova*, Stefka Ivanova
Department of Pharmaceutical Chemistry, Faculty of Pharmacy, Medical University-Sofia, 2 Dunav str., Sofia 1000, Bulgaria.
Correspondence: Dobrina Tsvetkova, Department of Pharmaceutical Chemistry, Faculty of Pharmacy, Medical University-Sofia, Dunav str. N: 2, 1000, Sofia, Bulgaria. E mail:dobrinka30 @ mail.bg
ABSTRACT
The aim of recent investigation was the estimation of the validation analytical parameters selectivity, linearity, LOD, LOQ, accuracy and precision for UV-spectrophotometric method for analysis of Valsartan at λmax = 252 nm (99.98 % ethanol) and λmax = 250 nm (methanol). Selectivity was proved by the fact that in UV-spectra of blank solution was not observed the measured absobance at Valsartan specific wavelengths. The experimental results were subjected to a linear regression analysis: 99.98 % ethanol: y = 81628.x
– 0.0226 (A > 0.2); y = 88004.x – 9.10-5 (A < 0.2); methanol: 39508.x + 0.095 (A > 0.2); 53659.x + 0.008 (A < 0.2). Linearity is
characterized by coefficient of linear regression: R2 0.98. In 99.98 % ethanol LOD = 1.84.10–9 g/ml; LOQ = 6.12.10–9 g/ml; in
methanol: LOD = 9.4.10–8 g/ml; LOQ = 3.16.10–7 g/ml. Accuracy is represented by the degree of recovery, which suit confidence
intervals:
1) 99.98 % ethanol: RСV160 : 97.51 %
99.11 %; 2) methanol: RСV160: 97.74 %
100.06 %. Results for precision correspond to the relevant interval:1) 99.98 % ethanol: СV160: 157.06 mg
157.94 mg; 2) methanol: СV160: 157.52 mg
158.90 mg.Keywords:Valsartan, UV-spectrophotometry, validation, accuracy, precision, linearity.
Introduction
Angiotensin-receptor antagonists Irbesartan [1], Olmesartan [2]
and Valsartan (Figure 1) [3] are applied for theatment of high
blood pressure.
N COOH
H3C CH3
O H3C
N N N HN
Figure 1:Chemical structure of Valsartan.
For analysis of sartans often are applied UV-spectrophotometry
[4] and HPLC [2]. For determination of Valsartan in pure form
are described HPLC (λ = 233 nm) [5] and
UV-spectrophotometry [6] and for tablets are reported: HPLC: λ =
210 nm [7]; λ = 273 nm [8]; = 265 nm and second derivative
UV-spectrophotometry. [9] First-derivative
UV-spectrophotometry and HPLC were used for simultaneously determination of Valsartan and Hydrochlorothiazide in dosage forms. [10]
HPLC disadvantage is the requirement of a skilled technician for monitoring. The disadvantage of derivative spectrophotometry is susceptibility towards changes in the apparatus parameters. Small differences in the wavelength setting have a great effect on the result, especially in the zero-crossing technique, where errors in the registration of the spectrum are the reason for method non-reproducibility. The advantage of the classical UV spectrophotometry in comparison with HPLC is that is inexpensive and easy to use. In comparison with UV-derivative method, conventional UV-method is with low susceptibility towards changes in the apparatus parameters. [11]
Due to these reasons, the aim of current study was the estimation of the validation analytical parameters selectivity, linearity, LOD, LOQ, accuracy and precision for conventional UV-spectrophotometric method for analysis of Valsartan in
Access this article online
Website:www.japer.in E-ISSN: 2249-3379
How to cite this article:Dobrina Tsvetkova, Stefka Ivanova.Estimation of validation parameters of Uv-Spectrophotometric method for analysis of Valsartan. J Adv Pharm Edu Res 2018;8(3):37-42.
Source of Support: Nil, Conflict of Interest: None declared.
38 Journal of Advanced Pharmacy Education & Research | Jul-Sep 2018 | Vol 8 | Issue3
99.98 % ethanol at λmax = 252 nm and in methanol at λmax = 250 nm.
Materials
І. Reference standard: Valsartan (98 %) (Sigma Aldrich, N: SML 0142).
II. Reagents with analytical grade of puruty: 99.98 % ethanol (Sigma Aldrich, N: SZBD 0500 V UN 1170), methanol (99.9 %) (Sigma Aldrich, N: SZBD 063AV UN 1230).
METHODS. UV-spectrophotometry.
I. Equippment – UV-VIS diode array
spectrophotometer (Hullett Packard N: 8452 A). II. Validation of analytical parameter linearity.
1. Preparation of solutions of reference
standard Valsartan in 99.98 % ethanol and
methanol.
An accurately weighed quantities from reference standard Valsartan were dissolved in a volumetric flask of 200.0 ml respectively in 99.98 % ethanol (10 mg, 20 mg, 60 mg, 120 mg, 140 mg, 160 mg, 200 mg) and methanol (24 mg, 34 mg, 50 mg, 70 mg, 120 mg, 160 mg, 200 mg). From every solution an aliquot part of 1.0 ml separately was diluted with 99.98 % ethanol to 100.0 ml (5.10–7 g/ml; 1.10–6 g/ml; 3.10–6
g/ml; 6.10–6 g/ml; 7.10–6 g/ml; 8.10–6 g/ml; 1.10–5 g/ml) and
in methanol (1.2.10–6 g/ml; 1.7.10–6 g/ml; 2.5.10–6 g/ml;
3.5.10–6 g/ml; 6.10–6 g/ml; 8.10–6 g/ml; 1.10–5 g/ml).
2. Preparation of model mixtures of
reference
standard
Valsartan
for
validation of the method in terms of
analytical
parameters
accuracy
and
precision (repeatability).
Three equal homogenous model mixtures were prepared from the most used in tablets supplement starch by adding of reference standard Valsartan, equivalent to: 75 %: 120 mg (V120), 100 %: 160 mg (V160), 125 %: 200 mg (V200) of its concentration in tablets (160 mg). For every mixture were prepared 3 samples by accurately weighed quantity, containing reference standard Valsartan: 120 mg, 160 mg and 200 mg. All samples were dissolved separately in 99.98 % ethanol in volumetric flasks 200.0 ml. Aliquot parts of 1.0 ml of every of 9 resulting solutions were diluted with the same solvent to 100.0 ml. to obtain solutions with concentration оf Valsartan respectively: 6.10-6 g/ml; 8.10-6
g/ml; 1.10-5 g/ml. By the same manner were prepared 3
samples from 3 model mixtures of reference standard Valsartan by dissolving in methanol.
For linearity, accuracy and precision all solutions in 99.98 % ethanol were analyzed at λ = 252 nm against blank 99.98 % ethanol and the absorbance of solutions in methanol was measured at λ = 250 nm, using methanol as blank solution.
3. Root limit mean square error method
(RMSE) for the determination of limit of
detection (LOD) and limit of quantitation
(LOQ).
Calibration curves were constructed by analysis of solutions with low concentrations (absorbance A 0.2). The data were subjected to linear regression analysis and the linear correlation coefficients (R2) were obtained. From the regression equation:
y = a.x + b were calculated the predictable absorbance value (Ap); the error E = |Ap - A|; E2 = [|Ap - A |]2, E1= ;
RMSE = ; LOD = 3.RMSE/а; LOQ = 10.RMSE/а. [12]
Results and Discussion.
I. Validation of UV-spectrophotometric
method.
[13-15]1) Selectivity.
In the same manner like solutions with reference standard Valsartan, blank solutions respectively in 99.98 % ethanol and in methanol were prepared for the estimatiton of analytical parameter selectivity. In blank solutions was included the used in tablets supplement starch without the active ingredient Valsartan.
Selectivity was proved by the fact that in UV-spectra of blank solutions were not observed the measured absorption at the specific for Valsartan wavelengths.
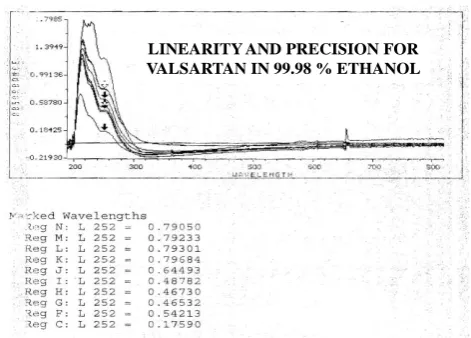
Spectra for linearity and precision for Valsartan reference standard in 99.98 % ethanol and methanol are illustrated on Fig. 2., Fig. 3. and Fig.4.
LINEARITY AND PRECISION FOR VALSARTAN IN 99.98 % ETHANOL
Journal of Advanced Pharmacy Education & Research | Jul-Sep 2018 | Vol 8 | Issue3 39 LINEARITY AND PRECISION FOR
VALSARTAN IN METHANOL
Figure 3:Linearity and precision for Valsartan reference standard in methanol.
PRECISION FOR VALSARTAN IN METHANOL
Figure 4. Precision for Valsartan reference standard in methanol.
2. Linearity: application of method of linear
regression analysis.
Linearity is the range within the signal from the detector remains in linear dependency from the concentration of analyte.
[13-15]
From standard Valsartan were prepared a series of solutions with increasing concentrations. For A > 0.2 and A < 0.2 for every concentration the values of the absorbance (A) at the respective wavelenght were measured and resuts are summarized on Table 1.
Table 1. Concentrations and absorbanses for referense standard Valsartan in 99.98 % ethanol and methanol.
99.98 % Ethanol Methanol
Concentration Absorbanse Concentration Absorbanse
[g/ml] (AU) [g/ml] (AU)
1 5.10–7 0.04388 1.2.10–6 0.07405
2 1.10–6 0.08795 1.7.10–6 0.09866
3 3.10–6 0.17590 2.5.10–6 0.14349
4 6.10–6 0.46730 3.5.10–6 0.21994
5 7.10–6 0.54213 6.10–6 0.35248
6 8.10–6 0.63997 8.10–6 0.41620
7 1.10–5 0.79050 1.10–5 0.47955
7 1.10–5 0.79050 1.10–5 0.47955
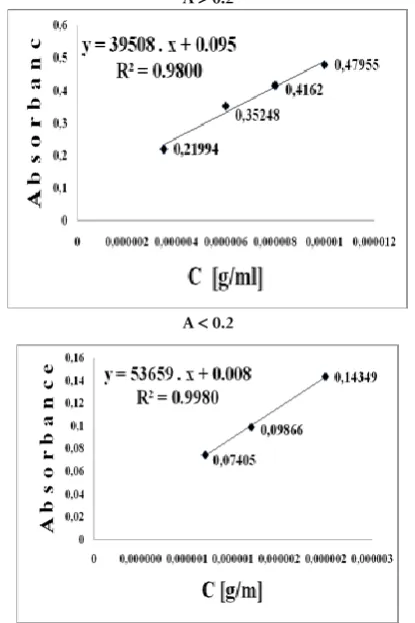
Results were subjected to a linear regression analysis. Linearity at A > 2 and A < 0.2 is illustrated by the calibration curves: Fig 5. (99.98 % ethanol) and Fig 6. (methanol).
A 0.2
A 0.2
Figure 5.Linearity for Valisartan in 99.98 % ethanol (λ = 252 nm).
A 0.2
A 0.2
Figure 6.Linearity for Valisartan in methanol (λ = 250 nm).
40 Journal of Advanced Pharmacy Education & Research | Jul-Sep 2018 | Vol 8 | Issue3
absorbance maximum. Linearity is characterized by coefficient of linear regression, which is R2 0.98.
Table 2.Characteristics of the UV-method by parameters
of regression equations.
N: Parameters 99.98 % Ethanol Methanol A > 0.2 A < 0.2 A > 0.2 A < 0.2
1. λ max (nm) 252 252 250 250
2 Concentration range (g/ml) 6.10–6 1.10–5
5.10–7
3.10–6
3.5.10–6
1.10–5
1.2.10–6
2.5.10–6
3. Regression equation –81628.x 0.0226 88004.x –9.10-5
39508.x + 0.095
53659.x +0.008 4. Slope (a) 81628 88004 39508 53659 5. Intersept (b) – 0.0226 – 9.10-5 0.095 0.008
6. coefficient (RCorrelation 2) 0.9975 1 0.9800 0.9980
3. Limit of detection (LOD) and limit of
quantitation (LOQ).
LOD and LOQ are based on regression equations for A < 0.2: y = 88004.x – 9.10-5 (99.98 % ethanol) (Тable 3.) and y =
53659.x + 0.008 (methanol) (Тable 4.) by application of RMSE-method.
Тable 3. RMSE-method for LOD and LOQ for Valsartan in
99.98 % ethanol. C
[g/ml] A Ap A – Ap Е
2 =
[|Ap – A|]2
E1= RMSE=
2.10–6 0.17590 0.17592 0.00002 4.10–10
1.10–6 0.08795 0.08791 0.00004 1.6.10–9 2.9.10–9 5.39.10–5
5.10–7 0.04388 0.04391 0.00003 9.10–10
Linear range [g/ml]
5.10–7
3.10–6
LOD
[g/ml] 1.84.10
–9
LOQ
[g/ml] 6.12.10–9
Тable 4. RMSE-method for LOD and LOQ for Valsartan in
methanol. C
[g/ml] A Ap A – Ap Е
2 =
[|Ap – A|]2
E1= RMSE =
2.5.10–6 0.14349 0.14295 0.00054 2.91.10–7
1.7.10–6 0.09866 0.10002 0.00136 1.85.10–6 2.88.10–6 1.7.10–3
1.2.10–6 0.07405 0.07319 0.00086 7.39.10–7
Linear range [g/ml]
1.2.10–6
2.5.10–6
LOD
[g/ml] 9.4.10–8
LOD
[g/ml] 3.16.10–7
4. Accuracy
Accuracy is the degree of correspondence between the obtained average result of repeated analysis and the actual value. [13-15] On
Table 5. are presented data for added content of standard Valsartan in 3 samples for 3 model mixtures in 99.98 % ethanol and methanol: V120 (120 mg, 75 %); (average weight (AV) =
0.28 g); V160 (160 mg, 100 %) (AV) = 0.38 g); V200 (200 mg, 125 %) (AV) = 0.47 g).
Тable 5. Added content of reference standard Valsartan
in model mixtures.
N: V120 [mg] Added Weighed V120 [g] V160 [mg] Added Weighed V160 [g] V200 [mg] Added Weighed V200 [g]
99.98 % ethanol
1. 119.4 0.2786 159.6 0.3791 199.5 0.4688 2. 120.1 0.2802 160.2 0.3805 200.3 0.4707 3. 120.8 0.2819 160.8 0.3819 200.7 0.4716
Methanol
1. 119.49 0.2788 159.07 0.3778 199.79 0.4695 2. 120.3 0.2807 160.42 0.3810 200.21 0.4705 3. 120.6 0.2814 160.51 0.3812 200.68 0.4716
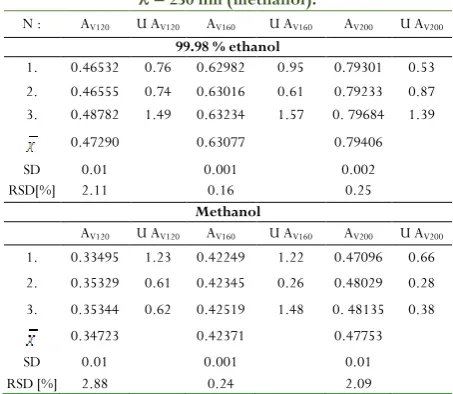
On Тable 6. are included the results for absorbances in 99.98 % ethanol: AV120 (Ast = 0.46730); AV160 (Ast = 0.63997); AV200
(Ast = 0.79050) and methanol: AV120 (Ast = 0.35248); AV160
(Ast = 0.42844); AV200 (A st = 0.47955) and Chauvenet’s
criterion for absorbances: U.
Тable 6. Absorbances for model mixtures with reference
standard Valsartan at = 252 nm (99.98 % ethanol) and
= 250 nm (methanol).
N : AV120 U AV120 AV160 U AV160 AV200 U AV200
99.98 % ethanol
1. 0.46532 0.76 0.62982 0.95 0.79301 0.53 2. 0.46555 0.74 0.63016 0.61 0.79233 0.87 3. 0.48782 1.49 0.63234 1.57 0. 79684 1.39
0.47290 0.63077 0.79406
SD 0.01 0.001 0.002
RSD[%] 2.11 0.16 0.25
Methanol
AV120 U AV120 AV160 U AV160 AV200 U AV200
1. 0.33495 1.23 0.42249 1.22 0.47096 0.66 2. 0.35329 0.61 0.42345 0.26 0.48029 0.28 3. 0.35344 0.62 0.42519 1.48 0. 48135 0.38
0.34723 0.42371 0.47753
SD 0.01 0.001 0.01
RSD [%] 2.88 0.24 2.09
Results for the estimation of accuracy for mixtures with Valsartan are presented on Table 7. (99.98 % ethanol) and Table 8. (methanol), where: С– obtained content of Valsartan by method of external standard; R – degree of recovery [%]; U
– Chauvenet’s criterion for the quantities of Valsartan; N –
number of individual measurements (1 3); – mean arithmetic error; S – mean square error; E (%) – relative error; P –
confidence possibility: 95 %, t – coefficient of Student: 2.57.
Table 7. Content of Valsartan in model mixtures in 99.98 % ethanol.
N: СV120
[mg] R СV120
[%] U
СV120 СV160
[mg] R СV160
[%] U
СV160 СV200
[mg] R СV200
[%] U
СV200
1. 120.09 100.58 0.46 157.84 98.9 1.13 201.15 100.83 0.79
2. 119.47 99.48 0.69 157.34 98.21 0.53 200.16 99.93 1.12
Journal of Advanced Pharmacy Education & Research | Jul-Sep 2018 | Vol 8 | Issue3 41 ___
X
SD 121.33
2.7
157.5
0.3
200.74
0.52
[%] RSD[%]
101.0
1.78
98.31
0.55
100.29
0.48
SD 2.7 1.8 0.3 0.54 0.52 0.48
RSD [%] 2.23 1.78 0.19 0.55 0.26 0.48
S___X 1.56 1.04 0.17 0.31 0.3 0.28
P [%] 95.0 95.0 95.0 95.0 95.0 95.0
t 2.57 2.57 2.57 2.57 2.57 2.57
t. S___X 4.01 2.67 0.44 0.8 0.77 0.72
___
X–t.S___X
___
X+t.S___X
117.32 125.34 98.35 103.69 157.06 157.94 97.51 99.11 199.97 201.51 99.5 101.01
Е [%] 1.03 0.11 0.32 0.15 0.28
Table 8. Content of Valsartan in model mixtures in methanol.
N: СV120
[mg] R СV120
[%] U
СV120 СV160
[mg] R СV160
[%] U
СV160 СV200
[mg] R СV200
[%] U
СV200
1. 114.52 95.84 1.16 158.7 99.77 0.94 196.63 98.42 1.16
2. 119.98 99.73 0.62 157.72 98.32 1.06 200.1 99.95 0.59
3. 119.73 99.28 0.54 158.29 98.62 0.1 200.07 99.7 0.57
___
X
SD 118.08
3.08
158.24
0.49
198.93
1.99
[%] RSD[%] 98.28 2.17 98.9 0.78 99.36 0.83
SD 3.08 2.13 0.49 0.77 1.99 0.82
RSD [%] 2.61 2.17 0.31 0.78 1.0 0.83
S___X 1.78 1.23 0.28 0.45 1.15 0.47
P [%] 95.0 95.0 95.0 95.0 95.0 95.0
t 2.57 2.57 2.57 2.57 2.57 2.57
t. S___X 4.57 3.16 0.72 1.16 2.96 1.21
___
X–t.S___X
___
X+t.S___X 113.51 122.65 95.12 101.44 157.52 158.90 97.74 100.06 195.97 201.89 98.15 100.57
Е [%] 1.51 1.25 0.18 0.46 0.58 0.47
Accuracy is represented by the degree of recovery R [%] RSD [%}.as per ICH guidelines. [13-15] Results show that at the used
confidence possibility all data for R suit respective interval.
Data for Chauvenet’s criterion are lower than maximum
permissible value (U = 1.68; N = 3), which is applied for the assessment of the need for the removal of sharply different results.
5) Precision (repeatability)
Repeatability is characterized by the uncertainty of the result, which includes standard deviation (SD), relative standard deviation (RSD) and confidential interval ___X t.S
___
X).[13-16] At the corresponding confidence possibility, all results for the
obtained quantities of Valsartan suit the appropriate confidence interval.
Conclusion
UV-spectrophotometric method for determination of Valsartan in 99.98 % ethanol and in methanol by method of external standard was validated for analytical parameters: selectivity, linearity, LOD, LOQ, accuracy and precision. Results fot accuracy and repeatability suit respective confidence intervals. The validated method can be applied for the determination of Valsartan in dosage drug preparations.
Conflicts Of Interests
All authors have none to declare.References:
1. Pangarkar P.A., Thenge R.R., Mahajan N.M., Adhao V.S., Ajmire P.V. Crystal modification of Irbesartan in presence of additive. J. Adv. Pharm. Edu. Res. 2014; 4(1): 106-113.
2. Yunoos M., Rayalla A., Raju B., Venkateswarlu G. Stability indicating RP-HPLC method for the simultaneous estimation of Olmesartan Medoxomil and Atorvastatin calcium in bulk and tablet dosage form. J. Adv. Pharm. Edu. Res. 2014; 4(3): 372-379.
3. Hadi N.R., Raheem H.T., Kareem K.J., Kadhim K.A., Taher A. Valsartan modulates the inflammatory response and apoptosis and protects from cerebral ischemia reperfusion injury. J. Adv. Pharm. Edu. Res. 2015; 5(1): 1-14.
4. Asati A., Shinde A., Malik S., Asati K.C. Quantitative analysis method development and validation for Irbesartan in bulk drug by ultraviolet spectroscopy. J. Adv. Pharm. Edu. Res. 2014; 4(1): 101-105.
5. Kumar V.P.S., Sahu M., Prasad K.D., Shekhar M.C. Development and validation of analytical method for the estimation of Valsartan in pure and tablet dosage form by RP-HPLC method. Int. J. Res. Pharm. Chem. 2011; 1(4): 945-949.
6. Nataraj K.S., Charya S.V.R., Goud E.S., Saigeethika S., Ramanjineyulu K. Simple quantitative method development and validation of Valsartan in pure form and pharmaceutical dosageform by UV-spectroscopy. Int. J. Pharm. Bio. Sci. 2011; 1(2): 67-73.
7. Patro S.K., Kanungo S.K., Patro V.J., Choudhury N.S.K. Stability indicating RP-HPLC method for determination of Valsartan in pure and pharmaceutical formulation. E.-J. Chem. 2010; 7(1): 246-252.
42 Journal of Advanced Pharmacy Education & Research | Jul-Sep 2018 | Vol 8 | Issue3
9. Tatar S., Serap S. Comparison of UV- and second derivative-spectrophotometric and LC methods for the determination of Valsartan in pharmaceutical formulation. J. Pharm. Biomed. Anal. 2002; 30(2): 371-375.
10. Satana E., Altınay S., Göer N.G., Özkan S.A., Sentürk Z. Simultaneous determination of Valsartan and Hydrochlorothiazide in tablets by first-derivative ultraviolet spectrophotometry and LC. J. Pharm. Biomed. Anal. 2001; 25(5-6): 1009-1013.
11. Kus S., Marczenko Z., Obarski N. Derivative UV-VIS Spectrophotometry in analytical chemistry. Chern. Anal. Warsaw 1996; 41(1): 899-927. 12. Shrivastava A., Gupta V.B. Methods for the
determination of limit of detection and limit of quantitation of the analytical methods. Chron. Young Sci. 2011; 2(1): 21-25.
13. International Conference on Harmonization Topic Q 2 (R1). Validation of Analytical Procedures: Text and Methodology. CPMP/ICH/381/95) European Medicines Agency, 1995.
14. International Conference on Harmonization of Technical Requirement for Registration of Pharmaceuticals for Human use, ICH harmonized tripartite Guideline, Validation of Analytical procedures Text and methodology Q2 (R1), 2005. 15. Gamil A.M. Validation as applied for pharmaceutical
processes. J. Adv. Pharm. Edu. Res. 2015: 5(2): 77-86.