DOI
10.17219/acem/68067
Copyright
© 2017 by Wroclaw Medical University This is an article distributed under the terms of the Creative Commons Attribution Non-Commercial License (http://creativecommons.org/licenses/by-nc-nd/4.0/)
Address for correspondence
Zhenghai Liu
Email: [email protected]
Funding sources
The study was sponsored by the Zhengxiang Scholar Program of the University of South China, the Construct Program of the Key Discipline in Hunan Province, the Scientific Research Fund of Hunan Provincial Education Department (No.14A125), the Planned Science and Technology Project of Heng-yang City(2015KJ19), the Planned Science and Technology Project of Hunan Province (2014FJ6072) and the Natural Science Foundation of Hunan Province (2015JJ6010).
Conflict of interest
None declared
Received on November 8, 2015 Reviewed on July 20, 2016 Accepted on December 22, 2016
Abstract
Background. Gliomas are the most common primary brain tumor in adults. Many studies have revealed associations between the rs4295627 polymorphism in the coiled-coil domain containing 26 (CCDC26) gene and the risk of glioma. However, the conclusions are still unclear because some studies have reported in-consistent results.
Objectives. The aim of the present meta-analysis was to determine the relationship and quantitatively evaluate the effect of the rs4295627 polymorphism on the risk of glioma.
Material and methods. Data was extracted from PubMed, EMBASE and Google Scholar, with the most recent search up to December, 2015. Odds ratios (OR) and their 95% CIs were used to evaluate the effect of CCDC26 rs4295627 polymorphisms on glioma. A test of heterogeneity and an assessment of publication bias were also performed.
Results. A total of 11 studies (8292 cases and 12,419 controls) were selected for this meta-analysis. Sig-nificant associations were observed in all genetic analysis models (G vs T: OR = 1.26, 95% CI = 1.12–1.43; GG vs TT: OR = 1.72, 95% CI = 1.24–2.39; GT vs TT: OR = 1.33, 95% CI = 1.24–1.42; GG + GT vs TT: OR = 1.36, 95% CI = 1.20–1.53; GG vs GT + TT: OR = 1.65, 95% CI = 1.18–2.29, respectively).
Conclusions. The results of the present study clearly show that the G allele of the rs4295627 polymor-phism significantly increases the risk of glioma. Nevertheless, well-designed large-scale studies are needed to further evaluate the effect of the rs4295627 polymorphism on different types or degrees of glioma in dif-ferent ethnic groups as well as to measure the combined effects on glioma risk.
Key words: meta-analysis, glioma, rs4295627, CCDC26.
CCDC26 rs4295627 polymorphisms associated with
an increased risk of glioma: A meta-analysis
Jie Zeng
1, A–D, Yueji Luo
1, B–D, Min Yu
2, C–F, Jianming Li
1, B, C, Zhenghai Liu
3, A, B, E, F1 Department of Anatomy, Histology and Embryology, Changsha Medical University, China 2 Department of Pharmacy, Chenzhou No.1 People's Hospital, China
3 Institute of CIinical Anatomy and Reproductive Medicine, University of South China, Hengyang, China
A – research concept and design; B – collection and/or assembly of data; C – data analysis and interpretation; D – writing the article; E – critical revision of the article; F – final approval of the article
Gliomas are the most common primary brain tumors that occur mainly in adults. They include astrocytic, oli-godendroglial, oligoastrocytic, ependymal and choroid plexus, and other neuroepithelial tumors.1–3 Gliomas account for about 80% of all primary malignant brain tumors, with an incidence of 5–10 cases per 100,000.3,4 Despite advances in neurosurgery and chemotherapy, the prognosis for most glioma patients remains dismal.5,6 Prevention of glioma progression has therefore become an important strategy for fighting against the disease.
The etiology of gliomas is still not well understood. Pre-vious studies have reported that some genetic loci, such as 5p15.33 (rs2736100, TERT) and 8q24.21 (rs4295627, CCDC26) , may be associated with the risk of glioma.7,8
The coiled-coil domain containing 26 (CCDC26) gene encodes a retinoic acid modulator of cell differentiation and death.9 Retinoid acid induces caspase-8 transcrip-tion through phosphorylatranscrip-tion of cAMP response ele-ment-binding, and increases apoptosis induced by death stimuli in neuroblastoma cells and in glioblastoma cells by downregulation of telomerase activity.10,11 Ge-netic variants of CCDC26 are associated with a number of common tumors, including glioma.7,8,12,13
The SNP rs4295627 maps to intron 3 of the CCDC26 gene. Several studies have been published exploring the re-lationship between the rs4295627 polymorphism and the risk of glioma.7,8 However, the results of those stud-ies are inconsistent.14–16 Therefore, the aim of the present study was to investigate the effect of CCDC26 rs4295627 polymorphism on the risk of glioma by summarizing it quantitatively, using a meta-analysis approach.
Material and methods
Data sources
A comprehensive search was performed for available ar-ticles published in English, using the databases of PubMed, EMBASE and Google Scholar up to December 2015, and by hand-searching the reference lists of the computer-re-trieved articles. The literature search was conducted using the following terms: “glioma”, “gliomas” or “glioblastoma”; “rs4295627”, “CCDC26” or “coiled-coil domain contain-ing 26”; and “polymorphism”, “genotype” or “mutation”. The search was limited to human studies and references from the retrieved publications were checked to find ad-ditional articles on the topic.
Inclusion and exclusion criteria
All relevant studies reporting the association between the rs4295627 polymorphism and glioma risk were considered for inclusion. The inclusion criteria were as follows: (1) use of a case-control or cohort design; (2) the exposure of interest was rs4295627 polymorphism;
(3) the outcome of interest was glioma; (4) sufficient raw data for evaluating odds ratios (OR) and their 95% confi-dence interval (CI); or, if the raw data was not available, the OR and 95% CI for specific genetic models were in-cluded. The following exclusion criteria were also used: (1) articles only having an abstract, review articles and comments; (2) studies overlapping with other studies.
Data extraction
Two authors independently reviewed all the articles and extracted data in separate databases. Conflicts were resolved by discussion and consensus. The following information was extracted from each study: the name of the 1st author, the year of publication, ethnicity, the number of cases and controls, the sources of the con-trols, the genotyping method, and either the raw data on genotype frequency or ORs with corresponding 95% CIs for specific genetic models.
Statistical analysis
Comprehensive meta-analysis software (v. 2; Biostat Inc., Englewood, USA) was used for all the statistical analyses.17 The pooled odds ratios (ORs) and 95% confidence intervals (CIs) were taken to calculate the effects of the CCDC26 rs4295627 polymorphism on the risk of glioma. Heteroge-neity between studies was estimated by the I2 test and hete- rogeneity Q statistic test. P-value < 0.10 and I2 > 50% were considered the level of statistical significance. The ran-dom-effects model was used for pooled effects; otherwise, the fixed-effects model was chosen for analysis since hete- rogeneity was not obvious. The genetic models assessed for the pooled ORs of the polymorphism were the addi-tive model (G vs T), dominant model (GG + GT vs TT), recessive model (GG vs GT + TT), homozygote compari-son (GG vs TT) and heterozygote comparicompari-son (GT vs TT). Subgroup analyses by ethnicity (American Caucasians, European Caucasians and Asian Han) were also conduct-ed to further explore the details of CCDC26 rs4295627 polymorphisms and the risk of glioma. In addition, pos-sible publication biases were investigated using the fun-nel plot and Begg’s linear regression test. For Egger’s tests, p-values < 0.1 suggest significant publication bias.17
Results
Study characteristics
owing to insufficient data after reviewing the full text. Out of the 10 candidate studies,7,8,14–16,18–22 4 arti-cles16,18–20 and part of the data in 1 article21 were rejected because of repeated or overlapping data. Finally, 6 arti-cles7,8,14,15,21,22 with 15 studies about rs4295627 polymor-phisms and glioma risk, involving 8292 glioma cases and 12,419 controls, were used in this meta-analysis.
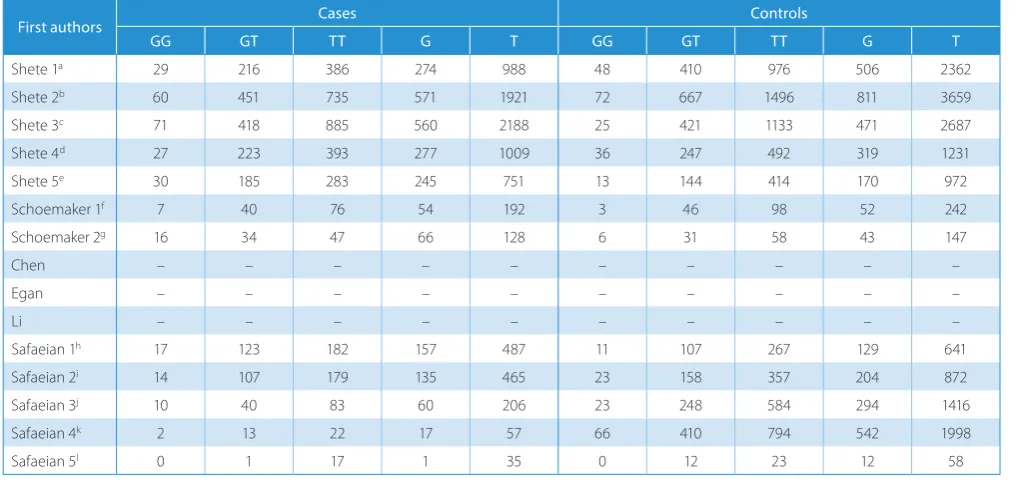
The main information from the 15 studies is summa-rized in Table 1. Six of the selected studies were carried out in Europe, 7 in the USA and 2 in China. The num-ber of cases in these studies varied substantially (rang-ing from 18 to 1374 individuals). Twelve of the 15 stud-ies provided detailed raw genotype data for calculating the ORs and 95% CIs (Table 2), the other 3 studies pro-vided the ORs and 95% CIs for specific genetic models.
Quantitative synthesis
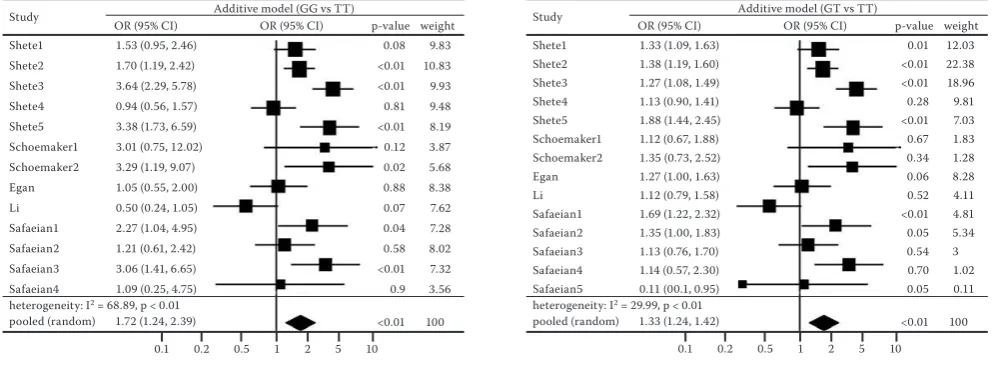
The results of this meta-analysis are presented in Fig. 1–3. Significant associations were observed in all the pooled analyses of the 5 genetic models. Overall ORs were all greater than 1, varying from 1.26 to 1.72 (G vs T: OR = 1.26, 95% CI = 1.12–1.43, Fig. 1; GG vs TT: OR = 1.72, 95% CI = 1.24–2.39, Fig. 2 left; GT vs TT: OR = 1.33, 95% CI = 1.24–1.42, Fig. 2 right; GG + GT vs TT: OR = 1.36, 95% CI = 1.20–1.53, Fig. 3 left; GG vs GT + TT: OR = 1.65, 95% CI = 1.18–2.29, Fig. 3 right). Between-study heterogeneity was found in most of the 5 genetic models. Accordingly, the fixed-effects model was used only in heterozygote
Table 1. Characteristics of the studies included in the meta-analysis
First authors Years Countries Ethnicity numberCase numberControl
Shete 1a 2009 England Caucasian 631 1434
Shete 2b 2009 USA Caucasian 1246 2235 Shete 3c 2009 France Caucasian 1374 1579 Shete 4d 2009 Sweden Caucasian 643 775
Shete 5e 2009 Germany Caucasian 498 571 Schoemaker 1f 2010 Denmark Caucasian 123 147
Schoemaker 2g 2010 Finland Caucasian 97 95 Chen 2011 China Asian 976 1057 Egan 2011 USA Caucasian 639 649
Li 2012 China Asian 226 254
Safaeian 1h 2013 USA Caucasian 322 385
Safaeian 2i 2013 USA Caucasian 300 538 Safaeian 3j 2013 USA Caucasian 133 855 Safaeian 4k 2013 USA Caucasian 37 1270
Safaeian 5l 2013 USA Caucasian 18 35
a – UK population; b – US population; c – French population; d – Swedish population; e – German population; f – Danish population; g –Finnish population; h – National Cancer Institute glioma case-control study; i – National Institute of Occupational Safety and Health glioma case-control study; j – glioma cases and case-controls identified from the Prostate, Lung, Colorectal and Ovarian Cancer Screening Trial; k – glioma cases and controls identified from the Alpha-Tocopherol, Beta-Carotene Cancer Prevention Study; l – glioma cases and controls identified from the Agricultural Health Study.
Table 2. Genotype distribution among glioma patients and controls
First authors Cases Controls
GG GT TT G T GG GT TT G T
Shete 1a 29 216 386 274 988 48 410 976 506 2362
Shete 2b 60 451 735 571 1921 72 667 1496 811 3659
Shete 3c 71 418 885 560 2188 25 421 1133 471 2687
Shete 4d 27 223 393 277 1009 36 247 492 319 1231
Shete 5e 30 185 283 245 751 13 144 414 170 972
Schoemaker 1f 7 40 76 54 192 3 46 98 52 242
Schoemaker 2g 16 34 47 66 128 6 31 58 43 147
Chen – – – – – – – – – –
Egan – – – – – – – – – –
Li – – – – – – – – – –
Safaeian 1h 17 123 182 157 487 11 107 267 129 641
Safaeian 2i 14 107 179 135 465 23 158 357 204 872
Safaeian 3j 10 40 83 60 206 23 248 584 294 1416
Safaeian 4k 2 13 22 17 57 66 410 794 542 1998
Safaeian 5l 0 1 17 1 35 0 12 23 12 58
comparison (GT vs TT). For the other genetic models, the random-effects model was utilized in the meta-analy-sis, since heterogeneity was significant.
Fig. 1. Forest plots of meta-analyses for additive model (G vs T)
Fig. 2. Forest plots of meta-analyses for homozygote comparison (GG vs TT) and heterozygote comparison (GT vs TT)
Fig. 3. Forest plots of meta-analyses for dominant model (GG + GT vs TT) and recessive model (GG vs GT + TT)
The results of the subgroup analyses are presented in Table 3. Racial differences were found among the sub-groups of ethnicity. A significant association was discov-eredbetween the rs4295627 polymorphisms and the risk of glioma in the American Caucasians, and between-study heterogeneity was no longer significant in this group. The Han Chinese population showed no significant as-sociation between the rs4295627 polymorphisms and the risk of glioma; however, the small number of studies included for analysis may lack sufficient power to draw accurate conclusions. European Caucasians showed the highest effect size compared with the other samples.
Publication bias
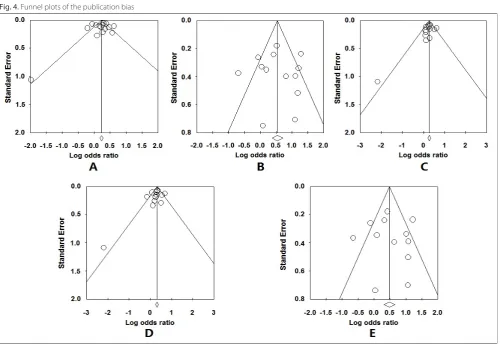
The funnel plots (Fig. 4) of all 5 genetic models were roughly symmetric and suggested no publication bias. Egger’s test also showed no significant evidence of pub-lication bias (p = 0.74 for G vs T; p = 0.97 for GG vs TT; p = 0.23 for GT vs TT; p = 0.30 for GG + GT vs TT; and p = 0.87 for GG vs GT + TT).
Shete1 Shete2 Shete3 Shete4 Shete5 Schoemaker1 Schoemaker2 Chen Egan Li Safaeian1 Safaeian2 Safaeian3 Safaeian4 Safaeian5
Study Additive model (G vs T)
heterogeneity: I2 = 75.87, p < 0.01
pooled (random) 1.26 (1.12, 1.43)
OR (95% CI)
OR (95% CI) p-value weight
1.29 (1.10, 1.53) 1.34 (1.19, 1.51) 1.46 (1.28, 1.67) 1.06 (0.88, 1.27) 1.87 (1.50, 2.32) 1.31 (0.86, 2.00) 1.76 (1.12, 2.77) 0.94 (0.82, 1.09) 1.18 (0.96, 1.45) 0.81 (0.61, 1.08) 1.60 (1.23, 2.08) 1.24 (0.97, 1.59) 1.40 (1.03, 1.92) 1.10 (0.63, 1.91) 0.14 (0.02, 1.11)
<0.01 <0.01 <0.01 0.53 <0.01 0.21 0.01 0.39 0.12 0.15 <0.01 0.08 0.03 0.74 0.06 <0.01 0.1 0.2 0.5 1 2 5 10
100 8.71 9.42 9.2 8.42 7.78 4.55 4.25 9.08 7.98 6.58 7 7.29 6.12 3.3 0.33 Shete1 Shete2 Shete3 Shete4 Shete5 Schoemaker1 Schoemaker2 Egan Li Safaeian1 Safaeian2 Safaeian3 Safaeian4 Shete1 Shete2 Shete3 Shete4 Shete5 Schoemaker1 Schoemaker2 Li Safaeian1 Safaeian2 Safaeian3 Safaeian4 Safaeian5 Study Study
Additive model (GG vs TT)
Additive model (GG + GT vs TT) heterogeneity: I2 = 68.89, p < 0.01
pooled (random) 1.72 (1.24, 2.39)
heterogeneity: I2 = 56.49, p < 0.01
pooled (random) 1.36 (0.01, 0.95)
OR (95% CI)
OR (95% CI) OR (95% CI)
OR (95% CI)
p-value
p-value weight
weight 1.53 (0.95, 2.46)
1.70 (1.19, 2.42) 3.64 (2.29, 5.78) 0.94 (0.56, 1.57) 3.38 (1.73, 6.59) 3.01 (0.75, 12.02) 3.29 (1.19, 9.07) 1.05 (0.55, 2.00) 0.50 (0.24, 1.05) 2.27 (1.04, 4.95) 1.21 (0.61, 2.42) 3.06 (1.41, 6.65) 1.09 (0.25, 4.75)
1.35 (1.11, 1.64) 1.41 (1.22, 1.62) 1.40 (1.20, 1.64) 1.11 (0.89, 1.37) 2.00 (1.55, 2.59) 1.24 (0.75, 2.04) 1.67 (0.94, 2.96) 0.86 (0.60, 1.23) 1.74 (1.28, 2.37) 1.33 (1.00, 1.79) 1.30 (0.89, 1.90) 1.14 (0.58, 2.21) 0.11 (0.01, 0.95)
0.08 <0.01 <0.01 0.81 <0.01 0.12 0.02 0.88 0.07 0.04 0.58 <0.01 0.9 <0.01 <0.01 <0.01 0.36 <0.01 0.40 0.08 0.41 <0.01 0.05 0.18 0.70 0.05 <0.01 <0.01 0.1 0.2 0.5 1 2 5 10
0.1 0.2 0.5 1 2 5 10 100 100 9.83 10.83 9.93 9.48 8.19 3.87 5.68 8.38 7.62 7.28 8.02 7.32 3.56 11.68 13.51 13.07 10.96 9.65 4.43 3.60 6.86 8.09 8.56 6.43 2.83 0.33 Shete1 Shete2 Shete3 Shete4 Shete5 Schoemaker1 Schoemaker2 Egan Li Safaeian1 Safaeian2 Safaeian3 Safaeian4 Safaeian5 Shete1 Shete2 Shete3 Shete4 Shete5 Schoemaker1 Schoemaker2 Li Safaeian1 Safaeian2 Safaeian3 Safaeian4 Study Study
Additive model (GT vs TT)
Additive model (GG vs GT + TT) heterogeneity: I2 = 29.99, p < 0.01
pooled (random) 1.33 (1.24, 1.42)
heterogeneity: I2 = 29.99, p < 0.01
pooled (random) 1.33 (1.24, 1.42)
OR (95% CI)
OR (95% CI) OR (95% CI)
OR (95% CI)
p-value
p-value weight
weight 1.33 (1.09, 1.63)
1.38 (1.19, 1.60) 1.27 (1.08, 1.49) 1.13 (0.90, 1.41) 1.88 (1.44, 2.45) 1.12 (0.67, 1.88) 1.35 (0.73, 2.52) 1.27 (1.00, 1.63) 1.12 (0.79, 1.58) 1.69 (1.22, 2.32) 1.35 (1.00, 1.83) 1.13 (0.76, 1.70) 1.14 (0.57, 2.30) 0.11 (00.1, 0.95)
1.39 (0.87, 2.23) 1.52 (1.07, 2.16) 3.39 (2.13, 5.37) 0.90 (0.54, 1.50) 2.75 (1.42, 5.34) 2.90 (0.73, 11.45) 2.93 (1.09, 7.85) 0.52 (0.25, 1.05) 1.09 (0.87, 4.11) 1.10 (0.56, 2.16) 2.94 (1.37, 6.33) 1.04 (0.25, 4.43)
0.01 <0.01 <0.01 0.28 <0.01 0.67 0.34 0.06 0.52 <0.01 0.05 0.54 0.70 0.05 0.17 0.02 <0.01 0.68 <0.01 0.13 0.03 0.07 0.11 0.79 0.01 0.96 <0.01 <0.01 0.1 0.2 0.5 1 2 5 10
Fig. 4. Funnel plots of the publication bias
A – additive model (G vs T); B – homozygote comparison (GG vs TT); C – heterozygote comparison (GT vs TT); D – dominant model (GG + GT vs TT); E – recessive model (GG vs GT + TT).
Table 3. Summary of subgroup analyses for the CCDC26 rs4295627 polymorphism and the risk of glioma
Genetic
model Ethnicity of studyNo.
Pooled effect size Heterogeneity
OR 95% CI p-value I2 p-value
G vs T
all 15 1.26 1.12–1.43 <0.01 75.87 <0.01
Caucasians (USA) 7 1.32 1.21–1.44 <0.01 30.55 0.2
Caucasians (Eur.) 6 1.41 1.19–1.67 <0.01 72.2 <0.01
Han (Asian) 2 0.91 0.80–1.04 0.16 <0.01 0.36
GG vs TT
all 13 1.72 1.24–2.39 <0.01 68.89 <0.01
Caucasians (USA) 6 1.63 1.28–2.09 <0.01 17.01 0.3
Caucasians (Eur.) 6 2.23 1.32–3.77 <0.01 74.19 <0.01
Han (Asian) 1 0.5 0.24–1.05 0.06 – –
GT vs TT
all 14 1.33 1.24–1.42 <0.01 29.99 0.14
Caucasians (USA) 7 1.35 1.22–1.50 <0.01 27.41 0.22
Caucasians (Eur.) 6 1.32 1.20–1.46 <0.01 46.02 0.1
Han (Asian) 1 1.12 0.79–1.58 0.78 – –
GG + GT vs TT
all 13 1.36 1.20–1.53 <0.01 56.49 <0.01
Caucasians (USA) 6 1.41 1.26–1.57 <0.01 36.53 0.16
Caucasians (Eur.) 6 1.41 1.20–1.68 <0.01 61.15 0.03
Han (Asian) 1 0.86 0.60–1.23 0.41 – –
GG vs GT + TT
all 12 1.65 1.18–2.29 <0.01 67.37 <0.01
Caucasians (USA) 5 1.59 1.22–2.07 <0.01 5.08 0.38
Caucasians (Eur.) 6 2.02 1.22–3.35 <0.01 72.61 <0.01
Discussion
The present meta-analysis used the data from 15 case-control studies (with a total of over 20,000 participants) to evaluate the effect of the CCDC26 rs4295627 polymor-phisms on the risk of glioma. The pooled results for differ-ent genetic models were all significant, which indicated that a person who carries the G allele of rs4295627 polymor-phisms has an increased likelihood of glioma. Individuals with the homozygous variant have the highest risk of glio-ma (OR = 1.72), and the effect size of the recessive genetic model is higher than that of the dominant model (OR = 1.65 vs OR = 1.36, adjusted for heterogeneity). Different ethnici-ties have different frequencies of alleles; therefore, subgroup analyses according to ethnicity were performed to decrease biases. The subgroup analyses showed that the rs4295627 polymorphism in the CCDC26 gene increased the risk of glioma in Caucasians, but similar associations are not observed in Han Chinese individuals. However, since only 2 studies involved Asian samples, the results may have insuf-ficient power to reveal a reliable association. More studies are needed to confirm the results for the Chinese population.
Gliomas are the most common adults tumors of the cen-tral brain, and have high mortality and morbidity.3 A bet-ter understanding of the mechanism of gliomas will con-tribute to finding better ways to prevent, diagnose and treat them. Confirmation of genetic biomarkers could help in making early diagnosis, predicting patient out-comes or carrying out personalized therapy. However, previously published articles have found that many gene variations may be associated with the risk of glioma, such as CCDC26 gene mutations. The CCDC26 gene plays an important role in cell differentiation and apoptosis. CCDC26 gene mutations are present in most glioma sam-ples, but are absent in normal brain tissues. Theoretically, CCDC26 gene mutations may change the intrinsic regu-latory mechanism in organisms and thus increase the oc-currence of glioma. This study showed that mutations of the G allele of the rs4295627 polymorphism, located in intron 3 of the CCDC26 gene, increases the risk of gli-oma, which is consistent with the theoretical assumption.
Between-study heterogeneity is common in meta-analy- ses, and exploring potential sources of heterogeneity is an essential component of any meta-analysis.23 Evidence of heterogeneity was observed in most of the genetic mod-els for this meta-analysis. In fact, the effect size of the rs2736100 polymorphism on glioma risk varied greatly in the 15 studies included. Although most of the studies found that mutations of the rs2736100 polymorphism may increase the risk of glioma, some studies reported incon-sistent results. The between-study heterogeneity found in the meta-analysis may have several potential causes. The most likely sources of heterogeneity are the lack of a standardized classification for the different types or severity of glioma. Rs4295627 polymorphism has been proved to be strongly associated with oligodendro-
glial tumor risk, but not glioblastoma risk.24 Differences in the participants’ characteristics, including differences in age and ethnicity, are another potential source of hetero-geneity. Other possible sources of the observed heteroge-neity, such as false-positive or false-negative associations, may result from survival bias and recall errors involved in cross-sectional studies.25,26 The present study included subgroup analyses by ethnicity and found that ethnicity may be one of the sources of heterogeneity. However, since most of the 15 studies lacked data for other factors (re-search design, interventions and outcome measures), this hypothesis is still speculative and needs further testing.
The present study has some limitations that should be acknowledged. First, precise information about the type of glioma and the participants’ details were absent from most of the 15 studies included. No relevant published or unpublished studies with null results was identified, which may bias the results of the present meta-analysis. Ideally, to avoid bias, the effect size should be adjusted for all factors known to contribute to glioma. However, because some of the studies used in the current meta-analysis did not include all the relevant data, the crude effect size was calculated using only tabular data. Sec-ond, although a meta-analysis is a good method of ob-taining a large sample size and increasing statistical power, the heterogeneity bias may bring in some “noise”. A random-effects model may minimize the influence of heterogeneity by assuming that different studies show substantial diversity and assessing both within-study sampling error and between-study variance. However, the influence of heterogeneity in the present analysis should be noted.
Despite these limitations, this study has a large sample size and sufficient statistical power to estimate the effect of the rs2736100 polymorphism on the risk of glioma. In contrast, a small sample size (<100 cases and controls) can overestimate a true association due to deficiencies in statistical power. In addition, although the number of studies included in this meta-analysis was small, no evidence of publication bias was found.
In conclusion, this meta-analysis confirms that the CCDC26 rs4295627 polymorphism contributes to indi-vidual susceptibility to glioma, and provides a more accu-rate estimate of the effect of the rs4295627 polymorphism on the risk of glioma. Because of the previously mentioned limitations of this meta-analysis, further studies are nec-essary to resolve the existing controversies over the effect of the rs4295627 polymorphism on the risk of glioma.
References
1. Ricard D, Idbaih A, Ducray F, Lahutte M, Hoang-Xuan K, Delattre JY. Primary brain tumours in adults. Lancet. 2012;379:1984–1996. 2. Wen PY, Kesari S. Malignant gliomas in adults. N Engl J Med.
2008;359:492–507.
4. Kohler BA, Ward E, McCarthy BJ, et al. Annual report to the nation on the status of cancer, 1975–2007, featuring tumors of the brain and other nervous system. J Natl Cancer Inst. 2011;103:714–736. 5. McNamara S. Treatment of primary brain tumours in adults.
Nurs-ing Standard. 2012;27:42–47.
6. Nazarenko I, Hede SM, He X, et al. Pdgf and pdgf receptors
in glio-ma. Ups J Med Sci. 2012;117:99–112.
7. Shete S, Hosking FJ, Robertson LB, et al. Genome-wide associa-tion study identifies five susceptibility loci for glioma. Nat Gen. 2009;41:899–904.
8. Safaeian M, Rajaraman P, Hartge P, et al. Joint effects between five identified risk variants, allergy, and autoimmune conditions on gli-oma risk. Cancer Causes Control. 2013;24:1885–1891.
9. Yin W, Rossin A, CIifford JL, Gronemeyer H. Co-resistance to reti-noic acid and trail by insertion mutagenesis into ram. Oncogene. 2006;25:3735–3744.
10. Das A, Banik NL, Ray SK. Differentiation decreased telomerase activity in rat glioblastoma c6 cells and increased sensitivity to ifn-gamma and taxol for apoptosis. Neurochem Res. 2007;32:2167–2183. 11. Jiang M, Zhu K, Grenet J, Lahti JM. Retinoic acid induces caspase-8
transcription via phospho-creb and increases apoptotic respons-es to death stimuli in neuroblastoma cells. Biochim Biophys Acta. 2008;1783:1055–1067.
12. Easton DF, Pooley KA, Dunning AM, et al. Genome-wide associa-tion study identifies novel breast cancer susceptibility loci. Nature. 2007;447:1087–1093.
13. Kiemeney LA, Thorlacius S, Sulem P, et al. Sequence variant on 8q24 confers susceptibility to urinary bladder cancer. Nat Genet. 2008;40:1307–1312.
14. Chen H, Chen Y, Zhao Y, et al. Association of sequence variants on chromosomes 20, 11, and 5 (20q13.33, 11q23.3, and 5p15.33) with glioma susceptibility in a Chinese population. Epidemiol Rev. 2011;173:915–922.
15. Egan KM, Thompson RC, Nabors LB, et al. Cancer susceptibility vari-ants and the risk of adult glioma in a US case-control study. J
Neu-rooncol. 2011;104:535–542.
16. Wei XB, Jin TB, Li G, et al. Ccdc26 gene polymorphism and glio-blastoma risk in the Han Chinese population. Asian Pacific Journal
of Cancer Prevention (APJCP). 2014;15:3629–3633.
17. Sun L, Tan L, Yang F, et al. Meta-analysis suggests that smoking is associated with an increased risk of early natural menopause.
Menopause. 2012;19:126–132.
18. Di Stefano AL, Enciso-Mora V, Marie Y, et al. Association between glioma susceptibility loci and tumour pathology defines specific molecular etiologies. Neuro-Oncology. 2013;15:542–547.
19. Melin B, Dahlin AM, Andersson U, et al. Known glioma risk loci are associated with glioma with a family history of brain tumours: A case-control gene association study. Int J Cancer. 2013;132:2464–2468. 20. Wang SS, Hartge P, Yeager M, et al. Joint associations between
genetic variants and reproductive factors in glioma risk among women. Epidemiol Rev. 2011;174:901–908.
21. Schoemaker MJ, Robertson L, Wigertz A, et al. Interaction between 5 genetic variants and allergy in glioma risk. Epidemiol Rev. 2010;171:1165–1173.
22. Li S, Jin T, Zhang J, et al. Polymorphisms of treh, il4r and ccdc26 genes associated with risk of glioma. Cancer Epidemiology. 2012;36:283–287.
23. Munafo MR, Flint J. Meta-analysis of genetic association studies.
TIG. 2004;20:439–444.
24. Jenkins RB, Wrensch MR, Johnson D, et al. Distinct germ line poly-morphisms underlie glioma morphologic heterogeneity. Cancer
Genet. 2011;204:13–18.
25. Forsberg BC, van Ginneken JK, Nagelkerke NJ. Cross-sectional household surveys of diarrhoeal diseases: A comparison of data from the control of diarrhoeal diseases and demographic and health surveys programmes. Int J Epidemiol. 1993;22:1137–1145. 26. Giuffra LA, Risch N. Diminished recall and the cohort effect of major