Published by Central Fisheries Research Institute (SUMAE) Trabzon, Turkey in cooperation with Japan International Cooperation Agency (JICA), Japan
R E S E A R C H P A P E R
Exploring Spatio-Temporal Patterns of the Mexican Longline
Tuna Fishery in the Gulf of Mexico: a Comparative Analysis
between Yellowfin and Bluefin Tuna Distribution
Alberto Abad-Uribarren
1, Sofía Ortega-García
1,* , David March
2, Cecilia
Quiroga-Brahms
3, Felipe Galván-Magaña
1, Germán Ponce-Díaz
11Instituto Politécnico Nacional-Centro Interdisciplinario de Ciencias Marinas. Av. Instituto Politécnico Nacional s/n Col. Playa Palo
de Santa Rita CP 23096 La Paz, B.C.S., México
2Sistema d'Observació i Predicció Costaner de les Illes Balears (ICTS SOCIB). Parc Bit, Naorte, Bloc A, 2º piso, porta 3, CP 07122,
Palma de Mallorca, Spain
3INAPESCA-CRIP. Ejército Mexicano 106.Colonia Ex-hacienda Ylang-Ylang C.P. 94298, Boca del Río, Ver., México.
Article History Received 29 August 2018 Accepted 07 February 2019 First Online 14 February 2018
Corresponding Author Tel.: +526121230350
E-mail: [email protected]
Keywords Habitat overlap Fishing effort Catches Bycatch
Abstract
Data from the Mexican longline fishery in the Gulf of Mexico (GoM) between 1994 and 2012 were analyzed to identify the spatio-temporal behavior of fishing effort and catch per unit effort of yellowfin (YFT) and Atlantic bluefin tuna (BFT), focused on habitat overlap. The applied fishing effort showed significant seasonal differences, being greater and spatially concentrated during summer months (May to August), decreasing by around 30% during the winter period (December to April), when its spatial distribution covers a larger area, probably targeting a higher number of species. The spatio-temporal distribution of YFT showed a recurrent pattern throughout the study period, with two relative abundance peaks: one in June, related to a strong aggregation process along the coast of Veracruz, and the other in November, associated with a broader distribution along the Mexican GoM. BFT occurs mainly during the winter, reaching its highest relative abundance in March, at the beginning of the spawning season. A substantial overlap between the distributions of both species was observed, warranting further oceanographic habitat characterization to be supported. The results, consistent with those obtained in U.S. waters, provide the basis for the development of specific management measures to reduce BFT bycatch in the GoM.
Introduction
Mexican longliners that operate in the Gulf of
Mexico (GoM) target primarily yellowfin tuna (Thunnus
albacares) (YFT) with drifting surface longlines 50 km to 75 km long that are set at night with up to 800 baited hooks (Sosa-Nishisaki, Robles, Dreyfus-León, & Ceseña, 2001). Fishing activities take place all year round, and are carried out by a middle-distance fleet, with vessels of 25 m maximum length, 15 t of carrying capacity and 30-day autonomy in the sea (INAPESCA, 2006; Ramírez-López, 2009). The fleet, made up of a variable number of vessels depending on the year (between 15 in the early 1990s and 33 in 2002), operates mainly from three
different ports: Tuxpan and Alvarado, in Veracruz; and Progreso, in Yucatan. The Mexican longline fleet is considered very homogeneous in terms of vessel type, equipment, gear, and fishing maneuvers, so for management purposes the Mexican authorities have considered it as a single category (Sosa-Nishizaki et al.,
2001; DOF, 2015).
1970, and although in recent years it seems that the situation is reversing, the trend does not ensure a recovery of the stock (ICCAT, 2017). Although no direct fishing of this species is currently conducted in this area (Mather, Marson, & Jones, 1995; Ramírez-López, 2009), incidental bycatch of spawners is pointed as a contributing factor to explain the lack of recovery of local stocks (Teo & Block, 2010). Regulations such as gear modifications or Total Allowable Catches (TACs) have provided partial relief; however, ICCAT (2017) has suggested that current regulations may be insufficient to achieve the objectives of the Western Atlantic Bluefin Tuna Rebuilding Program. Spatial and temporal management measures, like dynamic spatial closures based on species preference habitats (Hobday & Hartman, 2006) minimizing bluefin tuna bycatch in the GoM will likely become important in repopulating the western stock (Hobday & Hartmann, 2006; Teo & Block, 2010). The development and implementation of such measures require prior knowledge of the fishery dynamics. An in-depth study of a fishery should involve a parallel analysis of temporal and spatial relationships between fishing effort and catch per unit effort (CPUE). The use of data derived from commercial fisheries, although subject to bias derived from the choice of fishing grounds, contributes low-cost sets of species distribution data with relevant geographical and temporal ranges (Mugo, Saitoh, Nihira, & Kuroyama, 2010). CPUE data have been extensively used in fisheries as valid relative indices of occurrence and relative abundance, especially when no other information is available (Lehodey et al., 1998; Mugo et al., 2010). The present study analyses effort and catch data from the Mexican longline fleet operating in the GoM aiming to outline the spatio-temporal dynamics of the fleet and the distribution of yellowfin and bluefin tuna, focusing
on habitat overlap during the occurrence period of BFT in Mexican waters. This information will contribute to evaluate potential options for bycatch mitigation while supporting a viable fishery.
Materials and Methods
Datasets Used
The Mexican National Fisheries Institute (Instituto Nacional de Pesca, INAPESCA) provided catch and effort data from observer-monitored commercial vessels. This fleet operated within the Mexican Exclusive Economic Zone (MEEZ) (Figure 1). A distinctive feature of these data is that the observer program in the Gulf of Mexico, operated by the National Program for Tuna Exploitation and Dolphin Protection (for further information about
the program, refer to
https://www.fidemar.org/pnaadp), has a 100%
coverage of fishing trips (Solana-Sansores, Nava-Abarca, & González, 2002). The information includes individualized records of all tuna caught during that period, which means that the complete universe of bluefin tuna bycatch in the area was available for the study period. The database, spanning from 1994 to 2012, includes fishing set position (latitude and longitude), date (month and year), number of hooks deployed, and number of fishes caught by species. No other information, such as vessel or set information, was provided due to privacy policies.
Data Analysis
As a first approximation, time series of fishing effort and species CPUE were used for the identification of interannual and seasonal variability patterns.
Nominal CPUE values were used and expressed as number of individuals per 1000 hooks. Although the use of nominal CPUE as a relative abundance index leads to numerous biases (Maunder et al., 2006), the lack of information about the fishing activity did not allow any data standardization. However how was mentioned before this fleet is considered to be very homogeneous (DOF, 2015). In addition, the focus of this work is to understand the spatio-temporal distribution of both species, yellowfin and bluefin tuna, and the fishing effort, which will allow a better interpretation of CPUE data (Kaplan et al., 2014) for further analysis. This should be kept in mind throughout the study when referring to relative abundance to avoid misinterpretations. CPUE
was computed on a monthly basis as 𝐶𝑃𝑈𝐸𝑦,𝑚=
(∑ 𝐶𝑦,𝑚/ ∑ 𝐸𝑦,𝑚) ∗ 1000, where C is total number of
fish caught, and E is total number of hooks deployed by all fishing vessels in month m and year y.
The normality of fishing effort and CPUE data sets was tested using the Shapiro–Wilk test (Razali & Wah, 2011). As the data were not normally distributed some data transformations were tested (McDonald, 2009). Since normality was not achieved, Kruskal–Wallis tests (H) and the Nemenyi test for post-hoc pairwise multiple comparisons were applied to determine significant differences in nominal CPUE and fishing effort by month and year (Zar, 2010). In view of the lack of information regarding the spatio-temporal behavior of the Mexican longline fleet, spatial effort data were analyzed at various time scales to identify potential patterns on the fishing strategy. First, data were screened in order to eliminate outlier positions. Since data were spatially scattered and unevenly distributed, we pooled data on a monthly basis and positions were rounded to a half-degree resolution, given the average length of longline sets. Distribution maps were drawn to explore seasonal and interannual patterns. The coefficient of variation (CV) of the average temporal distribution of fishing effort was mapped to locate areas of different space-use consistency. The analysis outlined above was also conducted to describe the spatio-temporal distribution of both the target and bycatch species. To this end, we used the nominal CPUE per 0.5° quadrants, expressed as:
𝐶𝑃𝑈𝐸𝑦,𝑚,𝑖= (∑ 𝐶𝑦,𝑚,𝑖/ ∑ 𝐸𝑦,𝑚,𝑖) ∗ 1000
where C is total number of fish caught, and E is total number of hooks deployed by all fishing vessels per 0.5º x 0.5º cell (i) in month m and year y.
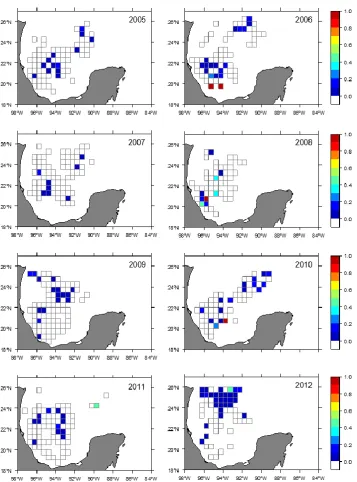
In order to identify the extent of spatial overlap between BFT and YFT, the distribution of monthly BFT bycatch ratio distribution, between 1999 and 2012 was mapped. Bycatch ratio was calculated as:
𝐵𝑅𝑦,𝑚,𝑖= (∑ 𝐵𝐹𝑇𝑦,𝑚,𝑖/ ∑ 𝑌𝐹𝑇𝑦,𝑚,𝑖) 100
where BFT is total number of BFT caught, and YFT
is total number of YFT caught by all fishing vessels per 0.5º x 0.5º cell (i) in month m and year y. Bycatch-to-catch ratio is as a simple and practical indicator to evaluate the relative impact of a fishery on a particular non-target species (Watson, Essington, Lennert-Cody & Hall, 2008). Unlike other fisheries — in which observer bycatch data that represents a small fraction of the total fishing activities is extrapolated to the whole fisheries, thus introducing a considerable bias and uncertainty in bycatch estimates (Amande, Lennert-Cody, Bez, Hall & Chassot, 2010) —, the full coverage of our data ensures the robustness of this indicator. Statistical analysis and graphics were performed using the computing environment R (R Core Team, 2018).
Results
Fishing Effort Dynamics
A total of 46,120 fishing operations, representing a fishing effort slightly above 26 million hooks, were recorded during the period of analysis. The interannual dynamics of fishing effort showed a highly unstable behavior in the first 5 years of the dataset (1994-1998) (Figure 2a), including periods lacking fishing records (Figure 2b). To avoid the use of biased information, only data from 1999 onwards, where the activity can be considered to be relatively homogeneous, were used in all subsequent analyses. The annual average fishing effort ranged from around 125,000 (2002) to 175,000 (2004), with significant interannual differences (H (13, 168)
=28.204, P<0.05). An average monthly effort of around 150,000 hooks (152,802.4 ± 41,430.74) during the study period was applied. The Kruskal–Wallis test revealed significant differences between months (H (11, 168) =
94.709, P<0.05). Fishing effort dynamics showed two clear seasonal periods: the "winter” period, covering from January to April, with an average monthly effort of around 125,000 hooks; and the "summer” period from May to August, when the total fishing effort was considerably higher, about 200,000 monthly hooks. The Nemenyi´s test supported this discrimination. The transition between these two periods showed a different behavior, being abrupt, occurring within a few weeks (April-May) between the winter and summer periods, unlike the steady decline of fishing effort observed from September to December to reach the levels typical of the winter period (Figure 2c).
were observed between years in the areas of greater effort concentration, which were systematically located off the coast of Veracruz. An aspect worth noting was the progressive expansion of the fishery towards the north throughout the study period, from an area associated with parallel 24ºN to areas bordering the US waters (26ºN) at the end of the series (Figure 4). A recurrent marked seasonal spatial pattern was observed. During the summer period, the fishing effort focused on a specific area along the Veracruz Basin, far more restricted than in winter, when the fishing activity covered much of the study area. During the winter period, in spite of a much broader and heterogeneous distribution than in the summer, two main areas of effort concentration are apparent: one around the Veracruz Basin and another in the northern part of the
Campeche Canyon. These areas were recurrent throughout the winter months and were consistent over the years, as indicated by the coefficient of variation (Figure 5). The abrupt transition from winter to summer was spatially associated with a strong concentration process, while the steady transition towards the winter period was associated with a spatial dispersion dynamics.
Species Distributions
Although YFT catches occurred throughout the year, the CPUE showed significant monthly differences (H (11, 168) = 51.21, P<0.05). It displayed a bimodal
temporal distribution with two peaks: one in June, associated with the summer fishing effort peak; and the
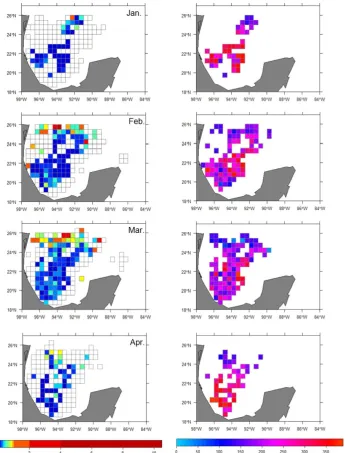
other in November, related to the transition period when the distribution of effort is scattered. The lowest CPUE was recorded in March and September (Figure 6a). In contrast, BFT showed a clear seasonality in the study area (H (11, 168) = 134.48, P<0.05), occurring mainly
between December and April, with a marked peak of CPUE in March. Interannual variability showed no clear pattern for any species, with a historic peak for BFT CPUE in 2012 (twice the annual average) and the lowest CPUE in the series for both species in 1999 (Figure 6b). To a large extent, peak YFT cumulative catches were associated with areas where the maximum fishing effort was applied, i.e., in the Veracruz Basin and the
Campeche Canyon. The distribution of CPUE for YFT showed a clear spatial pattern, with a marked concentration within an area off the coasts of Veracruz during the summer months (June-July), followed by a progressive dispersion (August-September) to attain a broad distribution covering virtually the entire oceanic zone of the MEEZ west of 89 W in the winter months (November-March) (Figure 7).
Despite this broad distribution, areas of higher CPUE were identified in the central GoM during this period. Then, throughout April and May, a spatial aggregation of CPUE occurred until the typical summer distribution was established again. The low CV values
Figure 4.Annual average fishing effort (left) and coefficient of variation (right) applied by the Mexican longline fleet in the Gulf of Mexico in 1999 and 2012. Averages are calculated within a 0.5º x 0.5º grid.
Figure 5.Monthly average fishing effort (left) and coefficient of variation (right) applied by the Mexican longline fleet in the Gulf
Figure 6. Catch per unit effort (CPUE) of yellowfin tuna (black) and bluefin tuna (red) by the Mexican longline fleet operating in the Gulf of Mexico between 1999 and 2012. a) Annual average (±SD), b) Monthly average (±SD).
indicate that this spatial pattern is recurrent over the years, although with slight variations, such as the progressive northward expansion of YFT CPUE recorded in the last years of the series, clearly associated with the fishing effort dynamics. BFT catches showed two large aggregation areas: one similar to YFT catch concentration areas, with the exception of the Veracruz offshore area that is more oceanic, and the other located in a strip north of 24ºN, in waters bordering USA. Although BFT CPUE covers the whole area, its distribution is narrower (in longitudinal terms) than that of YFT, avoiding areas related to the continental shelf. The highest relative abundances were observed in the northern zone during March, within the 25ºN-26ºN latitudinal strip. This area also showed the lowest CV
values, indicative of temporal recurrence and a potential aggregation area relative to areas with high interannual variability (Figure 8).
Bycatch ratio maps showed no clear recurrent spatial patterns (Figure 9), so no evidence was found in support off a spatial habitat discrimination for both species. Bycatch ratio yielded very low values, lower than 10 BFT per 100 YFT, for most areas; however certain cells reached high ratio values, close to 100, indicating a considerable overlap between both species. Although this high-ratio cells are located mainly in the area around the Veracruz Basin and Campeche Canyon, the lack of recurrence over time does not allow considering this area as a BFT bycatch hotspot.
Discussion
The vast majority of research efforts surrounding yellowfin and bluefin tuna and its fisheries dynamics in Mexico have focused on the Pacific purse-seine fishery because of the catch volumes involved and their impact on the national economy (INAPESCA, 2006). However, although the longline fishery in the Gulf of Mexico is relatively minor in economic terms, it entails a delicate situation for some of the species involved, such as the bluefin tuna (ICCAT, 2017; Collette, Wells, & Abad-Uribarren, 2015), some pelagic sharks (Baun & Myers, 2004), or sea turtles (Lewison & Crowder, 2007), thus highlighting the need to address it in research work. This
analysis is the first approximation to understand and characterize the distribution of the fishing effort applied by Mexican longliners in the GoM and the distribution of yellowfin and bluefin tuna, in order to lay the foundations for developing appropriate management strategies aimed at minimizing bycatch while maintaining catch volumes and economic yield.
Our results suggest well-defined seasonal patterns in the distribution of the fishing effort as well as of both tuna species. The overall performance of the fleet showed a recurrent pattern throughout the study, after the activity of the fleet was consolidated around 1999. The first years for which data were available (1994-1998) can be considered as a period of adaptation and
development of the fishery, due to both the high variability of effort recorded and the presence of data gaps. The Fisheries Management Plan, approved in 2015, considers that this period (1993-1998) shows an unstable behavior derived from the resumption of this fishery; this was completely suspended in the 1980s due to administrative issues, when the fleet was owned by the consortium “Productos Pesqueros Mexicanos”, a company that was privatized in the early 1990s. Although this period was eliminated from subsequent analyses, it should be analyzed in depth in future investigations in order to obtain information on how the fishing strategy was established and the key factors that were considered. For this study, no information about these data gaps was available, which may potentially lead to misinterpretation. For example, Abad-Uribarren, Meiners, Ramirez-Lopez, and Ortega-Garcia (2014), one of the few studies on record, lacking effort data and assuming a relatively stable fishery, pointed to 1997 as the year with the lowest BFT catches; in this case, however, these authors were unaware that no data were recorded for the months of highest BFT occurrence (February-March), which surely underestimated the true occurrence, with the potential risk of leading to questionable conclusions.
YFT was present in the study area all year round, showing a less marked seasonal variability and a broader distribution range throughout the GoM compared to BFT. This could be related, in addition to the much more generalized habitat requirements exhibited by YFT, to its much larger population size and density (Teo & Block, 2010). Spatially, the two relative abundance peaks recorded during June and November could be associated with reproductive and trophic migrations, and even with ontogenic changes in the stock. Unfortunately, sex and size records of the individuals captured were not available. The aggregation process observed along the Veracruz coast between May and August may be driven by reproduction. Informal communications from local artisanal fishermen mention that YFT spawns off the Veracruz reef system in the summer.
Although no scientific evidence of this issue is currently available, some studies support this anecdotal evidence. Based on histological analyses, Arocha, Lee, Marcano, and Marcano (2000) determined that YFT spawning in the northern GoM (vicinity of the Loop Current) takes place between May and August. Brown-Peterson, Franks, Gibson, and Marshall (2014) and Cornic, Smith, Kitchens, Alvarado-Bremer, and Rooker (2017) reported YFT spawning between April and August on the continental slope off the coast of Louisiana. Previously, Olvera-Limas, Cerecedo, and Compean (1988) found important larval densities in the southwestern portion of the Gulf of Mexico and southeast of the Yucatan Peninsula between May and July. Aggregations of spawning YFT have been previously recorded in different locations (e.g. Philippines, Hawaii),
either by the presence of high larval concentrations (Yesaki, 1983; Boehlert & Mundy, 1994) or through direct identification methods (Itano, 2000), seemingly related to higher food availability. Highly productive areas, like the plume/oceanic interface of the Mississippi River in the Gulf of Mexico, have been related to significant levels of yellowfin spawning (Grimes & Lang, 1992).
YFT aggregation areas and their time of occurrence in this study are highly consistent with the above scenario, with peaked CPUE values coupled with the occurrence of tropical storms (Gutiérrez de Velasco & Winant, 1996) in an area influenced by discharges of large rivers, all of which boost primary production (Monreal-Gomez & Salas de Leon, 2004). Although YFT distribution is likely to be broader during this period for US waters (Teo & Block, 2010), the aggregation of spawners may lead to the concentration of fishing effort in that area (de Mitcheson & Erisman, 2012), hence skewing the actual distribution. Considering that the main destination of catches is the US sushi market (DOF, 2015), the proximity of fishing grounds to the main ports in these months — which reduces onboard storage times — and the quality of pre-spawners meat, makes catches meet the sushi-grade standards required for export.
Once this aggregation period passes, the fishing effort expands progressively to encompass the whole study area, associated with a reduction in fish abundance; as a result, YFT reaches an expanded spatial range in March, coinciding with the peak in BFT relative abundance. In between, a second peak in YFT relative abundance occurs (November), and although it is found across the entire study area, it shows higher relative abundances in the northern-central zone, a recurrent pattern over the study period. Teo and Block (2010) recorded the highest YFT CPUE values in this area, but no specific environmental factors were found to force this distribution. Thus, hypothesizing about the main ecological processes underlying this distribution pattern is a difficult task. It should be noted that the relative abundance of YFT in this area may be higher than recorded, as the fishing effort during these months, although distributed throughout the basin, shows hotspots over the Veracruz Basin and the Campeche Canyon. This particular pattern suggests a likely diversification of fishing activity, since unlike other fisheries, longline sets and gear can be easily fitted to target a particular species (Orbesen, Snodgrass, Shideler, Brown, & Walter, 2017), aiming at high economic yield species such as BFT or swordfish (Xiphias gladius). Note that Mexico has increased its Total Admissible Catch (TAC) for these species in recent years: up to 95 t for bluefin, and 200 t for swordfish (DOF, 2015).
June (Lutcavage, Galuardi, & Lam, 2013). CPUE of BFT showed a marked seasonal variability, with February and March as the months with the highest relative abundance. This is probably related to the main spawning period, as confirmed by the presence of mature females from the end of March throughout April, collected during biological samplings carried out by the CICIMAR-IPN Large Pelagics Project (Ortega-Garcia S, pers. comm., 2018). These results are similar to peaked relative abundance values in US waters, recorded in April and May (Teo & Block, 2010), which correspond to the spawning season in that area (Baglin, 1976; Teo, Boustany, & Block, 2007; Knapp, Aranda, Medina, & Lutcavage, 2014). A time lag is then observed in the occurrence of species between northern and southern GoM, suggesting that BFT spawns in Mexican waters one or two months earlier than in US waters. The above supports the hypothesis proposed by Lutcavage
et al. (2013) about BFT spawning not only in springtime and in known areas, but also in winter in the southern GoM and adjacent waters such as the Caribbean Sea. These authors suggest that BFT starts moving into the Gulf in October, where it remains as a resident (Teo et al., 2007; Galuardi et al., 2010) until optimum conditions for spawning occur (Teo et al., 2007). This may explain the lag in the timing of occurrence within the GoM, since optimal spawning conditions, mainly sea surface temperature above 24 °C, are reached earlier in southern waters (Abad-Uribarren et al., 2014).
Spatially, BFT shows a broad distribution, which includes a large portion of the oceanic area in the western GoM; these results coincide with the spatial pattern proposed by Block et al. (2005) based on position data from satellite tags and catch data recorded by the North American longline fleet. Bearing in mind the evolution of the Mexican fleet effort distribution, with a progressive northward expansion, two main BFT distribution areas can be identified in the GoM: one associated with the continental slope off the coasts of Veracruz and Campeche, and the other, of greater relative importance, related to the continental slope off the coasts of Texas and Louisiana. As pointed out by Teo
et al. (2007), this behavior seems more related not to a direct use of the bottom, but rather to a preference for areas with mesoscale eddies that interact with the seabed topography. Several studies have also reported potential relationships between the distribution of spawning BFT and mesoscale eddies (Garcia et al., 2005; Teo et al., 2007; Teo & Block, 2010). These eddies tend to form along slope waters and are areas of increased productivity and slightly colder water compared to the surrounding warm oceanic Gulf currents (Biggs & Müller-Karger, 1994; Monreal-Gómez & Salas de León, 2004; Teo et al., 2007). The presence of semi-permanent mesoscale cyclonic eddies associated with the continental slope has been recorded in the Texas-Louisiana and Campeche Bay areas (Zavala-Hidalgo, Morey, & O'Brien, 2003; Monreal-Gómez & Salas de León, 2004).
One of our assumptions was the potential spatial segregation between the two species at key moments, which would allow temporary spatial closures to avoid the incidental catch of BFT spawners without substantially affecting the YFT fishery yield. However, the results obtained here indicated a considerable overlap between both species, highlighting the need to develop alternative strategies. To this end, the oceanographic preferences of both species should be characterized and compared in search of potential segregation of oceanographic niches, already described for other areas (Teo & Block, 2010; Hsu, Boustany, Roberts, Chang, & Halpin, 2015), at different spatio-temporal scales in Mexican waters, aiming to develop effective management strategies (Bertrand & Diaz, 2008; Howell, Kobayashi, Parker, & Polovina, 2008). A positive aspect despite the overlap in the distribution of both species, which is to be expected at some point as BFT is bycatch, is that it occurs outside the months of peak YFT catches, so that the effect of any BFT bycatch mitigation measure should be less controversial.
In summary, during the summer period, from May to August, fishing effort is both greater and spatially concentrated, probably targeting spawning YFT, while in winter months, between December and April, this effort decreases by 30% and its distribution covers a broader area, likely targeting a higher number of species. BFT is caught during this period, reaching its highest relative abundance in March, probably associated with the spawning peak. Despite the considerable overlap observed in the spatio-temporal distribution of the two species, determining their oceanographic habitat at different spatial and temporal scales is necessary to support this finding. The similarities of these results with those obtained by other authors for US waters (Teo & Block, 2010) are worth highlighting, and pointing the need to analyze both databases under the same approach to get a complete picture of the distribution of BFT and YFT across the entire GoM. Given the Large Marine Ecosystem condition of the GoM, this analysis will allow the development of joint management measures from an ecosystem-based approach (Sherman & Duda, 1999; Duda & Sherman, 2002; Cury et al., 2008).
Acknowledgments
References
Abad-Uribarren, A., Meiners, C., Ramírez-López, K. & Ortega-García, S. (2014). Bluefin tuna (Thunnus thynnus) bycatch dynamics and its relation with environmental variability in Mexican waters of the Gulf of Mexico. Collective Volume of Scientific Papers. International Commission
for the Conservation of Atlantic Tunas,70 (2), 684-698.
Amande, M.J., Lennert-Cody, C., Bez, N., Hall, M. & Chassot, E. (2010). How much sampling coverage affects bycatch estimates in purse seine fisheries? IOTC Proceedings IOTC-2010-WPEB-20, 16 pp.
Arocha, F., Lee, D.W., Marcano, L.A. & Marcano, J.S. (2000). Preliminary studies on the spawning of yellowfin tuna,
Thunnus albacares, in the western Central Atlantic.
Collective Volume of Scientific Papers. International
Commission for the Conservation of Atlantic Tunas,
51(2), 538-551.
Baun, J.K. & Myers, R.A. (2004). Shifting baselines and the decline of pelagic sharks in the Gulf of Mexico. Ecology
Letters, 7, 135–145.
http://dx.doi.org/10.1111/j.1461-0248.2003.00564.x
Baglin, R.E. (1976). A preliminary study of the gonadal development and fecundity of the western Atlantic bluefin tuna. Collective Volume of Scientific Papers. International Commission for the Conservation of
Atlantic Tunas, 5 (2), 279-289.
Bertrand, S. & Diaz, E. (2008). Patterns in the spatial distribution of Peruvian anchovy (Engraulis ringens) revealed by spatially explicit fishing data. Progress in
Oceanography, 79, 379–389.
http://dx.doi.org/10.1016/j.pocean.2008.10.009 Biggs, D.C. & Müller-Karger, F.E. (1994). Ship and satellite
observations of chlorophyll stocks in warm- and cold- core rings in the western Gulf of Mexico. Journal of
Geophysics Research, 99, 7371– 7384.
https://dx.doi.org/10.1029/93JC02153
Block, B.A., Teo, S.L.H., Walli, A., Boustany, A., Stokesbury, M.J.W., Farwell, C.J., … Williams, T.D. (2005). Electronic tagging and population structure of Atlantic bluefin
tuna. Nature, 434,
1121-1127. https://dx.doi.org/10.1038/nature03463 Boehlert, G.W. & Mundy, B.C. (1994). Vertical and
onshore-offshore distributional patterns of tuna larvae in relation to physical habitat features. Marine Ecology Progress
Series, 107, 1–13.
https://dx.doi.org/10.3354/meps107001
Brown-Peterson, N.S., Franks, J.S., Gibson, D.M. & Marshall, C. (2014). Aspects of the reproductive biology of yellowfin tuna, Thunnus albacares, in the northern Gulf of Mexico.
Proceedings of the Gulf and Caribbean Fisheries Institute,
66, 509-510.
Cornic, M., Smith, B.L., Kitchens, L.L., Alvarado-Bremer, J.R. & Rooker, J.R. (2017). Abundance and habitat associations of tuna larvae in the surface water of the Gulf of Mexico.
Hydrobiologia, 806(1), 29-46.
http://dx.doi.org/10.1007/s10750-017-3330-0
Collette, B.B., Wells, D. & Abad-Uribarren, A. (2015). Thunnus
thynnus. The IUCN Red List of Threatened Species 2015.
Retrieved from
http://www.iucnredlist.org/details/21860/25
Cury, PM., Shin, Y-J., Planque, B., Durant, J.M., Fromentin, J.M., Kramer-Schadt, S, Grimm, V. (2008). Ecosystem oceanography for global change in fisheries.
Trendsin Ecology & Evolution, 23(6), 338-346.
http://doi.org/10.1016/j.tree.2008.02.005
DOF. (2015). Fishing management plan for yellowfin tuna
(Thunnus albacares) in the Gulf of Mexico (in Spanish).
Diario Oficial de la Federación, México DF, México, 11 de
mayo de 2015. Retrieved from
http://www.dof.gob.mx/nota_detalle.php?codigo=539 1713&fecha=11/05/2015
Duda, A.M. & Sherman, K. (2002). A new imperative for improving management of large marine ecosystems.
Ocean Coastal Management, 45, 797–833.
https://doi.org/10.1016/S0964-5691(02)00107-2 Galuardi, B., Royer, F., Golet, W., Logan, J., Neilson, J., & Molly
Lutcavage. (2010). Complex migration routes of Atlantic bluefin tuna (Thunnus thynnus) question current population structure paradigm. Canadian Journal of
Fisheries and Aquatic Sciences, 67, 966–976.
http://dx.doi.org/10.1139/F10-033
Garcia, A., Alemany, F., Velez-Belchí, P., López-Jurado, J.L., Cortés, D., De la Serna, J.M., … Ramírez, T. (2005). Characterization of the bluefin tuna spawning habitat off the Balearic archipelago in relation to key oceanographic features and associated environmental conditions. Collective Volume of Scientific Papers. International Commission for the Conservation of Atlantic Tunas, 58(2), 535-549.
Grimes, C. & Lang, K. (1992). Distribution, abundance, growth, mortality, and spawning dates of yellowfin tuna,
Thunnus albacares, larvae around the Mississippi river
discharge plume. Collective Volume of Scientific Papers. International Commission for the Conservation of
Atlantic Tunas,38(2), 177-194.
Gutiérrez de Velasco, G. & Winant, C.D. (1996). Seasonal patterns of wind stress and wind stress curl over the Gulf of México. Journal of Geophysical Research, 101, 18127-18140. https://dx.doi.org/10.1029/96JC01442
Hobday, A.J. & Hartmann, K. (2006). Near real-time spatial management based on habitat predictions for a longline bycatch species. Fisheries Management and Ecology, 13,
365–380.
https://dx.doi.org/10.1111/j.1365-2400.2006.00515.x
Howell, E.A., Kobayashi, D.R., Parker, D.M., Polovina, J.J. (2008). TurtleWatch: a tool to aid in the bycatch reduction of loggerhead turtles Caretta caretta in the Hawaii-based pelagic longline fishery. Endangered
Species Research, 5, 267-278
https://dx.doi.org/10.3354/esr00096
Hsu, A.C., Boustany, A.M., Roberts, J.J., Chang, J-H., & Halpin, P.N. (2015). Tuna and swordfish catch in the U.S. northwest Atlantic longline fishery in relation to mesoscale eddies. Fisheries Oceanography, 24(6), 508– 520. https://doi.org/10.1111/fog.12125
ICCAT. (2017). Report of the 2017 ICCAT bluefin stock
assessment meeting. Retrieved from
https://www.iccat.int/Documents/SCRS/DetRep/BFT_A SS_ENG.pdf
INAPESCA. (2006). Sustainability and responsible fishing in Mexico. Evaluation and management (in Spanish).
Retrieved from
https://www.inapesca.gob.mx/portal/documentos/pub licaciones/pelagicos/libro_Rojo.pdf
Itano, D.G. (2000). The reproductive biology of yellowfin tuna
(Thunnus albacares) in Hawaiian waters and the
Kaplan, D.M., Chassot, E., Amande, J.M., Dueri, S., Demarcq, H., Dagorn, L., & Fonteneau, A. (2014). Spatial management of Indian Ocean tropical tuna fisheries: potential and perspectives. ICES Journal of Marine
Science, 71(7), 1728–1749.
https://dx.doi.org/10.1093/icesjms/fst233
Knapp, J.M., Aranda, G., Medina, A. & Lutcavage, M. (2014). Comparative Assessment of the Reproductive Status of Female Atlantic Bluefin Tuna from the Gulf of Mexico and the Mediterranean Sea. PLoS ONE, 9(6), e98233. https://dx.doi.org/10.1371/journal.pone.0098233 Lehodey, P., Andre, J.M., Bertignac, M., Hampton, J., Stoens,
A., Menkes, C., ..., Grima, N. (1998). Predicting skipjack tuna forage distributions in the equatorial Pacific using a coupled dynamical biogeochemical model. Fisheries
Oceanography, 7(3/4), 317-325.
https://dx.doi.org/10.1046/j.1365-2419.1998.00063.x Lewison, R.L. & Crowder, L.B. (2007). Putting longline bycatch
of sea turtles into perspective. Conservation Biology, 21(1), 79-86. https://doi.org/10.1111/j.1523-1739.2006.00592.x
Lutcavage, M.E., Galuardi, B. & Lam, T.C.H. (2013). Predicting potential Atlantic spawning grounds of western Atlantic bluefin tuna based on electronic tagging results, 2002-2011. Collective Volume of Scientific Papers. International Commission for the Conservation of
Atlantic Tunas, 69(2), 955-961.
Mather, F.J., Marson, Jr J.M. & Jones, A. (1995). Historical document: life history and fisheries of Atlantic bluefin tuna. NOAA Technical Memorandum NMFS-SEFSC-370,
Miami, U.S.,165 pp.
https://dx.doi.org/10.5962/bhl.title.4783
Maunder, M.N., Sibert, J.R., Fonteneau, A., Hampton, J., Kleiber, P., & Harley, S.J. (2006). Interpreting catch per unit effort data to assess the status of individual stocks and communities. ICES Journal of Marine Science, 63, 1373-1385.
https://doi.org/10.1016/j.icesjms.2006.05.008
McDonald, J.H. (2009). Handbook of Biological Statistics. 2th Edition, Sparky House Publishing, Baltimore, Maryland, 317 p.
Monreal-Gómez, M.A. & Salas de León, D.A (2004). Gulf of Mexico, circulation and productivity (In Spanish). Ciencias, 76, 24-3.
Mugo, R., Saitoh, S-I., Nihira, A. & Kuroyama, T. (2010). Habitat characteristics of skipjack tuna (Katsuwonus pelamis) in the western North Pacific: a remote sensing perspective.
Fisheries Oceanography, 19(5), 382-396.
https://dx.doi.org/10.1111/j.1365-2419.2010.00552.x NGIA. (2016). Geographic Names Database: Undersea feature
names. Retrieved from
http://geonames.nga.mil/gns/htlm/gns_services Olvera-Limas, R.M., Cerecedo, J.L. & Compean, G.A. (1988).
Distribution of tuna larvae in the Gulf of Mexico and Caribbean Sea; Abundance and biomass of three species in the Exclusive Economic Zone (in Spanish).
INAPESCA-Ciencia Pesquera, 6, 119-140.
Orbesen, E.S., Snodgrass, D., Shideler, G., Brown, C.A. & Walter, J.F. (2017). Diurnal patterns in Gulf of Mexico epipelagic predator interactions with pelagic longline gear: implications for target species catch rates and bycatch mitigation. Bulletin of Marine Science, 93(2), 573-589. https://dx.doi.org/10.5343/bms.2016.1008
R Core Team. (2018). R: A language and environment for statistical computing. R Foundation for Statistical Computing, Vienna, Austria. Retrieved from https://www.R-project.org/
Ramírez-López, K. (2009). Statistical data of the Mexican longline fleet fishing for yellowfin tuna in the Gulf of Mexico from 1994 to 2007. Collective Volume of Scientific Papers. International Commission for the
Conservation of Atlantic Tunas, 64(4), 1159-1170
Razali, N. M. & Wah, Y. B. (2011). Power Comparisons of Shapiro-Wilk, Kolmogorov-Smirnov, Lilliefors and Anderson-Darling Tests. Journal of Statistical Modeling and Analytics, 2, 21-33.
de Mitcheson, Y.S. & Erisman, B. (2012). Fishery and biological implications of fishing spawning aggregations, and the social and economic importance of aggregating fishes. In Sadovy de Michetson & P.L. Colin (Eds.), Reef Fish Spawning Aggregations: Biology,
Research, and Management (pp. 225–284), Springer,
Netherlands.
Sherman, K. & Duda, A.M. (1999). Large Marine Ecosystems: An Emerging Paradigm for Fishery Sustainability.
Fisheries, 24(12), 1-26.
https://dx.doi.org/10.1577/1548-8446(1999)024<0015:LME>2.0.CO;2
Solana-Sansores, R., Nava-Abarca, M. & González, J.O. (2002). Obtaining catch and effort statistics for the Mexican tuna fishery in the Gulf of Mexico. Collective Volume of Scientific Papers. International Commission for the
Conservation of Atlantic Tunas, 54 (5), 1713-1719.
Sosa-Nishisaki, O., Robles, H., Dreyfus-León, M.J. & Ceseña, O. (2001). Longline tuna fishery in the Gulf of Mexico (In Spanish). El Vigía, PNAAPD, 6(13), 20-23.
Teo, S.L.H. & Block, B.A. (2010). Comparative influence of ocean conditions on yellowfin and Atlantic bluefin tuna catch from longlines in the Gulf of Mexico. PLoS ONE,
5(5), e10756.
https://doi.org/10.1371/journal.pone.0010756 Teo, S.L.H., Boustany, A.M., & Block, B.A. (2007).
Oceanographic preferences of Atlantic bluefin tuna, Thunnus thynnus, on their Gulf of Mexico breeding
grounds. Marine Biology, 152, 1105–1119.
https://doi.org/10.1007/s00227-007-0758-1
Watson, J.T., Essington, T.E., Lennert-Cody, C.E. & Hall, M.A. (2008). Trade-offs in the design of fishery closures: Management of silky shark bycatch in the Eastern Pacific Ocean tuna fishery. Conservation Biology, 23(3), 626– 635. https://doi.org/10.1111/j.1523-1739.2008.01121.x Yesaki, M. (1983). Observations on the biology of yellowfin
(Thunnus albacares) and skipjack (Katsuwonus pelamis)
tunas in Philippine waters. Indo-Pacific Tuna
Development and Management Programm Working
Papers, IPTP/83/WP/7, 66 p.
Zavala-Hidalgo, J., Morey, S. & O'Brien, J. (2003). Seasonal circulation on the western shelf of the Gulf of México using a high resolution numerical model. Journal of
Geophysical Research, 108, 33-89.
https://doi.org/10.1029/2003JC001879