Iranian Chemical Society
Anal. Bioanal. Chem. Res., Vol. 3, No. 1, 19-27, June 2016.
Application of Central Composite Design for Optimization of Coacervative
Extraction of Cu(II) Using Anionic Surfactant
M. Bahram*, L. Shokri and N. Mohseni
Department of Chemistry, Faculty of Science, Urmia University, Urmia, Iran (Received 1 September 2015, Accepted 3 January 2016)
The aim of this work was to develop a new and simple coacervative extraction method for the preconcentration and spectrophotometric determination of Cu(II) in water samples. Dithizone was used as the chelating agent while an anionic surfactant, namely sodium dodecyl sulfate (SDS), was used as extracting agent at room temperature. Central composite design (CCD) based on response surface methodology (RSM) was employed to optimize main experimental parameters such as pH values of solutions, concentration of the surfactant and volume of the saturated salt. Analytical characteristics of the method such as limit of detection, linear range, relative standard deviation (R.S.D.) and relative standard error (R.S.E.) were calculated under the optimum conditions. The calibration graph was linear in the range of 10-100 ng ml-1 with the detection limit of 3.8 ng ml-1. The interference effects of some anions and cations were also studied. The method was successfully applied for the determination of Cu(II) in water samples.
Keywords: Coacervative extraction, Cu(II), Dithizone, SDS, Central composite design
INTRODUCTION
Copper is a vital nutrient mineral, essential for the health, growth and reproduction of all higher plants and animals. It is widely released into the environment by both natural sources and human activities [1]. Copper has been more considered by its applications in metallurgical and chemical industries; however, it is one of the essential microelements for human body [2,3], so that copper deficiency can cause impaired growth in children while it helps detecting a number of metabolic problems in adults. Nevertheless, once copper level exceeds a certain value, immune mechanism will be activated protecting the body against excess copper [4]. At high concentrations, copper can be toxic to human organisms with the risk of death in some cases. Considering the importance of copper content in drinking water in terms of health issues, it is very important to develop simple, fast and reliable methods to determine Cu(II) content of water samples [5,6]. Although flame atomic absorption spectrometry (FAAS) and
*Corresponding author. E-mail: [email protected]
inductively coupled plasma mass spectrometry (ICP-MS) are the most commonly used techniques for detecting traces of Cu(II), spectrophotometry continues to enjoy wide popularity [7]. Availability of instrumentation, method simplicity, speed and precision has made spectro-photometric methods still attractive for the determination of Cu(II) [8]. However, due to the trace amounts of Cu(II) in natural water samples, a preconcentration step is essential prior to its spectrophotometric determination.
Micellar extraction with relatively non-flammable, nonvolatile and environment-friendly surfactants at cloud point is a highly effective method for preconcentration of microcomponents [9-17]. The use of cloud point extraction (CPE) has gained considerable attention in the last few years, as it has a considerable potential to concentrate a wide variety of toxic elements while providing good recycling characteristics and high preconcentration yield in water samples [4].
this may affect stability of the compounds of interest.
It should be pointed out that CPE involves the phase separation of neutrally charged (nonionic or zwitterionic) surfactants induced by the temperature while coacervative extraction involves phase separation of ionic amphiphiles induced by other parameters (e.g., addition of electrolytes, pH change, addition of organic co-solvents, or simple mixing of oppositely charged amphiphiles) [24]. Coacervative extraction can be performed at a low temperature while providing a higher rate of recovery and lower limit of detection compared to the previous methods [25-31].
In the present work, an anionic surfactant, namely sodium dodecyl sulfate (SDS), is used as an extracting agent at room temperature. The method is based on the reaction of Cu(II) with dithizone and extraction of the produced complex. In the preconcentration step, an appropriate amount of SDS, saturated solution of KCl and aqueous sample were mixed and then kept in an ice bath. Once cloud point or turbidity was observed, the mixture was centrifuged to separate the surfactant-rich phase containing the analyte of interest. The sedimented surfactant-rich phase was diluted with acetonitrile before being detected by spectrophotometric method. Central composite design (CCD) and response surface method (RSM) were applied to design the experiments and optimize the experimental parameters.
EXPERIMENTAL
Apparatus
A diode array spectrophotometer (Agilent 8453) with a 1 ml quartz cell was used for absorbance measurements.A Metrohm model 713 pH-meter equipped by a combined glass electrode was employed for measuring pH values in the aqueous phase. Ice-water bath was used to establish nebulosity.Phase separation of the solutions was performed with a centrifuge (UromAzma Co., 4000 rpm, Urmia, Iran).
Reagents
All chemicals used in the experiments were of analytical reagent-grade, purchased from Merck and used without further purification. All dilutions were prepared with deionized water. A stock solution of copper (100 µg ml-1)
was prepared by dissolving an appropriate amount of Cu(NO3)2.3H2O in water. Working solutions were prepared
by diluting the stock solution adequately. A 1 × 10⁻³ M dithizone solution was prepared by first dissolving 25.6 mg of dithizon in 2 ml of NaOH (4 M), and then diluting the solution to 100 ml in a volumetric flask. Dithizonsolution should be prepared daily. A 5% (w/v) aqueous solution of SDS was prepared by dissolving 5 g of SDS in 100 ml of double distilled water. A phosphate buffer with a pH value of 2 was prepared by using phosphoric acid (85%) and sodium hydroxide at appropriate concentrations. A saturated solution of potassium chloride was prepared by dissolving KCl in double distilled water.
Statistical Software
Essential Regression and Experimental Design for chemists and Engineers (EREGRESS), as an add-in script for MS Excel software [32,33], was used to design the experiments and also to model and analyze the results.
Central Composite Design
CCD was used to optimize effective experimental parameters on preconcentration and determination of Cu(II). Three independent factors, namely pH (F1), SDS concentration (F2) and added volume of saturated KCl (F3) were studied at five levels with four repeats at the central point, using a circumscribed central composite design. For each of the three studied variables, high (coded value: +1) and low (coded value: -1) set points were selected as shown in Table 1. Also, Table 2 shows the coded values of designed experiments based on CCD methodology achieved using EREGRESS software.
For a particular response, polynomial equations and response surface were produced using EREGRESS. For an experimental design with three factors, the model (including linear, quadratic and cross-terms) can be expressed as Eq. (1).
Response = b0 + b1 × F1 + b2 × F2 + b3 × F3 + b4 × F1 × F1 + b5 × F2 × F2 + b6 × F3 × F3 + b7 × F1 × F2 + b8 × F1 × F3 + b9 × F2 × F3 (1)
Table 1. Variables Used for Central Composite Design along with their Values
Coded factor levels
Variable name -1 (low) -0.59 0 +0.59 +1 (high)
F1 pH 1 1.81 1.00 4.20 5.00
F2 SDS (5% w/v) (ml) 0 0.10 0.25 0.40 0. 50
F3 Saturated KCl (ml) 0 0.24 0.60 0.96 1.20
Table 2. List of Experiments Planned in CCD for Model Optimization (Coded Values)
Factor levels
Design points Response
1 0.00 0.00 -1.00 0.00
2 -0.59 -0.59 0.59 0.20
3 0.59 -0.59 -0.59 0.09
4 0.00 -1.00 0.00 0.03
5 -0.59 0.59 0.59 0.14
6 -0.59 0.59 -0.59 0.09
7 0.00 0.00 1.00 0.15
8(cp) 0.00 0.00 0.00 0.18
9 -1.00 0.00 0.00 0.20
10(cp) 0.00 0.00 0.00 0.16
11 0.59 0.59 -0.59 0.02
12(cp) 0.00 0.00 0.00 0.17
13(cp) 0.00 0.00 0.00 0.18
14 1.00 0.00 0.00 0.09
15 0.59 -0.59 0.59 0.06
16 -0.59 -0.59 -0.59 0.12
17 0.00 1.00 0.00 0.00
18 0.59 0.59 0.59 0.03
(cp)
regression (MLR) using EREGRESS. The response surface plots were obtained through a statistical process describing the design and the modelled CCD data. Response surface methodologies graphically illustrate relationships between parameters and responses and are the way to obtain an exact optimum [32-37].
Statistical significances of the predicted models were evaluated by the analysis of variance (ANOVA) and least squares techniques. The ANOVA employs Fisher’s statistical test (F-test) to determine which factors significantly affect the studied response variables. Statistical significance and the magnitude of the estimated coefficients of each variable and all their possible interactions with the response variables were determined. Such coefficients represent the improvement in the response for each variable, that is, the expected responses as the variables are changed from low to high. Effects with less than 95% of significance (effects with a p-value higher than 0.05) were discarded and pooled into the error term before a new analysis of variance was performed on the reduced model. Note that the p-value represents a decreasing index of the reliability of a result. Replicates (n = 4) of the central points were performed to have an estimation of experimental error.
Extraction Procedure
An appropriate amount of Cu(II) (so that its final concentration would be in the range of 10-90 ng), 0.06 ml of 10-3 Mdithizon, 0.25 ml of 5% (w/v) SDS solution and 1 ml of phosphate buffer solution (pH = 2) were placed in a 15 ml centrifuge tube. Using distilled water, the solution was diluted to more than 9 ml. 0.6 ml of saturated KCl solution was introduced into the solution. After homogeneous mixing for several seconds, the sample left to stand in an ice bath for 10 min before centrifugation, thereby a cloudy solution was formed. Separation of two phases was completed by centrifuging the mixture at 2600 rpm for 7 min. The aqueous phase was easily decanted by gently inverting the test tube. The main advantage of the application of anionic surfactant is that the extraction can be carried out at room temperature and no more heating is necessary. On the other hand, using ice-bath is not necessary; it can be used arbitrarily for better phase separation before centrifugation. The surfactant-rich phase sedimented in the bottom of the sample tube was diluted
with 1 ml acetonitrile and transferred into a 1 ml quartz cell to measure the absorbance of the solution at 510 nm against a reagent blank. The blank solution was obtained under the same conditions, but without Cu(II), and its spectrum was recorded.
RESULTS AND DISCUSSION
Experimental Design
predicted by modeling other points. In a good model, these parameters may not be too different from each other. However, for small datasets, it is very likely for every data point to be influential, in which case a high value of prediction R2 (R2pred) may not be expected [32]. Eliminating insignificant parameters from Eq. (1), calibration R2 eventually decreased to 0.920; however, adjusted R2 (R2adj), and prediction R2 (R2pred) increased to about 0.886 and 0.731, respectively. The properties of the obtained reduced model using significant linear, quadratic and interaction parameters are shown in Table 3. It is worth mentioning that the regression equation was obtained using un-coded values of parameters. For this case, the adjusted R2 values were well within the acceptable limits and there were not large differences between R2 values, indicating a good fit of the experimental data to the third-order polynomial equations.
Response Surface and Selection of Optimum Conditions
Response surface methodology (RSM) is useful for modeling while the response of interes t is influenced by
several variables and the objective is to optimize this response. Three-dimensional (3D) graphs provide insight into the effect of each variable to achieve peak performance. Plots for the predicted responses were prepared based on the model function to analyze the change in response surface. Some of the response surface plots are represented in Fig. 1, which illustrates the relationship between two variables and the absorbance (510 nm) of samples, while two other variables were fixed at the central point.
The surface plots reveal a non-linear relation between the response and the variables, F1-F3, because the surface plots of the response are curvature. As seen, all of the investigated experimental variables have a pronounced effect on the extraction and preconcentration procedure of Cu(II). The significance, shown in Table 3, shows the significance of linear, quadratic and cross terms.
From the constructed models, using real factors for optimization of the variables to extract and determine Cu(II) (Fig. 1 and Table 3), and the following results were concluded: pH (F1) has a significant impact on the response by linear term. SDS (F2) affects significantly the proposed preconcentration method both by linear and quadratic terms.
Table 3. Several Characteristics of the Constructed Models
Regression equation Coefficient Value
Abs = b0 + b1*pH + b2*SDS +
b3*pH*KCl + b4*SDS*SDS +
b5*KCl*KCl
|R| 0.959
R2 0.920
R2 adjusted 0.886
R2 for prediction 0.731
Standard Error 0.02357
No. points 18.000
PRESSa 0.020
b0
b1
b2
b3
b4
b5
0.01597
2.46942
7.33281
2.73084
5.56568
0.00068
In addition, response surface plots reveal that KCl is one of the effective parameters and has an interaction with pH. Finally, using the response surfaces, the optimum conditions are obtained and described in Table 4.
Analytical Characteristics of the Proposed Method After optimization of all parameters effective on the extraction procedure of Cu(II), a linear relationship between the absorbance and concentration was obtained in the range of 10-100 ng ml-1. Table 5 summarizes the analytical characteristics of the optimized method, including regression equation, linear range, and limit of detection, reproducibility, and preconcentration factor. The limit of detection, defined as CL = 3 SB/m (where CL, SB and m are
the limit of detection, standard deviation of the blank, and slope of the calibration graph, respectively), was 3.8 ng ml
-1
. The proposed method showed an excellent repeatability (RSD < 5% for 7 replicate determinations of 40 ng ml-1
Cu(II)) using the optimum values obtained through CCD. Because the amount of Cu(II) in 10 ml sample solution after preconcentration by CPE was measured at 1 ml, the solution is concentrated by a factor of 10.
Interference Study
Effects of various cations and anions on the preconcentration and determination of 40 ng ml-1 Cu(II) were studied under the optimum conditions. As seen in Table 6, most of the cations and anions did not interfere even when they were present in 1000-fold excess over the analyte. An ion was considered to interfere when its presence produced a greater than ±5% variation in the absorbance of the sample.This variation of absorbance was evaluated at the wavelength of 510 nm (corresponding to the maximum absorption of Cu(II) complex). Results showed that, Hg, Ag, Cd and Ni (at 40 ng ml-1) can interfere seriously within the course of extraction and determination
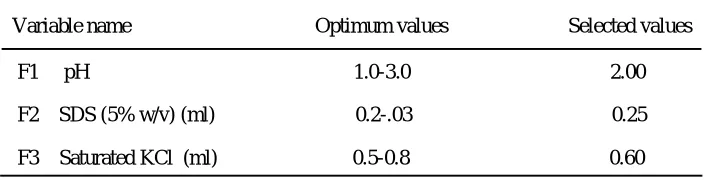
Table 4. Optimum Conditions Obtained by the Response Surface Modeling
Variable name Optimum values Selected values
F1 pH 1.0-3.0 2.00
F2 SDS (5% w/v) (ml) 0.2-.03 0.25
F3 Saturated KCl (ml) 0.5-0.8 0.60
Table 5. Analytical Characteristics of the Proposed Method
Regression equationa
R2b
Linear range (ng ml-1)
LOD (ng ml-1)c
Repeatability (RSD)d
Concentration factor
Abs = 0.0041 × C + 0.001
0.993
10-100
3.80
4.43
10.00
a
of Cu(II) ions.
Application of the Proposed Method
To test the reliability of the proposed procedure, it was applied to determine Cu(II) in tap water samples. The samples were spiked with Cu(II) to validate the procedure. The results are presented in Table 7. The recoveries were close to 100% indicating successful applicability of the proposed methods for determination of Cu(II) by analyzing real samples.
CONCLUSIONS
In this work, SDS as an anionic surfactant was successfully employed in a coacervative extraction method for determination of Cu(II) in water samples. The proposed method gives a simple, safe, rapid, easy to use, selective,
sensitive, and low cost spectrophotometric procedure for the preconcentration and separation of Cu(II) from water samples. By using anionic surfactant, toxic solvent extraction has been avoided. Also, compared to nonionic micellar extraction, the use of anionic surfactant in the proposed procedure has brought some considerable advantages for the extraction of Cu(II) such as: i) this method can be performed at low temperatures, so it can be carried out for extraction and preconcentration of thermally instable analytes, ii) this method provides high rate of recovery while establishing low detection limit, and iii) using saturated salt in the proposed coacervative extraction method leads to avoid using large volumes of concentrated acid for extraction. Furthermore, this research showed that the use of experimental design gives rise to subsequent advantages in terms of required labor time and the number of experiments to optimize the condition of experiments for
Table 6. Tolerance Limits of Foreign Ions when Determining 40 ng ml-1 of Cu(II)
Foreign ions Tolerance ratio
Pb2+, NH
4 +
, Cr3+, SCN-, PO43-, SO42-, Fe2+, Fe3+
Cl-, Mn2+, As3+, Al3+
Zn2+, Co2+, EDTA
Ag+, Cd2+, Ni2+, Hg2+
>1000
500
10
1
Table 7. Preconcentration and Spectrophotometric Determination of Cu(II) in the Spiked Water Samples by the proposed method
Recovery Found
Spiked
-0.0120 0.00
98.0% 0.0198
0.01
99.0% 0.0299
0.02
coacervative extraction and determination of Cu(II).
REFERENCES
[1] N. Şatıroğlu Ç. Arpa, Microchim. Acta 162 (2008) 107.
[2] H.I. Ulusoy, R. Gürkan, M. Akҫay, Turk. J. Chem. 35 (2011) 599.
[3] A. Shokrollahi, M. Ghaedi, S. Gharaghani, M.R. Fathi, M. Soylak, Quim. Nova. 31 (2008) 70; Z. Yurtman-Gündüz, O. Aydın-Urucu, E. Kök-Yetimoğlu, H. Filik, Maced. J. Chem. Chem. Eng. 32 (2013) 69.
[4] F.W. Oehme Toxicity of Heavy Metals in the Environment, Marcel Dekker, New York, 1978. [5] J.M. Moore, Inorganic Contaminants of Surface
Water, Springer Verlag, New York, 1991.
[6] P. Liang, J. Yang, J. Food Compos. Anal. 23 (2010) 95; J. Manzoori, Gh. Karim-Nezhad, Iran. J. Chem. Chem. Eng. 24 (2005) 47.
[7] M. Bahram, So. Khezri, Sa. Khezri, Curr. Chem. Lett. 2 (2013) 49; M. Bahram, N. Nurallahzadeh, N. Mohseni, J. Iran Chem. Soc. (2015).
[8] W. Liu, W.J. Zhao, J.B. Chen, M.M. Yang, Anal. Chim. Acta 605 (2007) 41.
[9] F.D. Depoi, F.R.S. Bentlin, D. Pozebon, Anal. Methods 2 (2010) 180.
[10] S.G. Silva, P.V. Oliveira, J.A. Nóbrega, F.R.P. Rocha, Anal. Methods 1 (2009) 68.
[11] T.G. Kazi, S. Khan, J.A. Baig, N.F. Kolachi, H.I. Afridi, A.Q. Shah, Anal. Methods 2 (2010) 558. [12] M. Pandurangappa, K.S. Kumar, Anal. Methods 3
(2011) 715.
[13] P.X. Baliza, L.S.G. Teixeira, V.A. Lemos, Microchem. J. 93 (2009) 220.
[14] M.A. Bezerra, R.E. Bruns, S.L.C. Ferreira, Anal. Chim. Acta 580 (2006) 251; A. Niazi, J. Ghasemi, A. Yazdanipour, Spectrochim. Acta A 68 (2007)
523.
[15] M.K. Purkait, S. Banerjee, S. Mewara, S. Das Gupta, S. De, Water Res. 39 (2005) 3885.
[16] M. Ghaedi, A. Shokrollahi, F. Ahmadi, H.R. Rajabi, M. Soylak, J. Hazard. Mater. 150 (2008) 533; X. Liu, X.H. Chen, Y.Y. Zhang, W.T. Liu, K.S. Bi, J. Chromatogr. B 856 (2007) 273.
[17] L.A. Portugal, H.S. Ferreira, W.N.L. dos Santos, S.L.C. Ferreira, Microchem. J. 87 (2007) 77. [18] M.A. Bezerra, M.A.Z. Arruda, S.L.C. Ferreira, Appl.
Spectrosc. Rev. 40 (2005) 269; A.S. Yazdi, Trends Anal. Chem. 30 (2011) 918.
[19] M. Bahram, S. Khezri, Anal. Methods 4 (2012) 384. F. Merino, S. Rubio, D. Perez-Bendito, J. Chromatogr. A 962 (2002) 1; D. Sicilia, S. Rubio, D. Perez-Bendito, Anal. Chim. Acta 460 (2002) 13; I.Y. Goryacheva, A.S. Loginov, T.N. Lavrova, M.A. Popov, J. Anal. Chem. 62 (2007) 411.
[20] D. Sicilia, S. Rubio, D. Perez-Bendito, N. Maniasso, E.A.G. Zagatto, Anal. Chim. Acta 392 (1999) 29. [21] I.Y. Goryacheva, S.N. A.S. Shtykov Loginov, I.V.
Panteleeva, Anal. Bioanal. Chem. 382 (2005) 1413; I. Casero, D. Sicilia, S. Rubio, D. Pérez-Bendito, Anal. Chem. 71 (1999) 4519.
[22] D.D. Stephan, J. Werner, R.P. Yeater, Essential Regression and Experimental Design for Chemists and Engineers, MS Excel add in Software Package, 1998-2001.
[23] I. Bulacov, J. Jirkovsky, M. Muller, R.B. Heimann, Surf. Coat. Technol. 201 (2006) 255; A.M. Siouf, R. Phan-Tan-Luu, J. Chromatogr. A 892 (2000) 75. [24] T. Lundstedt, E. Seifert, L. Abramo, B. Thelin, A.