A R T I C L E I N F O A B S T R A C T Article history :
Received: January 28, 2018 Revised: March 19, 2018 Accepted: March 28, 2018 Available online: April 25, 2018
Biomass is recognized as a potential source for sustainable production of fuels. Forestry residuals has been used for the small-scale production of biodiesel since early 1800s. However, the biofuel market has not been suitable in recent decades due to the pronounced drop in the worldwide price of petroleum. In addition, environmental issues, low reactor yield, and uncertainties in biomass feedstock have challenged process design engineers. Hence, extensive research has been reported to address these issues. Pyrolysis and gasification processes can produce a wide range of fuels, chemical, solvents, and other valuable products from biomass. Scholars attempted to optimize various operating parameters, find innovative approaches to increase the reaction yield, and develop novel product upgrading techniques such as bio-oil upgrading; yet, limited studies were focused on implementation of these methods for a multi-feed integrated biomass production plant. Recent findings have created the foundational blocks for design of high-tech integrated biomass conversion systems. This paper is focused on conceptual design and feasibility study of such systems incorporating the strategies and technologies at hand. The available biomass conversion technologies for different feedstocks are combined in this design. To this end, a new plant is designed and simulated in ASPEN PLUS simulator using ASPEN Economic Analyzer to perform an economic analysis. Techno-feasibility results suggest that this plant is not profitable even after incorporating the new technologies and optimizing the system.
© 2018 Ghanbari and Meda. This work is licensed under a Creative Commons Attribution-NonCommercial 4.0 International License.
. Keywords:
Biofuel
Feasibility Study Simulation
* Corresponding Author;
E. Mail: [email protected]
1. Introduction
iomass supplied a huge majority of the world’s energy and fuel demands in mid 1800s. With the beginning of the fossil fuel era and the onset of the “first oil shock” in the mid 1970s, however, biomass industry started to phase out in developed countries, and was realized by many governments and officials as a potential domestic energy source capable of reducing oil consumption and the concomitant
environmental issues (Fuels). For instance in Canada, biomass energy consumption was about 134,000 BOE/day (3%) in late 1970s, which was increased to 250,000 BOE/day (4.4%) by 1992 (Michael Hiete 2009).
Unfortunately, fixed carbon-containing materials renew themselves over millions of years to replenish petroleum or natural gas deposits (Klass 1998). Considering the today’s energy demand, humankind
B
Volume 6 (2018), Issue 02, 01-24
Journal homepage: www.aaasjournal.org ISSN: 2588-3801
Conceptual Design and Feasibility Study of a Multi-Feed Integrated
Biomass Conversion System
Saeed Ghanbari 1 and Venkatesh Meda 1 1Department of Chemical and Biological Engineering, University of Saskatchewan, SK, Canada.
cannot wait that long; hence, another approach is to convert CO2 in the atmosphere into synthetic fuels
and useful chemicals via development of fixed carbon supplies from renewable carbon sources. To this end, a convenient way is to reduce CO2 with hydrogen in order to produce methane and water as end products, as follows:
CO2 + 4H2 → CH4 + 2H2O [1]
Therefore, the core concept of renewable energy form biomass is growing through capturing of carbon from ambient CO2 and solar energy,
conversion of biomass to fuels and chemical, and then combustion and return of fixed carbon to the cycle during photosynthesis to the atmosphere as CO2. This statement can be equally interpreted that
all manufactured products from oil and gas industry can be produced from biomass feedstock (Klass 1998).
In recent years, that biomass energy is a substantial contributor to energy market has been acknowledged as an inevitable fact. Klass reported a grand total biomass energy consumption of 1,371,000 BOE /day in 1990 in the United States, which accounts for 3.3 % of primary energy consumption (Klass 1998). In another report form the U.S. Department of Energy, 2,026,200 BOE/day (4.8 % primary energy consumption) biomass energy consumption was reported as well. Municipal waste, wood/wood wastes accounted for 10 % and 84% of biomass energy use in 1990, respectively. Records in the literature strongly suggest that sustainable biomass energy consumption can be enhanced (Michael Hiete 2009).
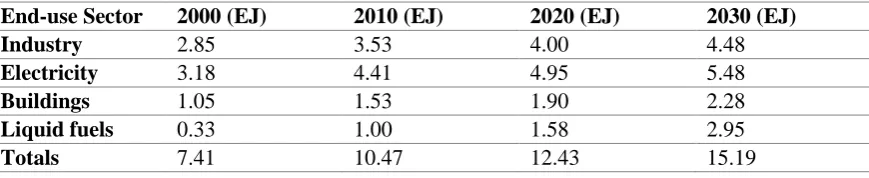
Many factors affect the market penetration of renewable energy from various biomass sources including energy demand, petroleum price, international and government policies, competitive feedstock, and the state-of-art in biomass net energy production-conversion industry. Table 1 shows the projected biomass energy contribution in the U.S. reported by the department of energy, in which the potential of biomass energy can be observed.
As for the global markets, 6.7 % of the world’s energy demand in 1990 was supplied by biomass (Fuels). This energy source and its related technologies have been significantly grown in most developing countries in Africa, South America, and Asia. Sixty two billion liters of biofuels were globally produced in 2007 (Klass 1998). Ethanol produced from fermentation of corn represents more than 50% of the ethanol production in the U.S., 38% in Brazil, 4.3 % in European Union, and 3.7 % in China (Fuels ; Klass 1998). In addition, as the results of a UN study suggest, jobs and employment potential in biomass renewable energy industries will be more than those in fossil fuels in 2030, where the projected investment of US$ 630 billion would result in at least 20 million jobs in this sector (Crocker 2010).
Although biomass energy and its market seem attractive, major barriers still must be overcome for large-scale production of fuels and chemicals worldwide (Klass 1998). The most critical barrier now is the low price of petroleum that made this market very competitive. As discussed in detail in his book, Crocker concluded that many large-scale integrated biomass conversion systems in the world were shut down due to sharp drop in the price of oil, as one of the main reasons (Crocker 2010). Concisely, with the advent of new technologies, strategies, and systems, the future of biomass energy industry seems promising, and it is very likely to overcome the current challenges.
for a non-woody gasification plant in South Africa. Selecting Methanol as the main product of this plant, they mentioned that the economics of the plant is dependent on the transportation costs per unit of biomass transported. In addition, it was concluded that technology development towards large-scale production is necessary for sustainable biomass production and transport (Amigun et al. 2010). In a later study in sub-Saharan Africa, potential of biomass for electricity production was investigated (Dasappa 2011). The authors did a techno-economic analysis and reported on the key barriers in energy production from biomass in sub-Saharan Africa. To be more specific, these barriers are resource mapping, capacity building, and technology demonstration. However, the authors concluded that using 30 % of agricultural and forest residues can supply power for a fraction of population that are deprived of electricity. In other studies, the potential of biofuel production in USA, Canada, and Brazil were investigated (Kang and Lee 2015; Soleymani and Rosentrater 2017). In their review paper, Kang et al. discussed the future of biofuels, especially ethanol production from sugars (Kang and Lee 2015). Soleyman et al. performed a techno-economic analysis on the production of biofuel from seaweed. Their results suggest that ethanol and electricity can be commercially produced if at least 3.7 million tonne (dry basis) of seaweed are supplied. In summary, it can be concluded that energy can be commercially produced worldwide if the technical barriers are overcome (Soleymani and Rosentrater 2017).
Commercial flowsheet simulators are very useful tools to perform techno-economic analysis, and have been widely used in recent decades (Abdelouahed et al. 2012; Akhlas et al. 2015; Eikeland et al. 2015; Fatoni et al. 2014; Hou and Hughes 2001; Mirmoshtaghi 2016; Rupesh et al. 2016). Naoko Ellis et al. used ASPEN PLUS to simulate their scaled up dual fluidized bed gasifiers (Dai et al. 2015). The authors developed and used a correlation to predict the yield of the gasifiers. Mirmoshtaghi focused her Ph.D. thesis on the modeling and simulation of fluidized bed gasifiers (Mirmoshtaghi 2016). She compared her simulation results with experimental data using the partial least square approach (PLS) and improved the accuracy of model predictions. In another studies, researchers used ASPEN PLUS to simulate combined CO2
capture and biomass gasification units (Abdelouahed et al. 2012; Rupesh et al. 2016). However, there is no studies available on the design and simulation of a plant that combines the available technologies together such as gas to liquid (GTL), biomass gasification, carbon dioxide capture, and bio-oils. In addition, most economic analysis done in the literature were small scale and based on many approximations such as the approximate conversion or heating value of gasification process. In this paper, the authors simulated the plant using a powerful flowsheet simulator and performed detailed economic analysis based on accurate mass and energy balance calculations. The correlations used in the ASPEN Economic Analyzer are based on historical plant data, which are very reliable. Furthermore, the idea of combining these
Table 1. Projected biomass energy contribution in the U.S. under a national premiums
scenario from 2000 to 2030 (Fuels).
End-use Sector 2000 (EJ) 2010 (EJ) 2020 (EJ) 2030 (EJ)
Industry 2.85 3.53 4.00 4.48
Electricity 3.18 4.41 4.95 5.48
Buildings 1.05 1.53 1.90 2.28
Liquid fuels 0.33 1.00 1.58 2.95
technologies into an integrated plant based on feedstock available in Saskatchewan has not ever been done. The results obtained from this work provides insights for further research in many areas in order to make renewable energy available for future generations.
2. Materials and Methods
2.1. Overview and Rationale of the Plant
Saskatchewan is ranked fifth out of ten provinces in total land area (651,036 km2), where 117,000 km2 of which is commercial forest zone (around one third), and 146,739 km2 of which is crop area and parries (Saskatchewan’s forestry sector final report 2016). According to the 2016 annual report from Saskatchewan Forestry Development Branch, the forest sector produces approximately 1.0 million ODT of biomass per year, either from the harvest of timber or as wood waste during the manufacturing process (Guidelines for bioenergy production 2016; Saskatchewan’s forestry sector final report 2016). Saskatchewan Scarp Tire Co. reported that 806,013 scrap tires were collected in Saskatchewan in 2016 for recovery purposes, which are a source of bioenergy (Annual Production numbers report 2016). In another report from Canada animal waste management committee, 17,866,750 tons of cattle manure were produced in Saskatchewan in 2016 (Canada Animal Waste Management Guide Committee report 1972). Close production numbers were also reported for the last two years. Comprising 3.2% of Canada’s population, the population of Saskatchewan is expected to increase as well as the industry development, energy requirement, food production, and air pollution. That said, sustainable green energy programs are highly appreciated and welcome by the government of Saskatchewan for food security, sustainable energy production, and the improvement of environmental problems. In this paper, the authors attempted to investigate the available bioenergy sources in Saskatchewan, and do a feasibility study of an integrated multi-feed
biomass conversion-production plant in the province. Figure 1 shows the overall scheme of this plant. Five different sources of biomass in the province were identified, selected, and analyzed: Agricultural residues, Forestry residues, Municipal Solid Wastes (MSW), Industrial wastes, and Virgin biomass. These units are represented as “waste biomass processing units” in Figure 1. Approximate production numbers of each biomass feedstock were collected from the government of Saskatchewan and related companies, and were used in the mass balance calculations in the simulator software. In addition, transport, storage, and handling of these feedstocks were analyzed. Virgin biomass (short rotating woody energy crops) were cultivated near the plant (shown as a box in Figure 1). Since this plant design is integrated, the heat and electricity requirements to run this part of the plant can be provided internally from the other parts of the plant (shown using arrows in Figure 1). Dimethyl ether (DME) and electricity are the final products of this plant.
The long-term plan of this feasibility study and design is sustainable production of fuels from available biomass in the province considering the current challenges such as biomass handling, competitive market, and low yield. DME is a versatile biofuel that can be used for power generation or combined with LPG or diesel. It is also feed for production of dimethyl sulfate, and is used as an aerosol repellant as well. Modified DME can be used as jet fuel as well (Rupesh et al. 2016). All units in this plant are designed based on a previously built commercial plant or successful pilot-plants. In the following sections, details of the design and results of this feasibility study are discussed.
2.2. Biomass Feedstocks In Saskatchewan
collected from Saskatchewan Ministry of Forest. Cattle manure production numbers were provided from Livestock Branch of Saskatchewan’s Ministry of Agriculture. Industrial wastes produced in the province include shredded tires (Shercom Industries Inc.), black liquor (Paper Excellence Co.), and Activated Sludge (Saskatoon Waste Water Treatment Plant). A feedstock factor of 75% is considered, and fuel degree biomass sources are
only considered in the simulation. The production numbers are summarized in Table 2.
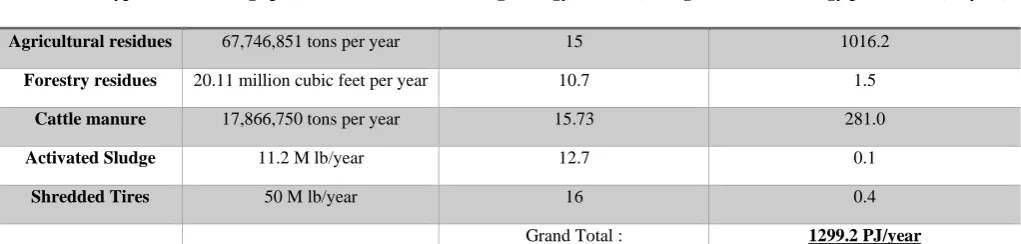
Using average energy content reported in the literature (Klass 1998), one can calculate the potential annual energy production from biomass available for this plant in the province (Table 2). According to Statistics Canada, 624,467 terajoules energy was consumed in 2003 in Saskatchewan. Potential energy production from biomass is
Figure 1. The overall scheme of the proposed design
Table 2. Summary of biomass feedstocks available in Saskatchewan and their energy content (Annual
Production numbers report 2016; Canada Animal Waste Management Guide Committee report 1972; Crop report 2016; Fuels ; Guidelines for bioenergy production 2016; Klass 1998; Saskatchewan’s forestry sector final report 2016).
Biomass type Average production number Average energy content (MJ/kg) Potential energy production (PJ/year)
Agricultural residues 67,746,851 tons per year 15 1016.2
Forestry residues 20.11 million cubic feet per year 10.7 1.5
Cattle manure 17,866,750 tons per year 15.73 281.0
Activated Sludge 11.2 M lb/year 12.7 0.1
Shredded Tires 50 M lb/year 16 0.4
considerably higher than this total energy consumption. It is worthy of note that the energy content is a function of moisture content, which is different for each type of woody biomass and agricultural residues. Hence, these numbers are only approximates. Accurate results are calculated from computer simulations (ASPEN PLUS).
2.3. Plant Design
The core idea of this design is to combined the current mature technologies into one integrated plant, and investigate if this plant would be profitable in Saskatchewan. Overall, in this plant, biomass is converted to syngas, and then liquid fuel is produced from syngas. To determine the capacity of this plant, the feedstocks available in the province that are suitable for energy production were firstly investigated. The design challenge is to determine the capacity of the plant using the production numbers of these feedstock and the conversion/yield of the technologies used in the design. These technologies are fischer tropsch reactors (GTL (Gas to Liquid)), biomass gasification in fluidized beds, carbon dioxide capture, pyrolysis reactors, and combined heat and power plants. The details of these technologies are provided later in this paper. This plant is designed to accept biomass feedstock from a variety of sources, which can be continuously supplied throughout the year. Five biomass conversion units are considered, which are designed based on existing commercial plants in the world, the details of which are presented in Appendix A. The purpose is to use the mature and reliable technologies available now. The plant is simulated in ASPEN PLUS in order to obtain mass and energy balance (capacity and energy requirement of the system).
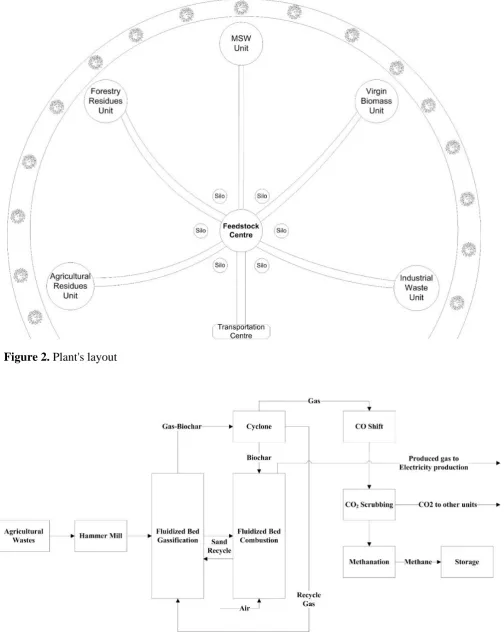
2.3.1. Plant Layout
Plant’s layout is illustrated in Figure 2. All biomass feedstocks are delivered to a “Feedstock Center” for preliminary analysis of moisture content, size
distribution, and composition. Enough storage silos are considered with a capacity of one month of feedstock for each unit (based on the capacity of each unit). The circumference of the plant is considered as virgin biomass cultivation area, in which short rotating woody crops (SRWC) will be cultivated. These plants, which are also known as “Energy Crop”, grow quickly, and are usually felled when they are 15 cm wide at chest height. In contrast to standard forestry crops that grow in 60 years or more, it takes 6 to 20 years to grow (Hinchee et al. 2011). Hence, SRWC are suitable candidates for bioenergy production.
Rotation length of 8-years is estimated for the SRWC. Therefore, the cultivation area will be divided into 8 equal sectors, and SRWC will be planted in each area every year. As such, each sector can be harvested after its rotation length (8 years), which supplies feedstock for the plant every year. The total required cultivation area is estimated based on the capacity of the Virgin Biomass Unit in the plant (Figure 2) using Alberta Agriculture and Forestry Decision Making tool. By following this 8-year cycle, continuous biomass feedstock can be supplied for the related unit in the plant.
2.3.2. Units Description
In their textbooks, Klass and Crocker reported on commercial and near-commercial biofuel plants in the world in great details (Crocker 2010; Klass 1998). These plants including their applied technologies were studied, and suitable systems for the available biomass feedstocks in the province were chosen. In what follows, these selected systems are explained here. The details are available in the Appendices.
Figure 2. Plant's layout
beds; hence, a hammer mill is used to reduce the particle size to below 6 mm. Cyclones are used to separate biochar from the produced gas. Biochar is recycled to the combustion bed, while a part of the produced gas is employed as medium gas to fluidize the gasification bed. In addition, combustion gas, which contains Nitrogen from air, is sent to other units for heat integration and electricity production. The temperature of gasification bed and combustion bed were controlled at 800 °C and 950 °C, respectively. It was reported that a medium-energy gas having a HHV of about 19.4 MJ/m3 were produced. This plant yielded 670 m3 of produced gas per ton of feed. This gas is further processed into high-energy methane gas (Klass 1998).
Bioenergy with carbon capture and storage (BECCS) system is considered for the gasification of woody biomass (Figure 4). Lime is used in the gasifier bed, which reacts with carbon dioxide. Calcium carbonate, which is the product of this reaction, is sent into the CO2 capture bed where it
decomposes to lime and CO2 again. This carbon
capture process improves the gasification process in terms of yield and thermal energy (Crocker 2010). The gas cleaning system and produced gas processing are similar to those of agricultural residues system.
ARBRE Energy Ltd Biomass Integrated Gasification/Gas Turbine (BIG-GT) system is considered for the Virgin Biomass unit (Figure 5). After size reduction and drying, the biomass feedstock is sent into the fluid bed gasifer using air (both medium and conveying gas). In the cracker, dolomite is used as the catalyst to convert tars to gases and lower molecular weight gases, which reduces the amounts of organics from the product gas, and minimizes water-treatment costs. The next stage is gas cooling using electrostatic precipitator and water quench systems. Afterwards, the produced gas is compressed and sent into gas turbines for electricity production. This hot gas is later used in the steam generation unit and the biomass dryer. Since the gas and steam turbines are not effected by scale up (Crocker 2010), gases from
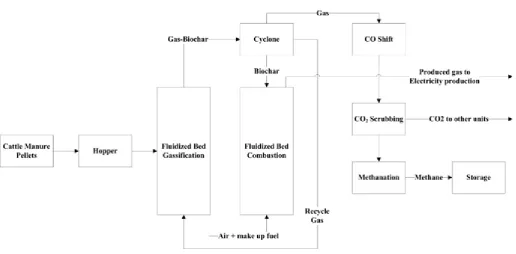
other units are also sent into this unit for electricity production in the gas turbine system. The system used for gasification of cattle manure is similar to that of agricultural wastes; however, the operating conditions are different. Readers can refer to Appendix A or the cited references for further details.
2.4. Simulation
This simulation was done using ASPEN PLUS software. The overview of main flowsheet and sub-flowsheets is available in Appendix B. RK-BM fluid package is used in biomass processing unit operations, while NRTL-RK fluid package is selected for distillation-stripper columns, and STEAM-TABLE is used in the combined heat and power generation (CHP) unit (Eikeland et al. 2015). Biomass is simulated as nonconventional inert solids (NCIS) in ASPEN PLUS, and ultimate, proximate, sulfanal analyses are used in order to simulate the gasification and pyrolysis reactions. These analysis were done by the authors for agricultural residues; while, the rest of the data is obtained from the literature. Bio-oil is simulated as a petroleum assay based on distillation curves, viscosity curves, and flash data reported in the literature.
FORTRAN statements and subroutines are used for simulation of these units based on correlations and reaction yields reported in the literature (Abdelouahed et al. 2012) (see Appendix B). The conversions of biochar, and bio-oil are calculated using FORTRAN subroutines. For other reactions, the reaction kinetics reported in the literature are used in the subroutines (see Appendix B).
Overall, syngas is produced in the four different biomass conversion units. The produced syngas streams are mixed and sent into a CO shift unit (water shift reaction) in order to adjust the ratio of
hydrogen to carbon monoxide to 2, which is desired for DME production in the reactors. In the next step of the process, carbon dioxide is removed because excess carbon dioxide will negatively affect the
Figure 4. Block flow diagram of woody biomass unit with BECCS
reactor yields (water shift reaction). The carbon dioxide removal unit is simulated based on the well-established Tetraethylamine (TEA) absorption units applied in industry. The treated syngas stream is sent into the alcohol production unit where DME is produced and purified. The hot gas streams (temperature around 900 °C) produced in the biomass conversion units are sent into the combined heat and power (CHP) unit for heat recovery. Standard industrial steam generation procedure is considered in the CHP plant (Mokhatab and Poe 2012). Electricity is produced in a three-staged and two-staged steam turbines, a part of which is used for internal use.
The yield specified in the biomass conversion units are based on the values reported in the cited literature, which were based on available applied technologies in the past. Experimental data reported in the literature for the equilibrium reactions in the CO shift unit and DME reactors are incorporated in the from reaction kinetics in ASPEN PLUS (see APPENDIX B). The following combined three reactions take place in a single reactor to produce DME:
𝐶𝑂 + 𝐻2𝑂 ↔ 𝐶𝑂2+ 𝐻2 [2]
𝐶𝑂 + 2𝐻2 ↔ 𝐶𝐻3𝑂𝐻 [3]
2𝐶𝐻3𝑂𝐻 ↔ 𝐶𝐻3𝑂𝐶𝐻3 + 𝐻2𝑂 [4]
The DME product is purified in a distillation column, and unreacted reactants are recycled back to the reactor. In general, in this simulation, all units are simulated based on the experimental data available in the cited references, and the processes well-established in industry. ASPEN PLUS is used as a powerful simulator to execute mass and energy balance based on the assumptions, experimental data, and methodologies reported in the cited references. These methodologies were verified in previous simulations done in the cited references.
3. Results
In order to check for any computation errors in the simulation, it was run in three different computers
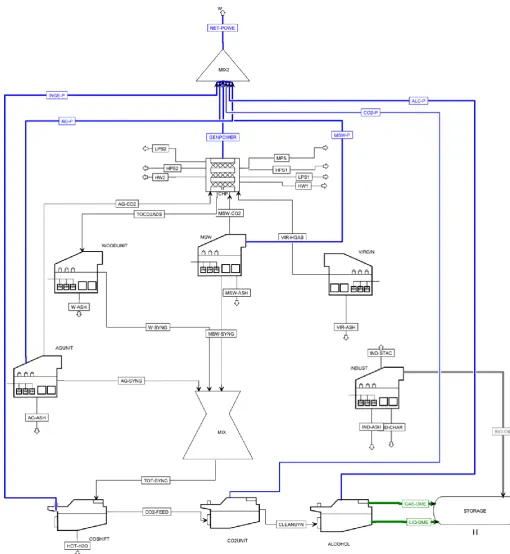
and the error in the final results was less than 5%. In the main flowsheet (Figure 6), five biomass conversion units, CHP, CO shift unit, CO2 removal
unit, DME production unit, and storage unit are shown. The green line represents the final DME products (liquid 96.8% purity, gas 99.1% purity), and the gray line represents the bio-oil product. Blue lines are power produced or consumed by the units. Figure 7 shows a larger image of the main process flow sheet. As can be seen, the syngas produced from the woody biomass, MSW, and virgin biomass units are sent into CO shift and alcohol production units, while the hot waste gases are sent into the combined heat and power (CHP) unit. In this unit, power and process utilities such as different grades of steam (HPS, MPS, LPS) and hot water are produced. These utilities were used for the internal needs of the plant.
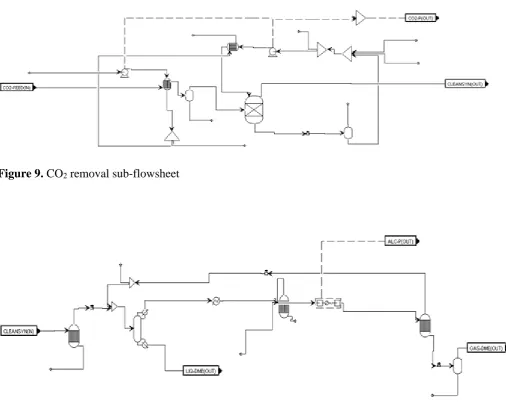
Figure 8 is an example of a biomass conversion unit sub-flowsheet. Biomass feed stream is sent into a dryer to remove the moisture. Then it is sent into two reactors modeled using FORTRAN subroutines. These two reactors are used to model the dual bed fluidized bed gasifiers. Air is compressed in a compressor and sent into the gasifier. Recycle streams are used combined with some heat recovery in other parts of the unit to optimize the design. Tetraethylamine (TEA) absorption unit is designed for CO2 removal unit (Figure 9). The design here is
Figure 7. Magnified image of the main process flowsheet; CHP: combined heat and power ; LPS: low pressure steam; HPS: high pressure steam; HW: hot water; MSW: municipal solid wastes; Woodunit: unit for the conversion of forestry residues to syngas; Virgin: unit for the conversion of virgin biomass to syngas.
Flash drums, and distillation columns are used to separate the main product from the other by-products. To recycle the unreacted methane, a methane reforming reactor is used to produced more syngas, which is then recycled back to the fischer tropsch reactor (Hou and Hughes 2001). Five percent of this recycle stream is purged (flared) to maintain the mass balance in the plant and avoid the accumulation of unwanted components in the reactor. For further details of other sub-flowsheets, the readers can refer to Appendix A and Appendix B.
According to the simulation results, 3.1 tons of DME per hour, 1397 kg of bio-oil per hour, and 9,735.1 MWh of electricity are produced in this plant. In general, biomass is converted to syngas. The ratio of H2/CO is adjusted to 2 in the CO shift
unit, which is suitable for DME production. Afterwards, excess carbon dioxide is removed, and the syngas is sent into two fischer tropsch reactors. Hot exhaust gases are sent into the CHP plant for electricity and steam production. Three classes of steam (HPS, MPS, LPS) and abundant amounts of hot utility water are produced, which are used for internal energy use.
3.1. Economic Analysis
ASPEN Economic analyzer module is used to perform a comprehensive economic analysis for this extensive simulation. Each unit operation is basically mapped with its cost estimation model/correlation in the software; hence, the equipment is sized, and the costs are reported. The results are summarized in table 3. As can be noticed, the plant is not economical due to remarkably high operating costs. A capital investment of 230.91 million USD and annual operating cost of 1.01 billion USD are estimated, while the total sales income is 162.13 million USD. The annual operating cost is much larger than the total annual sales income (profit = 162.13 – 230,910 million USD). Due to the enormous production capacity of the plant, the capital investment can be
returned shortly; however, this large capacity resulted extraordinary high operating costs, which would be expected in plants with solid processing and CHP units. The break down of the project total capital cost is also given in Table 3.
4. Discussion
The simulation of the new plant is converged and a techno-economic analysis is performed. It can be noticed that the plant is not profitable even though that several technologies are combined to improve the process. Solid processing is expensive, and lead to a very high operating cost. Usually a module factor of 1.5 is considered in the economic analysis. However, these factors are automatically adjusted in ASPEN Economic Analyzer for each solid processing unit in the simulation.
High operating cost is the main factor that currently hinders the biofuel industry from further development. Even though this plant design is optimized and combined with heat and power production and integrated biomass units, it is not economically feasible. One can conclude from this study that further research in this area is highly required. Modern methods with lower operating costs, automated systems with fewer operating problems, and superior control systems must be further explored and studied.
efficiency, which will definitely enhance the economics of combined heat and power plants. In this study, various sources of biomass in the Saskatchewan province including their production numbers were identified and obtained. Based on these findings, proper conversion system and technology were selected for the five different biomass feedstocks used in the designed plant. The results suggest that 1299.2 PJ energy can be approximately produced every year. Considerable amount of biomass is produced in the province, which has the potential of energy production. The required technologies are available as well; hence,
an integrated biomass conversion plant can supply a significant amount of province energy demand. Afterwards, the plant was simulated in ASPEN PLUS in order to obtain mass and energy balance and to perform an economic analysis, and optimize the system. The results showed that this plant is not economical due to high operating costs. Solid processing is known for its associated technical difficulties. Additional cost factor of 1.5-3 suggested in the chemical plant design textbooks is an indicator of this fact. Additionally, a great portion of operating cost is treatment of syngas and purification of the DME product because of low
Figure 9. CO2 removal sub-flowsheet
yields and selectivity in biomass conversion units and DME reactors. Ash management and odor management (cattle manure) spell technical problems for this plant, which must be taken care of in accordance to guidelines provided by the Ministry of Environment. The fouling of heat exchangers and solid-gas separation units due to tars, biochars, and fly ash is another issue in this system. Temperature control, electrostatic prevention methods, surface coating, and spare units are common methods usually applied in such systems.
The unreliability of biomass conversion systems is known as the number one challenge in these
systems. The close scrutiny of most plants that were previously built and placed in operation in the world reveals that most of them encountered technical and operating problems, which were unexpected. More specifically, various composition of produced gas from gasifier, low yields, unstable bio-oil, fouling and difficulties with tars and biochars are some of the highlights. In addition, the competitive price of gasoline made this market very challenging. Constant feed is critical in running a steady-state chemical plant. In the case of biomass conversion plants, it can hardly be assumed that every batch of feed is identical. From an engineering perspective,
Table 3. Economic Analysis Summary; Project capital cost, operating cost, product sales on the left side of
the table; Detailed project capital investment in terms of equipment, instrumentation, and other costs on the right side of the table.
INVESTMENT PROJECT CAPITAL DETAILS
Total
Cost Currency
Total
Cost Currency
Total Project Capital Cost 230.91 MM USD Purchased Equipment 121.96 MM USD
Total Operating Cost 1,014.19 MM USD/Year Equipment Setting 5.12 MM USD
Total Utilities Cost 930.93 MM USD/Year Piping 22.92 MM USD
Total Product Sales 162.13 MM USD/Year Civil 4.01 MM USD
Total Operating Labor and
Maintenance Cost 5.23 MM USD/period Steel 0.43 MM USD
Operating Charges 0.30 MM USD/period Instrumentation 5.28 MM USD
Plant Overhead 2.61 MM USD/period Electrical 3.45 MM USD
Subtotal Operating Cost 939.07 MM USD/period Insulation 2.86 MM USD
Paint 0.27 MM USD
Other 42.32 MM USD
Subcontracts 0.00 MM USD
G and A Overheads 6.04 MM USD
Contract Fee 5.87 MM USD
Escalation 2.00 MM USD
this is very challenging because the operating costs, product yields and conditions are strong function of biomass feedstock. The multi-feed approach with higher plant capacity was not successful as well because the plant’s operating and capital costs seem to vary exponentially with capacity. That said, advanced design and robust control/management are essential.
5. Conclusions
In conclusion, this research study shows that bioenergy can be produced from biomass; however, the process is not economical. In addition, this study indicated that further research in this area is essential. Biomass is a major source of clean energy and can supply a major part of province energy demand. Novel processes with lower operating costs and superior automated control systems must be studied. Recently, pressure swing adsorption process has been conceived to be an effective process for CO2 removal. This process is easier to
control, and both the capital and operating cost are much lower than those of TEA absorption process. In addition, very limited studies on advanced catalysts for gasification and pyrolysis reactions were published in the literature. Higher yield in those units would eliminate a considerable part of operating costs, and capital costs in downstream units, especially CO shift and CO2 removal. That
said, research on this area is highly appreciated and needed.
Conflicts of Interest: The authors declare no conflict of interest.
References
Abdelouahed L, Authier O, Mauviel G, Corriou J-P, Verdier G, Dufour A (2012) Detailed modeling of biomass gasification in dual fluidized bed reactors under Aspen Plus Energy & Fuels 26:3840-3855
Akhlas J, Ruggerib F, Bertuccoa A (2015) Simulation of Steam Gasification of Coal with PreCombustion enabling Cleaner Coal Conversion CHEMICAL ENGINEERING 43
Amigun B, Gorgens J, Knoetze H (2010) Biomethanol production from gasification of non-woody plant in
South Africa: Optimum scale and economic
performance Energy Policy 38:312-322
Annual Production numbers report (2016).
Saskatchewan Scrap Tire Co,
Canada Animal Waste Management Guide Committee report (1972).
Crocker (2010) Thermochemical conversion of biomass to liquid fuels and chemicals. Royal Society of Chemistry,
Crop report (2016).
Dai J, Saayman J, Grace JR, Ellis N (2015) Gasification of woody biomass Annual review of chemical and biomolecular engineering 6:77-99
Dasappa S (2011) Potential of biomass energy for electricity generation in sub-Saharan Africa Energy for Sustainable Development 15:203-213
Eikeland MS, Thapa R, Halvorsen B (2015) Aspen Plus Simulation of Biomass Gasification with known Reaction Kinetic
Fatoni R, Gajjar S, Gupta S, Handa S, Elkamel A Modeling Biomass Gasification in a Fluidized Bed Reactor. In: Proceedings of the 2014 international conference on industrial engineering and operations management. Bali, Indonesia, 2014. pp 7-9
Fuels CtRtRDSfB-DEaBT Review of the Research Strategy for Biomass-Derived Transportation Fuels. Canada
Guidelines for bioenergy production. (2016). www.bioenergyadvice.com.
Hinchee M et al. (2011) Short-rotation woody crops for bioenergy and biofuels applications. In: Biofuels. Springer, pp 139-156
Kang A, Lee TS (2015) Converting sugars to biofuels: ethanol and beyond Bioengineering 2:184-203
Klass DL (1998) Biomass for renewable energy, fuels, and chemicals. Academic press,
Mamphweli NS, Meyer EL (2009) Implementation of the biomass gasification project for community empowerment at Melani village, Eastern Cape, South Africa Renewable Energy 34:2923-2927
Michael Hiete JL, Christian Bidart, Frank Schultmann Challenges for Sustainable Biomass Utilization. In: Proceedings of the Chilean-German Biociclo Workshop Karlsruhe, Germany, 2009.
Mirmoshtaghi G (2016) Biomass Gasification in Fluidized Bed Gasifiers
Mokhatab S, Poe WA (2012) Handbook of natural gas
transmission and processing. Gulf professional
publishing,
Purohit P (2009) Economic potential of biomass
gasification projects under clean development
mechanism in India Journal of Cleaner Production 17:181-193
Rupesh S, Muraleedharan C, Arun P (2016) ASPEN plus modelling of air–steam gasification of biomass with sorbent enabled CO 2 capture Resource-Efficient Technologies 2:94-103
Saskatchewan’s forestry sector final report (2016).
Soleymani M, Rosentrater KA (2017) Techno-Economic Analysis of Biofuel Production from Macroalgae (Seaweed) Bioengineering 4:92
Appendix A
Block Diagram of Units and System Description
Most of commercial, near-commercial, and pilot-plant systems including their applied technologies were studied, and suitable systems for the available biomass feedstocks in the province were chosen. In what follows, these selected systems are briefly explained.
In the agricultural residues unit, a twin-fluidized bed is used, in which sand is used as the heating medium for the gasification bed, while heat is supplied by combustion of biomass (Figure A1). Sand is recycled continuously between the two beds. The size distribution of biomass feed is critical in fluidized beds; hence, a hammer mill is used to reduce the particle size to below 6 mm. Cyclones are used to separate biochar from the produced gas. Biochar is recycled to the combustion bed, while a part of the produced gas is employed as medium gas to fluidize the gasification bed. In addition, combustion gas, which contains Nitrogen from air, is sent to other units for heat integration and electricity production. The temperature of gasification bed and combustion bed were controlled at 800 °C and 950 °C, respectively. It was reported that a medium-energy gas having a HHV of about 19.4 MJ/m3 were produced. This plant yielded
670 m3 of produced gas per ton of feed. This gas is further processed into high-energy methane gas. Bioenergy with carbon capture and storage (BECCS) system is considered for the gasification of woody biomass. As can be seen in Figure A2, lime is used in the gasifier bed, which reacts with carbon dioxide. Calcium carbonate, which is the product of this reaction, is sent into the CO2 capture
bed where it decomposes to lime and CO2 again.
This carbon capture process improves the gasification process in terms of yield and thermal energy (Klass 1998). The gas cleaning system and produced gas processing are similar to those of agricultural residues system.
ARBRE Energy Ltd Biomass Integrated Gasification/Gas Turbine (BIG-GT) system is considered for the Virgin Biomass unit (Figure A3). After size reduction and drying, the biomass feedstock is sent into the fluid bed gasifer using air (both medium and conveying gas). In the cracker, dolomite is used as the catalyst to convert tars to gases and lower molecular weight gases, which reduces the amounts of organics from the product gas, and minimizes water-treatment costs. The next stage is gas cooling using electrostatic precipitator and water quench systems. Afterwards, the produced gas is compressed and sent into gas turbines for electricity production. This hot gas is later used in the steam generation unit and the biomass dryer. Since the gas and steam turbines are not effected by scale up (Klass 1998), gases from other units are also sent into this unit for electricity production in the gas turbine system.
The system used for gasification of cattle manure is similar to that of agricultural wastes; however, the operating conditions are different (Figure A4). Activated sludge unit is designed based on Oil From Sludge (OFS) pilot plant built in Toronto, Canada in 1993 (Figure A5). Biomass is dried using the exhaust gas from the combustor, pelletized, and then sent into the pyrolysis reactor. The heat of reaction is provided from the exhaust gas. The mixture of gas and bio-oil is sent into a separation system including gas condenser, water scrubber, and disk centrifuge. Heavy and light bio-oil products were directly sent into boilers for steam and electricity production. This system incorporates an on-site wastewater treatment plant in order to treat the wastewaters. The treated water is then sent into the praries to be used for virgin biomass cultivation.
Figure A1. Block flow diagram of agricultural wastes unit
Figure A3. Block flow diagram of virgin biomass unit
Figure A5. Block flow diagram of industrial wastes unit
Figure A6. CHP unit ASPEN flowsheet
Plant location
The location of plant is mark with a “X” mark in Figure A7 and A8. The rationale for this decision is the distance to major woody biomass sources (mills and wood production companies), agricultural/crop districts (A8, B8, A9, and A5), and access to water (Saskatchewan River).
Appendix B
Table B1. An example of Proximate and Ultimate analyses data used in the simulation (Rupesh et al. 2016)
Wood pellets
Volatile matter (wt %)
Moisture content
(wt %)
Fixed Carbon
(wt %)
Ash content
(wt %)
Proximate
Analysis 50 4.87 49.7 0.3
C H O N S
Ultimate
Analysis 50.14 6.14 43.33 0.08 0.01
Table B2. Conversion correlation used in the reactor for biochar (Abdelouahed et al. 2012)
product a b C
CH4 -4.341e-5 10.12e-2 -51.08
H2 1.362e-5 -2.517e-2 12.19
CO -3.524e-5 9.770e-2 -24.93
CO2 3.958e-5 -9.126e-2 64.20
C2H4 -6.873e-5 14.94e-2 -76.89
C2H6 8.265e-6 -2.105e-2 13.38
C6H6 -3.134e-5 7.544e-2 -42.72
C7H8 -4.539e-6 0.687e-2 1.462
C6H6O 1.508e-5 -3.662e-2 22.19
C10H8 -8.548e-6 1.882e-2 -9.851
H2O 5.157e-5 11.86e-2 84.91
Mass yields of pyrolysis products as a function of operating temperature (in Kelvin): aT2+bT+c.
Table B3. Reaction rates used in the simulation (Eikeland et al. 2015)
Reactions Reaction rate
C(s) + H2O → CO + H2
CO +H2 → C(s) + H2O
𝑟 = 1.272 + 𝑚𝑠∗ 𝑇 ∗ exp (
−22645
𝑇 )[𝐻2𝑂] 𝑟 = 1.044 ∗ 10−4∗ 𝑚
𝑠∗ 𝑇2 ∗ exp (
−6319 𝑇 − 17.29)[𝐻2𝑂][𝐶𝑂]
CH4 +H2O → CO + 3H2
CO + 3H2 → CH4 + H2O
𝑟 = 3.1005 ∗ exp (−15000
𝑇 ) [𝐶𝐻4][𝐻2𝑂] 𝑟 = 3.556 ∗ 10−3∗ 𝑇 ∗ exp (−15000
𝑇 )[𝐶𝑂][𝐻2]
2