IJHR
Open Access
Abstract
Background and Objectives: Accurate detection of type and severity of Hepatitis is crucial for effective treat-ment of the disease. While several computational algorithms for detection of Hepatitis have been proposed to date, their limited performance leaves room for further improvement. This paper proposes a novel computational method for the diagnosis of Hepatitis B using pattern detection techniques.
Methods: Clinical data of healthy individuals and those suspected of Hepatitis B were collected from the laboratories of Vasei Hospital in Sabzevar (Iran). Using the algorithm, first, data were normalized, then SVM classifier was used for detection of Hepatitis B, and finally, adaptive FCM was applied for measuring the severity of the disease.
Findings: Application of the algorithm to plenary database yielded 98.36%, detection accuracy, 98.44% sensitivity, and 94.06% specificity.
Conclusions: Low PPV and high NPV of the proposed method indicate its high reliability for use in practical diag-nosis of Hepatitis B and its severity.
Keywords: Hepatitis B; Chronic Hepatitis; Acute Hepatitis; Diagnosis; Artificial Intelligence; Data Mining; Support Vector Machines (SVM); Fuzzy C-Means (FCM)
Background and Objectives
Hepatitis is the inflammation of the liver, which is com -monly known as jaundice [1]. Most people suffering from Hepatitis types B and C do not have any symptoms [2]. When a person becomes infected with Hepatitis, his/her liver becomes inflamed. The virus destroys the normal tis -sue and, at the end, only the fibrous worn-out tis-sues will remain [3]. More than 40% of the human population has been infected with the Hepatitis B virus (HBV) worldwide, giving rise to 240 million chronic HBV carriers and ca. 620,000 HBV-associated deaths annually [4].
Since the detection of Hepatitis B virus as the cause of Hepatitis, many high-sensitive measurement meth-ods have been developed [5]. The increasing
prog-ress of medical sciences has made it difficult to make clear diagnosis decisions about the disease, espe-cially given the inefficacy of the conventional methods and techniques in medical diagnosis. The emergence of PC-based analyzers and the relevant software can increase the accuracy of medical diagnoses, so that they are now convenient and reliable tools in making an accurate diagnosis on the diseases.
Some of these techniques include statistical meth-ods, machine learning, intelligent systems, data anal-ysis and data mining [6]. To resolve medical diagno-sis problems, classifier systems have been proposed and used. Therefore, a variety of classifying methods were applied to USI database to obtain an accurate and high-speed system, a couple of which will be dis-cussed here. Various intelligent methods have been employed for the diagnosis of Hepatitis. The first was proposed by Eason et al. [1]. They used Linear De-tection Analysis (LDA) and ANFTS to detect Hepatitis
A Novel Algorithm for Accurate Diagnosis
of Hepatitis B and Its Severity
Khosro Rezaee
1*, Javad Haddadnia
2, Mohammad Rasegh Ghezelbash
31 Biomedical Engineering Student, Biomedical Engineering Group, Department of Electrical and Computer Engineering, Hakim Sabzevari University of Sabzevar, Sabzevar, Iran 2 Biomedical Engineering Group, Department of Electrical and Computer Engineering, Hakim Sabzevari University, Sabzevar, Iran 3 Department of Neurobiology, Care Sciences and Society (NVS), Karolinska Institute, Stockholm, Sweden
et al. [8] suggested a counseling system called DAN-FIS for quick diagnosis of Hepatitis; the disease infor-mation were organized in a tree structure divided into two branches, namely positive or negative Hepatitis, which could help in diagnosis of the disease. Jilani et al. [9] proposed a system based on NN and PCA for the detection of Hepatitis, which comprised of two stages: first, qualities were extracted using PCA tech-niques; then the categorization was made by using NN. The accuracy of this system was 99.13% and 100% for training and testing the data, respectively. Uttreshwar et al. [10] employed an automatic system for Hepatitis B diagnosis using Fuzzy deduction and generalized regression NN. It comprised of disease detection using an intelligent system along with the prediction of its development stage by NN. Also vari-ous kinds of NNs with different specifications have been used for the diagnosis of diseases such as Hep-atitis [11].
A huge burden of research has been done through NNs and fuzzy system for diagnosis of Hepatitis B [12, 13]. Furthermore, the authors [14] present a hy-brid method based on SVM combined with Simulated Annealing (SA) that is one of the optimization meth-ods in evolutionary algorithms for Hepatitis diagno-sis. The method uses the same datasets, used by the previous studies [15, 16]. By using multi-layer NN with Levenberg marquardt training algorithm [17], the approximate accuracy of 92% was obtained. Model-ing Hepatitis C with different types of virus Genome was proposed by Moneim et al. [18] using mathemati-cal patterns, which was a different approach to detect Hepatitis C. Kedziora et al. [19] demonstrated that Phylogenetic trees and Hamming distances best re-flect the differences between HCV populations pres-ent in the organisms of patipres-ents responding positively and negatively to the applied therapy [9].
Methods
A typical pattern recognition system includes four parts: feature extraction, feature selection, design and train-ing of classifier, and ultimately, the results. To convert or modify data, one method or technique out of several available options (depending on the type of data) should
versity Clinic. The data consisted of 350 samples, of which 114 cases had Hepatitis B, including 93 acute and 21 chronic cases, and 236 were healthy subjects. Ten features (inputs) were used to determine the type of Hepatitis and four to detect the stage of Hepatitis B. Table 1 displays 14 features of the database for five subjects.
Proposed Algorithm
The proposed system (algorithm) was organized as shown in Fig. 1. It is an acknowledged fact that database normalization generally yields better results. After normal-izing the data in the range [0-1], classification and cluster -ing methods are applied.
SVM Classifier Training
verti-by dividing the absolute value of the parameter b verti-by w. The main idea is to select a suitable separator, which has the maximum distance from the neighboring points in both classes. This answer shares the largest bound-ary with the points related to two different classes, and can be bounded with two parallel super surfaces, passing through at least one of the two points.
These vectors are called “support vectors”. Mathe-matical formulas of these two parallel super surfaces, which constitute the separating boundary, have been shown in Eqs. (1) and (2) indicating the first super surface and second super surface, respectively:
(1) (2)
Another important point is that if the training data is in form of linearly resolution, the two border super surfaces can be chosen with no data between them.
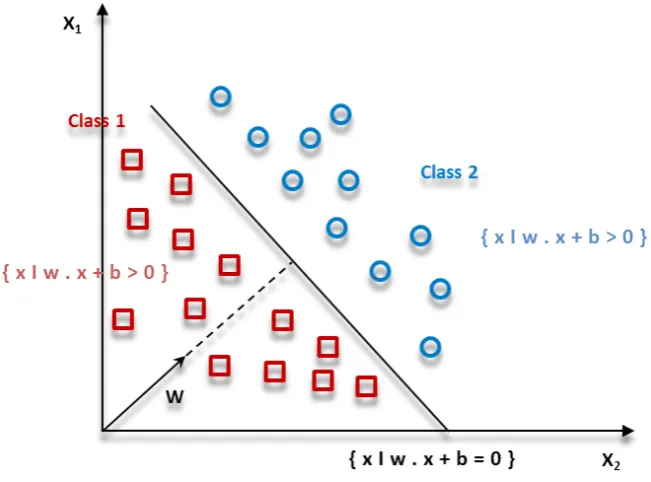
Then it maximizes the distance between these two parallel super surfaces. By applying geometry theo-rems, the distance between these two super surfaces gets equal to |w|/2. Thus, the |w| should be mini-mized. Moreover, data points should not be situated on the inner boundary area. For this, a mathematical limit was added to the formal definition. As can be seen, there are multiple lines providing a solution for the problem in Fig. 3.
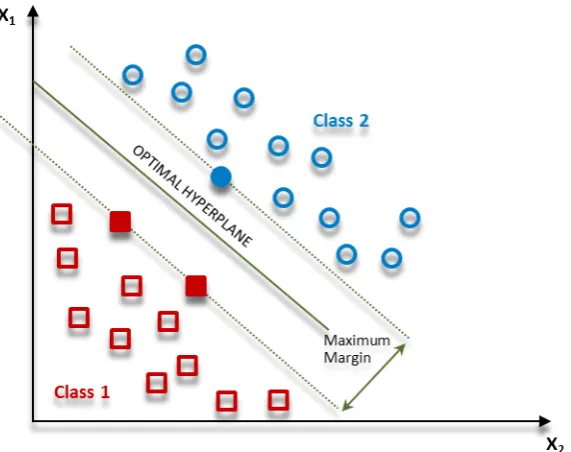
A line would be unsuitable if it passes too close to the points, because it will be noise sensitive and will not be generalized correctly. Therefore, our aim should be to discover the line passing as far possible as from all the points. Hence, the function of SVM algorithm is based on discovering the hyper plane that gives the largest minimum distance to the training of Hepatitic and non-Hepatitic cases. The SVM theory is formed based on this distance. We can maximize the margin of the train-ing data of Hepatitic and non-Hepatitic cases by optimal Figure 1 Implementation stages of the proposed algorithm for detection of Hepatitis
separating of the hyper plane. For two classes of data such as Hepatitis, which are shown in Fig. 3, we use SVM algorithm, and consequently, the optimal hyper plane will be detected as in Fig. 4.
The optimal hyper plane is introduced based on Eq. (3), which is used to define formally a hyper plane [22]:
(3)
In this equation, β is s the weight vector, β0 is the bias and x predicates the training cases closest to the hyper plane. The optimal hyper plane can be rep-resented in an infinite number of different procedures Figure 3 Multiple lines offering a solution for the problem
by scaling of β and β0. One best way faced with the constraint is defined as (4):
(4)
In general, the training cases closest to the hyper plane are called “support vectors”. This is known as the canonical hyper plane. We use the result of ge-ometry that gives the distance between a point x and a hyper plane (β, β0):
(5)
For the canonical hyper plane form, the numerator is equal to one, and the distance to the support vec-tors is as
.
The margin, denoted as M, is twice the distance to the closest cases equal to
.
Finally, the problem of maximizing M is equivalent to the problem of minimizing a function L (β) subject to some constraints.
The constraints model is a requirement for the hy-per plane to classify correctly all of the training cases xi. Formally:
(6)
Where, yi indicates each of the labels of the train-ing cases. As a special feature, SVMs simultaneously minimize the empirical classification error and maxi-mize the geometric margin. The effectiveness of SVM Figure 5 Implementation of SVM algorithm to separate patients from healthy subjects
depends on the selection of kernel, the kernel param-eters, and soft margin parameter C. The Gaussian kernel is a common choice, which has a single param-eter γ. The best combination of C and γ is often se -lected by a grid search with exponentially growingse-quences of C and γ, for example,
and
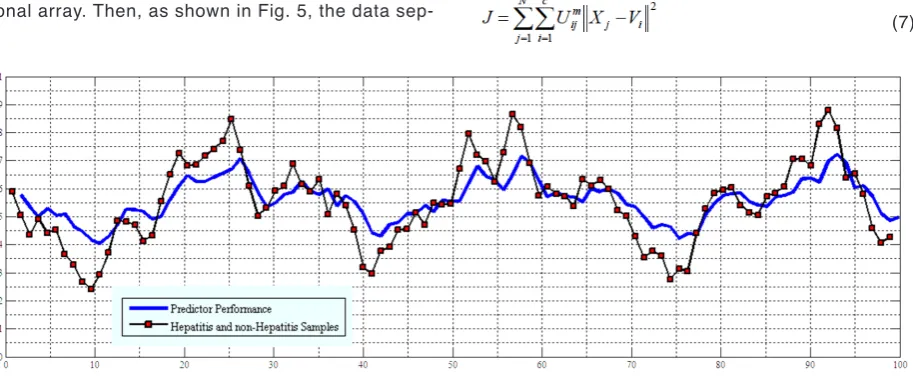
The final model used for testing and classifying new data is then trained on the whole training set using the selected parameters to find Hepatitic and non-Hepatitic cases [23]. To simulate SVM in this study, MATLAB software (Version 7.14) was used. Given the above point and the fact that the classifi-cation is done for two classes, i.e. Hepatitis B and healthy subjects, all data were put in a two-dimen-sional array. Then, as shown in Fig. 5, the data
sep-arates the Hepatitis B patients and healthy subjects using SVM. After determining the data related to the individual patients, these data are again positioned in a two-dimensional array.
Adaptive FCM Clustering
Clustering is one of the most important training methods without supervision. A cluster is a series of corresponding data. In clustering, the aim is to divide the data into clusters with data in each cluster having the maximum resemblance with each other, and mini-mum similarity with the data in other clusters. FCM clustering method is very useful in various clustering-related issues. Considering X as the sample, the aim of FCM is to minimize the Cost function (7):
(7) Figure 7 ROC curve for the SVM and FCM techniques in the test and training data
Where, c is the number of clusters, m is the degree of fuzziness, and V is the initial center for each clus-ter. Also, the degree of allocation of each data to the desired cluster according to (8) is calculated through the membership function as follows:
(8)
The value of new centers for each cluster according to (9) is calculated as below:
(9)
These steps are repeated until the difference be-tween Us (the degree of data allocation to each clus-ter) in the new stage and Us in the previous step level is less than a threshold value. In traditional FCM, the results are not close to the reality, when different vec-tors not the same contribution to the cluster.
To improve the performance of FCM, initial clus-ter cenclus-ters are selected in another way. The clusclus-ter sample of FCM algorithm [24] [25] is very sensitive to the number of cluster centers; the cluster centers’ ini -tialization often artificially get significant errors, and even may get the actual opposite results. The de-tailed procedure of this algorithm is shown in Table 2.
Results
To test the diagnosis of Hepatitis B in 350 samples col-lected from the database of Sabzevar, cross validation was used in which 10% of the samples were test data, and the rest were training data. This procedure was re-cycled until all data were tested. SVM or RBF kernel (with radius equal to 1, error penalty for class 1 equal to C = 50
and for class -1 equal to C = 10) was used. Overall, the proposed algorithm has the following properties:
• Increased accuracy of the performance • Negligible average error
• Reduced user intervention
• Suitable stimulator for Hepatitis disease
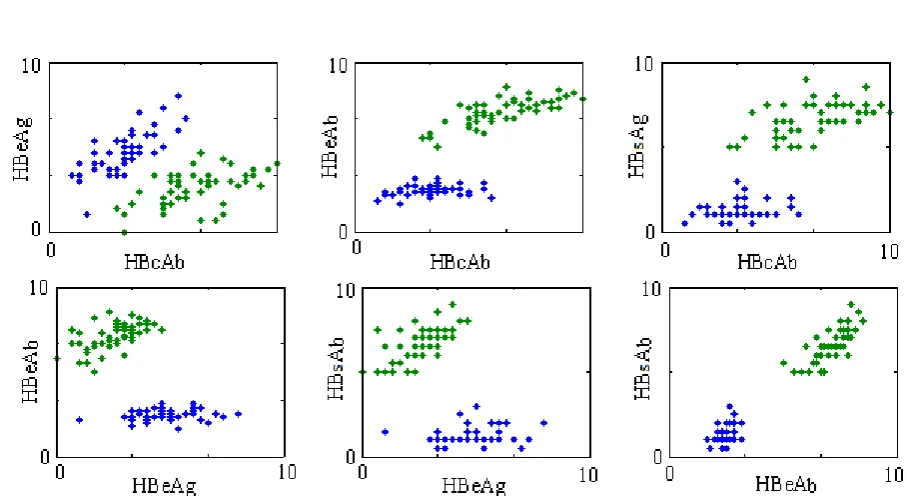
To test the severity of Hepatitis B, 114 samples from the database of Hepatitis B patients were se-lected. To determine the stage of disease in Hepa-titis B patients, adaptive FCM clustering was used. This sample included four features, including HBsAb, HBeAg, HBeAb, and HBsAb. Fig. 6 represents the ratio of features in true clustering. In this figure, the ratio of features has been calculated to determine which features are in the clustering with higher preci-sion. Fig. 7 presents ROC curves for the proposed system in SVM technique in training and testing con-ditions. The ratio of the first and second features in true clustering is not very significant, and the data sets are relatively similar. In other features, however, including first to third, first to fourth, second to third, second to fourth, and third to fourth, the data have been classified into two clusters with high accuracy. As shown in the above figure, the ratio of the second and fourth features in the true clustering of data is not so effective, because the data sets are very similar. However, in other cases, including first to third, first to fourth, second to third, second to fourth and third to fourth, data have been classified into two clusters with high accuracy.
Performance Measurement Criteria
Four criteria are used for determining the performance of Hepatitis diseases detector:
Balanced mean of accuracy and sensitivity (F-Measure): According to Equation (7), this means the measurement of system performance using accuracy and sensitivity:
(7)
Accuracy (AC): According to equation (8), this
means summing up of true positive and negative rates of the received samples during the system test:
(8)
Confidence coefficient of performance (Kappa): Kappa coefficient indicates confidence in the perfor-mance of a system):
(9)
Area under the ROC curve (Az): This factor also
indicates the performance of system, and its high rate shows the proportion of sensitivity and specificity, and consequently high relative accuracy. This area can be calculated for the patients using point sensitivity and specificity:
(10)
In these equations, NTP is the number of retina im-ages in which there is no pathological tissue, and the software has correctly diagnosed the retina tissue as healthy. NFN is the number of retina images in which there is no pathological tissue but the software has not correctly diagnosed the pathological tissue of retina. NTN is the number of retina images in which there is pathological tissue, and the software has correctly di-agnosed the pathological tissue of retina. NFP is the number of retina images in which there is no pathologi-cal tissue; however, the software has correctly diag-nosed the tissue of retina as unhealthy. Finally, TP and TN are the ordered lists of unique vessel and
non-ves-ing and testnon-ves-ing the SVM and FCM techniques have been calculated. To test the detection of Hepatitis severity in 114 samples, cross validation method was used in which 10% of samples were test data, and the rest were training data; this procedure was recycled until all data were tested. The final factors of accuracy, sensitivity and specificity were calcu-lated after classifying and clustering as 98.36%, 98%.44 and 94.09%, respectively.
Discussion
To evaluate the proposed algorithm with the results of previous studies, a comparison of system perfor-mance in terms of accuracy has been shown in Table 4. It is to be noted that the new database is different from that used in previous studies in terms of data number. Moreover, in the new database, some clinical symptoms have been removed due to their insignifi-cant effect. The comparison of the proposed system with the previous ones involves only the detection of Hepatitis, and there is no precedent for detecting the severity of Hepatitis. In comparison with valid tech-niques, the performance of our proposed algorithm is acceptable. However, Kappa coefficient is not high, but low PPV and high NPV of the system are a war-ranty of the system, and both the clinical specialist and the patients can trust the software and its output. Altogether, the ROC of SVM classifier and FCM clus-tering method show the capability of system to detect Hepatitis B and measure its severity.
pa-Conclusions
An algorithm for detecting the type and severity of Hepatitis was proposed. In this algorithm, first, the samples collected from database were normalized at [0-1] range, where classifier and clustering were trained based on the data subsets. In SVM technique, the accuracy was in the range of 90%-99% for the trained data, and 89%-97% for tested data. After iden-tifying Hepatitis B, FCM algorithm was implemented on the Hepatitis B sample to determine the severity of the disease. By assigning the degree of allocation to each sample, this algorithm created two clusters; one related to acute cases and the other to chronic ones. The current system increases speed and accu-racy of diagnosis, and offers reliable results based on software analysis.
Abbreviations
Competing Interests
The authors declare no competing interests.
Authors’ Contributions
Acknowledgements
References
1. Eason G, Noble B, Sneddon IN. On certain integrals of Lipschitz-Hankel type involving products of bessel func-tions. Philosophical Transactions of the Royal Society of London A: Mathematical, Physical and Engineering Sci-ences 1955, 247(935):529-51.
2. Shariati S, Haghighi MM. Comparison of anfis neural network with several other ANNs and Support Vector Machine for diagnosing hepatitis and thyroid diseases. In: Computer Information Systems and Industrial Man-agement Applications (CISIM), 2010 International Con-ference on: 8-10 Oct. 2010 2010; 2010:596-99.
3. Guan P, Huang DS, Zhou BS. Forecasting model for the incidence of hepatitis A based on artificial neural net-work. World J Gastroenterol 2004, 10(24):3579-82. 4. Ott JJ, Stevens GA, Groeger J, Wiersma ST. Global
epi-demiology of hepatitis B virus infection: New estimates of age-specific HBsAg seroprevalence and endemicity. Vaccine 2012, 30(12):2212-19.
5. Shibata H. The history of hepatitis B virus-related de-termination tests and inspection and the measurements of problems in Japan. Rinsho Byori 2013, 61(9):846-51. 6. Polat K, Güneş S. Hepatitis disease diagnosis using a
new hybrid system based on feature selection (FS) and
artificial immune recognition system with fuzzy resource allocation. Dig Sig Process 2006, 16(6):889-901. 7. Rouhani M, Haghighi MM. The Diagnosis of hepatitis
dis-eases by support vector machines and Artificial neural networks. In: Computer Science and Information Tech-nology - Spring Conference, 2009 IACSITSC ‘09 Interna-tional Association of: 17-20 April 2009 2009; 2009:456-58.
8. Dogantekin E, Dogantekin A, Avci D. Automatic hepatitis diagnosis system based on Linear Discriminant Analysis and Adaptive Network based on Fuzzy Inference Sys-tem. Expert Sys Appl 2009, 36(8):11282-86.
9. Jilani TA, Yasin H, Yasin MM. PCA-ANN for classification of Hepatitis-C patients. Int J Comput Appli (0975–8887) 2011, 14(7).
10. Uttreshwar GS, Ghatol AA. Hepatitis B diagnosis us-ing logical inference and generalized regression neu-ral networks. Advance Computing Conference, 2009 IACC 2009 IEEE International: 6-7 March 2009 2009; 2009:1587-95.
11. Sheikhan M, Ghoreishi SA. Application of covariance matrix adaptation–evolution strategy to optimal control of hepatitis B infection. Neural Comput Appli 2013, 23(3-4):881-94.
12. Madhusudhanan S, Karnan M, Rajivgandhi K. Fuzzy based ant miner algorithm in datamining for Hepati-tis. In: Signal Acquisition and Processing, 2010 ICSAP ‘10 International Conference on: 9-10 Feb. 2010 2010; 2010:229-32.
13. Neshat M, Yaghobi M. Designing a fuzzy expert system of diagnosing the hepatitis B intensity rate and compar-ing it with adaptive neural network fuzzy system. Pro-ceedings of the World Congress on Engineering and Computer Science 2009, 2:797-802.
14. Sartakhti JS, Zangooei MH, Mozafari K. Hepatitis dis-ease diagnosis using a novel hybrid method based on support vector machine and simulated annealing (SVM-SA). Comput Meth Prog Biomed 2012, 108(2):570-9. 15. Çalişir D, Dogantekin E. A new intelligent hepatitis di
-agnosis system: PCA–LSSVM. Expert Sys Appli 2011, 38(8):10705-08.
16. Chen H-L, Liu D-Y, Yang B, Liu J, Wang G. A new hybrid method based on local fisher discriminant analysis and support vector machines for hepatitis disease diagnosis. Expert Sys Appli 2011, 38(9):11796-803.
17. Bascil MS, Temurtas F. A study on hepatitis disease diagnosis using multilayer neural network with leven-berg marquardt training algorithm. J Med Syst 2011, 35(3):433-6.
18. Moneim IA, Mosa GA. Modelling the hepatitis C with different types of virus genome. Comput Math Methods Med 2006, 7(1):3-13.
tion: Springer; 2009.
23. Hsu C-W, Chang C-C, Lin C. A practical guide to sup-port vector classification technical resup-port department of computer science and information engineering. National Taiwan University, Taipei 2003.
24. Suresh K, Madana Mohana R, Rama Mohan Reddy A, Subramanyam A. Improved FCM algorithm for Cluster-ing on Web Usage MinCluster-ing. In: Computer and Manage-ment (CAMAN), 2011 International Conference on: 2011. IEEE; 2011:1-4.
25. Esmaili Torshabi A, Riboldi M, Imani Fooladi AA, Modarres Mosalla SM, Baroni G. An adaptive fuzzy pre-diction model for real time tumor tracking in radiotherapy via external surrogates. J Appl Clin Med Phys 2013, 14(1):4008.
26. Polat K, Güneş S. Prediction of hepatitis disease based on principal component analysis and artificial immune recognition system. Appli Math Comput 2007, 189(2):1282-91.
27. Neshat M, Sargolzaei M, Nadjaran Toosi A, Masoumi A. Hepatitis disease diagnosis using hybrid case based reasoning and particle Swarm optimization. ISRN Artifi-cial Intelligence 2012, 2012:6.
Please cite this article as: