Volume 2, 2018, Pages 118–133
SUMO 2018- Simulating Autonomous and Intermodal Transport Systems
Generating activity based, multi-modal travel demand for
SUMO
J. Schweizer
1, F. Rupi
1, F. Filippi, and C. Poliziani
Dept. of Civil, Environmental, Chemical and Materials Engineering (DICAM) - University of Bologna, [email protected]
Abstract
This article explains a travel demand generator developed within the SUMOPy frame-work which aims at providing person-based plans for the SUMO micro-simulator. The plan generation has four principal steps: 1.) a population needs to be generated, with specific attributes for each person; 2.) activities and their associated locations need to be identified, 3.) travel plans need to be generated, with the aim to connect the various activities in an efficient manner. 4.) A microsimulator determines the effective travel times for each plan which persons can use to modify or change their plan. In a first part, this article briefly describes other software packages which allow activity based demand models. It is further explained that the use of SUMO as microsimulator is particularly suited to evaluate multi-modal travel plans.
The article then focuses on SUMOPy’s activity based demand model and in particular on the population synthesizer, plan generation and plan selection step. SUMOPy’s activity based demand framework has two distinguishing features: 1.) the time travel budget can be controlled during the population synthesizing process; 2.) The concept of abstract mobility strategies – each person may have different feasible plans, following different mobility strategies. The SUMO micro-simulator is used to evaluate the effective travel time of plans for the entire population. Regarding the plan selection method, a method is described if and how persons change plans based on the the effective travel times experienced after each simulation run. It is shown by means of a synthetic network and a realistic city network that the proposed algorithm is converging and total travel times are decreasing after each simulation run until an equilibrium is reached. Some preliminary attempts were undertaken to improve the speed of convergence. For both of the analyzed networks an equilibrium has been reached after approximately 10 simulation runs.
1
Introduction
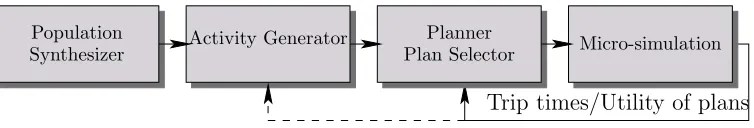
In the past, different approaches to implement activity based demand models have been studied. A general flow-chart of the modeling process is shown in Fig. 1: The population
Population
Synthesizer Activity Generator
Planner
Plan Selector Micro-simulation
Trip times/Utility of plans
Figure 1: General activity based demand generation framework.
synthesizer generates a population with characteristics that match the statistics of the study area (car/bike ownership, driver license, employment, household information, etc.). Different data sources can be used in combination to generate the person’s attributes.
The activity generator defines the activities for each person, including location and ex-ecution time intervals. Some activities may have sharply defined start time intervals, others are more flexible. Also the activity location may be retrieved from geo-referenced land use information, from OD-matrices or GPS traces.
Theplanner generates one or several mobility plans for each person. The mobility plan is in general a chain of different transport modes that satisfy the sequence of a person’s activities respecting all space- and time constraints. In some approaches, the activity generations and plan generation are combined [5] in one process.
In amicro-simulationrun, all person are simulated for a specific time period, which is usually a day. The micro-simulation delivers precise plan execution times (or delays with respect to the start time of activities). The evaluation of results is also called “scoring”. In a feed-back loop, these times can be used to adapt or improve plans. Instead of simple travel times, different scoring quantities can be taken into account, such as delays with respect to a planned activity, monetary costs or mode specific attributes, that indicate the users preference for a certain mode.
In the literature these principal modeling processes have been implemented in very differ-ent ways, using differdiffer-ent software packages. In this work, a novel, activity based modeling framework is presented which uses SUMO as micro-simulator engine. The algorithms are now part of SUMOPy [10]. SUMO offers the possibility to simulate interactions between persons and between all vehicle types [6]. This means the door-to-door trip times of persons can be determined more realistically, taking into account dynamic interactions such as waiting time of pedestrians and cyclists at crossings and traffic lights, walking from one bus-stop to another and waiting for the next bus, etc. The demand model is applied to two different transport networks and the equilibrium solution of plan-choices is demonstrated.
2
A brief overview on activity based simulation software
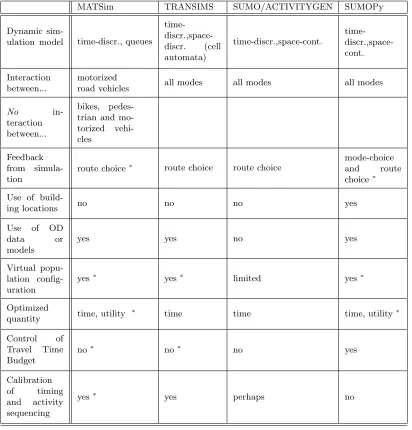
This is a brief description of other open source activity based modeling frameworks. Not covered are commercial activity based software and microsimulators, such as VISSIM from PTV, Cube from Citylabs or Paramics. In Sec. 2.4 a brief comparison of the software frameworks are presented and compared to SUMOPy’s activity based model, which will be further detailed in this article.
2.1
MATSim
MATSim (Multi-Agent Transport Simulation) is an activity based microsimulation system for daily transport demand analysis [1]. MATSim follows a modular approach and includes all components shown in Fig.1, all of which can be adapted and modified individually. Different methods of plan generators have been studied, see [8] for an example with plan generation and modification using genetic algorithms. Regarding the micro-simulator, network-links are modeled as FIFO queues and updated each (simulated) second. An extended queue version, where vehicle gaps can back-propagate is also available. MATSim’s road model is much simpler than the one of SUMO, where save distances between vehicles are taken into account. But due to the fast simulation execution, MATSim is able to conduct analyses for large scenarios, even concerning a whole country [9].
Originally MATSim’s link queues were only available for cars. In recent developments, a public transport network has been added as well as links for bikes and pedestrians. However, bikes, pedestrians and public transport are kind of in parallel to the road network and do not interact with the road vehicles in the queue links. It is argued that this is not necessary because pedestrian and bicycle links have no capacity issues.
2.2
TRANSIMS
The open source simulator TRaffic ANalysis SIMulation System (TRANSIMS) [7] is a micro simulator with activity based demand models. TRANSIMS, which was initially developed by Los Alamos National Lab (LANL), has four functional components or modules: (1) Population Synthesizer; (2) Activity Generator; (3) Router; and (4) Micro- simulator. The model begins by creating a synthetic population based on census and land use data. The Activity Generator then creates an activity list for each synthetic traveler, based on a classification tree built from survey trip diary data. The Router then computes combined route and mode trip plans to accomplish the desired activities. Finally, the Micro-simulator simulates the resulting traffic dynamics using a cellular automata model, yielding detailed, second-by-second trajectories of every traveler in the system over a 24-hour period.
In an example application [14] TRANSIMS has been used to predict travel behavior and traffic flows in case of a severe snow storm in the region of Buffalo, USA. The conclusion of the study is that the model could not be calibrated on a link by link flow comparison with field data, as the network has been inaccurate (connectivity and signal problems) and incomplete (smaller road types were missing). For this reason the model has been calibrated based on total hourly trip numbers.
2.3
ACTIVITYGEN
the sumo micro-simulator. It supports the activities work, school, and free time and the con-veyances walking, bike, car, and bus. In particular, ACTIVITYGEN can generate a SUMO route file based on the SUMO network file and a statistics file, describing the demographics of the city/area as input. ACTIVITYGEN requires the sumo network and some additional information that are provided in a single xml file:
• general statistical information on the city with inhabitants, number of households, car ownership, unemployment rate, child age- and retirement age limits, external traffic share.
• demographic information (age distribution).
• work hours with respective share of people working.
• population density and working position density must be defined for each network edge where demand is generated.
• city gates: these are network edges for which incoming and outgoing through traffic can be defined.
• schools with age of children and opening hours can be placed on arbitrary network edges.
• bus line services can be defined.
ACTIVITYGEN has been used to generate the demand for the Luxembourg scenario [4]. ACTIVITYGEN is a comprehensive generator, but the internal algorithms are not documented. In particular the choice of origin and destination is obscure and in any case not controllable.
Regarding the modeling process, for larger scenario it may be time consuming to provide the edge-by-edge population densities, work-positions and schools. Additional scripting may be required to read in from external data sources. On the other side, the virtual population configuration is currently limited. For example bike-ownership is not configurable even though this is essential for generating multi-modal trips.
2.4
Comparison of SUMOPy and other open source activity based
models
from survey data or models. On the other hand, the SUMOPy model needs further develop-ment such as the automatic generation of 24h scenarios, more multi-modal strategies and more sophisticated functions to evaluate the “utility” of a strategy. The optimization of the sequence with which activities are executed, for example by using genetic algorithms, turn out to be impractical for large scale simulations, as the number of necessary iterations is too high [14].
Table 1: Comparison of open source activity based simulation software. (∗= default value, but configurable)
MATSim TRANSIMS SUMO/ACTIVITYGEN SUMOPy
Dynamic
sim-ulation model time-discr., queues time- discr.,space-discr. (cell automata) time-discr.,space-cont. time- discr.,space-cont. Interaction between... motorized
road vehicles all modes all modes all modes
No
in-teraction between...
bikes, pedes-trian and mo-torized vehi-cles
Feedback from simula-tion
route choice∗ route choice route choice
mode-choice
and route
choice∗ Use of
build-ing locations no no no yes
Use of OD
data or
models
yes yes no yes
Virtual popu-lation config-uration
yes∗ yes∗ limited yes∗
Optimized
quantity time, utility
∗
time time time, utility∗
Control of Travel Time Budget
no∗ no∗ no yes
Calibration
of timing
and activity sequencing
3
SUMOPy activity based demand modeling
The SUMOPy activity based demand model is a framework that allows to generate plans and routes for the SUMO micro simulator, while the results of the simulator are used to modify routes and plans in a feedback loop. This framework provides tools to combine the flexibility of activity-based demand generation (similar to MATSIM) with the detailed dynamic simulation and interaction of persons and vehicles provided by SUMO.
The main features of SUMOPy’s activity based demand model can be summarized as follows:
• virtual population generators, allow to shape a desired population based on different sources of statistical data.
• the concept of mobility strategies have been developed to mimic a strategic thinking in the mobility choices of humans.
• the framework is expandable with new strategies, such as ride-sharing, use of autonomous vehicles etc.
• strategy selection methods which identify the best strategy for a person, based on esti-mates or based on experiences from microsimulation results in a feedback loop.
As mentioned before, themobility strategy is a central concept of the present framework. A strategy is not simply a choice of transport modes, but it is more similar to an abstract method which is applied to move a person in an urban environment.
SUMOPY further offers a GUI environment that allows to quickly visualize and analyze data, which is a must in order to verify and improve the simulation results.
SUMOPy is a modular structure that allows to implement methods that are adapted to the available data sources.
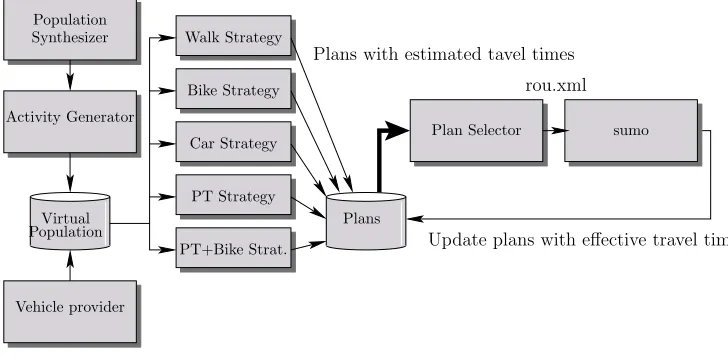
The present approach assumes that the available mobility options of a person is predeter-mined by the location of the activities, the possession of vehicles and other socio economic factors. In order to create an attribute-rich representative “virtual” population, some statisti-cal information about the population is required, such as the basic activity pattern, location of home and work/study place, vehicles possession (car, bike, motorbike), and the currently preferred mode. Most personal attributes are found by disaggregating statistical data in an appropriate way and by combining it with land-use information (for example from OSM build-ings). A further assumption is that people think strategically while planning: based on their personal characteristics, activity locations and availability of transport means, they will follow a so called “mobility strategy”. A person is generally able to adopt more than one strategy. However, it is assumed that each person will, at the end, select the best feasible strategy. The best feasible strategy can be identified in two phases: 1.) during the planning phase, where the required trip times is estimated for each strategy; in the present framework, each person makes one feasible plan for each strategy and initially picks the strategy with the lowest estimated trip time. 2.) after the execution phase, during which a person is actually experiencing real travel times, the person is changing to another feasible strategy or is happy with the experienced strategy. Clearly, the experience is performed during the SUMO microsimulation, see Fig. 2
Activity Generator
Virtual Population
Walk Strategy Population
Synthesizer
Plan Selector Car Strategy
PT Strategy
PT+Bike Strat. Bike Strategy
sumo
Vehicle provider
Plans
rou.xml Plans with estimated tavel times
Update plans with effective travel times
Figure 2: Processes of the SUMOPy activity based demand generation framework.
3.1
Virtual population synthesizing and activity generation
The virtual population synthesizing and activity generation consist in a simple disaggregation process where individual person attributes are generated from basic cumulative statistical infor-mation. The virtual population database contains socio economic data (occupation, number of children, household members, etc), activity patterns (e.g. home-work-home, home-study-home, home-school-work-shopping-home, etc) and the availability of vehicles (car, bike, motorcycle).
Each activity is characterized by its activity-type (home, study, work, school, shopping, leisure), by its facility (i.e. the building/place where the activity takes place), by the start time window and the minimum and maximum duration. The facility information are extracted from SUMO’s polycovert tool.
There are currently two methods implemented to generate the population and activity pat-terns:
Generate population from basic statistics: With this method, only the total population size, the average and standard deviation of their travel time budget and the current modal split are required. From this information both, the population and the activity pattern is generated: for each person a work-place facility is selected randomly, where larger facilities will be selected with higher probabilities. Then an individual travel time budget is drawn from a Gaussian random generator according to the predefined mean value and standard deviation. With a backward routing algorithm, all network edges and adjacent home facilities are identified such that the travel time equals the respective travel time budget of the person. From all home facilities, a home facility is picked randomly according to the size of the facility. In this way, the home and work-activities are determined. Note that this procedure can be improved in the future by including more home-search attributes such as the housing-prices.
population corresponds to the number of trips in the OD matrices. The activity types at origin and destination are guessed from the given trip purpose. The facility at origin is picked randomly from a facility inside the zone of origin, where larger facilities are picked more likely. The same procedure is used to pick a facility inside the zone of destination. The time range associated with the OD matrix is used to define the initial times of the activities. The mode associated with the OD matrix determines the currently preferred mode of the person.
Both methods are currently very basic and provide only an initial pair of activities. More sophisticated methods and a return-trip generation is under development.
The “Vehicle provider” is a simple algorithm to specify the ownership-share of cars, bikes and motorbikes based on ownership shares. Statistics on the ownership of vehicles is a reliable data source, in particular for motorized vehicles. The ownership of vehicles ultimately limits the feasibility of strategies that can be used to produce mobility plans.
3.2
Generating plans with mobility strategies
Each person can draw on a set of so called “mobility strategies”. A mobility strategy defines the method how each person solves his/her transport problem, e.g. how to connect the single activities in the specific activity pattern. In the present framework, a strategy can be thought as a method to draft a concrete plan which is in SUMO terminology a sequence of stages. A stage can be one of the following types: walk, ride (on a vehicle of any type), activity (do an activity for a predefined time). For walk and ride-stages, the routing can be either given explicitly by a route (sequence of edges) or implicitly (by providing edge and position of origin and destination). The currently implemented strategies can be summarized as follows:
Walk strategy: The person is always walking between activity facilities. More precisely, be-tween the nearest edges and edge positions of the respective facilities.
Car strategy: The person is walking to the (preassigned) parking of her/his (preassigned) car. Then the person is driving to the (preassigned) parking near the destination facility. Finally the person is walking from the parking to the destination facility.
Bike strategy: The person is cycling between activity facilities. In case the edge near a facility has no bike access, the person walks the distance between facility and nearest bike access.
Public transport strategy: The person walks from the first facility to the nearest public transport stop. At the stop, the person waits for a vehicle at the public transport line that brings her/him fastest to her/his destination. From the final stop she/he walks to the destination facility. There may be also intermediate transfers, where the person exits at a stop, walks to another stop (if necessary) and takes another public transport line.
Bike + Public transport strategy: This strategy is a combination between the Bike strat-egy and the Public transport stratstrat-egy. The person uses, is possible, the bike to reach the nearest public transport stop. Then she/he uses public transport. The last leg from public transport stop to final facility is again performed by bike, whenever possible. The cyclist will use a bike before and after the public transit stage. Currently there is no difference whether she/he will take the same bike in the public transport vehicle.
SUMO’s DUAROUTER software offers already inter-modal routing which could be used to generate the plans. Nevertheless, at present a different router has been developed for SUMOPy in order to control sThe current assignment of parking space has a simple assignment method: the more persons access a facility, the further away is the parking. It is not necessary to predefine manually special parking lanes or parking areas. Instead, an algorithm identifies all potential places for on-street parking. ome details of the routing process. However, in the future the DUAROUTER will be integrated at least for some partial routing.
In SUMOPy the plan generation and routing is strategy specific. For car and bike trips, a simple Dijkstra algorithm has been used, based on free flow travel times. For walking, the line of sight distance has been used for time estimations and routing is left to the SUMO simulator (only departure and arrival edges are defined). The routes of private cars start and ed at a parking space. The current assignment of parking space has a simple assignment method: the more persons access a facility, the further away is the parking. It is not necessary to predefine manually special parking lanes or parking areas. Instead, an algorithm identifies all potential places for on-street parking.
The routing between public transport stops is more complex: prior to the routing apublic transport graph is created, including all boarding and alighting links at stops, all stop-to-stop links of all public transport lines and all possible exchanges between lines at stop-to-stops. The associated link costs are assigned as follows: the cost of access links at stops correspond to the respective mean waiting time (half the time headway of a line); the costs of stop-to-stop links corresponds to the riding time of the public transport vehicle under free flow-travel times; the cost of transfer links correspond to the walking time necessary from one stop to another and the waiting time for the next line service. Once the public transport graph is defined, the Dijkstra algorithm identifies the sequence of public transport links that minimize (average) travel time.
3.3
Plan selection methods
As mentioned previously, the procedure is an iterative process with successive micro-simulation runs. The simulation of the traffic scenario, during which all persons and all vehicles interact, requires that each person is selecting just one plan (from all feasible plans). After the simulation, the effective time for the selected plan becomes known and for the successive simulation run each person must decide which plan to select, or whether to remain with the previous plan. In the current version only the total travel time is measured, in the future also other quantities may be used (such as delay times) to determine a general utility function.
After sufficient simulation runs, one can expect that all persons have experienced the effective travel times of all relevant plans and settle with the plan that offers the fastest travel time. Therefore, a suitable stopping criteria would be the number of changes after a simulation run i.e. to stop simulating if the number of committed changes falls below a certain threshold. It is also clear that if each person is trying to minimize its travel time then the total travel time tends to decrease with each simulation run (but not necessarily monotonically).
where ˆτi = ˆti+εi, ε is a zero mean-value normal random variable with standard deviation
σi=αˆti and ˆti estimated travel time of plani. These travel times are similar to the link-costs
of the Probit-type traffic assignment. After the first simulation run and after all subsequent runs, select randomly a fraction β of persons that change the plan; for those who change the plan, select the feasible plan that minimizes the noisy travel time ˆτi; at this stage, the noisy
travel time becomes ˆτi =ti+εi with the effective (simulated) travel timeti and σi =αti in
case the plani has been already simulated, and ˆτi = ˆti+εi in case plan i has not yet been
simulated.
The noise component has the effect that plans with similar travel times are all selected and experienced. In this manner, there is the possibility to obtain a more pronounced difference, once the similar plans are executed and the effective travel times become known.
4
Application examples and evaluation
The above described activity based demand model is demonstrated and evaluated for a synthetic city and a larger urban area in Bologna, Italy. The evaluation in the present work is limited to the analyses of the convergence and stability of the algorithms; that is, the share of used strategies have been observed over a certain number of simulation runs.
4.1
Spider city
A synthetic city with a spider-type road network layout has been used to show the convergence of the proposed algorithms. Footpaths have been added to all roads. Traffic lights at centralized nodes, bus stops and reserved bus lanes on the main arterial roads have been added manually, using the SUMO’s netedit, see Fig.3.
Figure 3: Synthetic city with some manually added bus stops and reserved roads for buses.
Buildings of different sizes have been generated randomly with a heuristic algorithm along all roads. The population of 10,000 people has been generated, using the virtual population generation method from basic statistics, as explained in Sec. 3. This means there are trips taking place only between two activities, home and work.
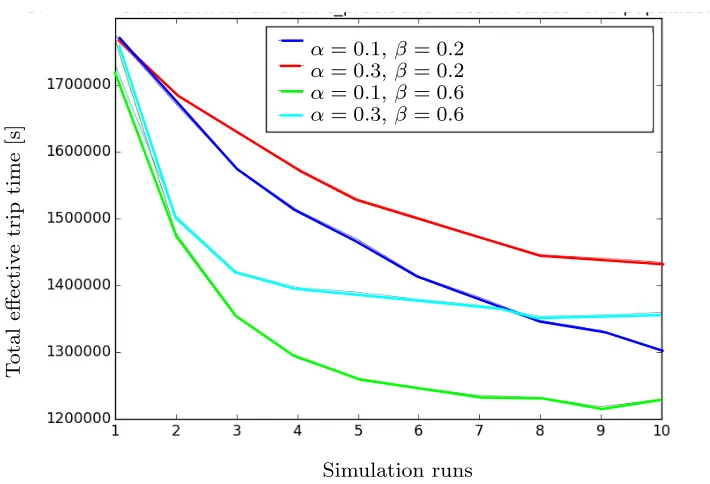
a noise amplification ofα). The results shown in Fig.4indicate that the fastest convergence is obtained for the values ofα= 0.1,β = 0.6, which means that 60% of the persons must attempt to change plans after each simulation run. It has further been shown that people who change plans are also decreasing: at equilibrium, most persons who attempt to change plans will find that the best new plan is in fact the old plan, or at least the effective time of the new plan is close to the old plan. Successively, the city has been simulated with 10,000 inhabitants and
Simulation runs
T
otal
effectiv
e
trip
time
[s]
α= 0.3,β= 0.6
α= 0.3,β= 0.2
α= 0.1,β= 0.2
α= 0.1,β= 0.6
Figure 4: Total effective travel time evolution over simulation runs in function of fractionβand noise amplifierαwith Spider network and 5000 people.
with the best selection parameters (α= 0.1, β = 0.6). Ten iterations have been repeated 10 times using different random seeds. The speed deviation factor has been 0.1 for cars and 0.2 for bikes and pedestrians. Figure5 shows the average share of strategy choices over the iteration steps. The 95% confidence intervals are also indicated in the figure. Initially many changes in strategy choices take place, because the initial plan selection is based on the estimated times. With each iteration, the effective travel time of alternative strategies are known to more people, having a consolidating effect, reducing the number of strategy changes.
4.2
Realistic urban area
0 1 2 3 4 5 6 7 8 9 Simulation
0.0 0.1 0.2 0.3 0.4 0.5 0.6
Modal share
AUTO
BIKE
TRANSIT
WALK
BIKE-TRANSIT
Figure 5: Share of selected strategies over simulation runs with Spider network and 10000 people. The thick lines represent the average values and the thin lines indicate the upper and lower boundaries of the 95% confidence interval.
Figure 6: Study area of Bologna, with zones for OD-demand; yellow= external centroids, green= internal centroids
external centroids) and an internal demand (trips between internal centroids). For the present test purpose the virtual population is performing only internal trips. This trip distribution is based on an all-to-all OD matrix and has been used to generate a population of 2,400 people. The majority of trips is generated by through traffic between external nodes (3,872 passenger car trips and 972 bicycle and moped trips). The through traffic is not part of the virtual population. External and internal trips have been adjusted to fit manual traffic counts at major intersections. Even though the virtual population (the internal traffic) does not contribute to the major share of the trips, it can lower or increase traffic congestion levels, dependent on the mobility strategy choices.
All public transport bus lines that exist in this zone have been implemented. Bus routes and time tables have been found on the TPER website [11], the body that manages public transport in Bologna. A dwell time of 20 seconds at all bus stops has been considered. The population has also been equipped with a realistic set of vehicles.
The scenario has been simulated iteratively with the best selection parameters from the previous section (α= 0.1, β = 0.6). Ten iterations have been repeated 10 times with diftper-ferent random seeds. Figure 7 shows the average share of strategy choices over the iteration steps, as well as the total travel times. The 95% confidence intervals are also indicated in the figure. One can can observe that the strategy shares change, while the average total travel time decreases over the iterations. The share of the auto strategy initially increases but decreases in successive iterations, while the bike strategy is constantly increasing. This behavior can be explained with congestion effects that occur when more cars are used: persons who experienced increased travel times from delays changed to the bike.
After approximately ten iterations, the strategy shares do no longer change. This number of iterations is in line with findings from studies with similar problems. For example in [12] the mode share has been stabilized after approximately 20 iterations, However, in the cited study, the network and number of traffic assignment zones have been considerably higher.
5
Conclusions
In this article, an activity based travel demand generator for SUMO has been proposed which is part of the SUMOPy software framework. There are already existing software packages to simulate activity based demand but, from all open source simulators, SUMO is the only one simulating the interaction between pedestrians, cyclists as well persons who can change means of transport by walking. As such simulations are close to reality, it is finally possible to show the relation between changes of infrastructure or transport system technology and the change of mode-choice, total travel time and consequently the change of environmental impacts. This means different future transport scenarios could be evaluated more reliably with respect to simulators which ignore such effects or average experience over traffic assignment zones. However, the calibration of activity-based models is challenging as precise, microscopic networks and transport services must be modeled.
0 1 2 3 4 5 6 7 8 9 Simulation
0.0 0.1 0.2 0.3 0.4 0.5 0.6 0.7
Modal share
AUTO
BIKE
TRANSIT
WALK
BIKE-TRANSIT
(a)
0 1 2 3 4 5 6 7 8 9
Simulation 1000000
1050000 1100000 1150000 1200000 1250000 1300000
Total time exec. [s]
Time_exec
(b)
It has been shown by means of a synthetic network and on a realistic city network that the proposed algorithm is converging and total travel times are decreasing during the iterations and settle in an equilibrium. In fact, both case studies showed a convergence after only 10 simulation runs, which is in the same order of magnitude compared with similar studies. The plan selection parameters have been optimized for speed up convergence, but more systematic studies are needed in order to guarantee rapid convergence for a general case.
It is clear that further, quantitative evaluations are necessary, such as the comparison of of estimated traffic flows with observed flows or the comparison of estimated travel times with observed travel times of single users. Regarding flow-comparisons, it is necessary that the ma-jority of trips are actually performed by members of the virtual population and not by external traffic participants, otherwise the change of mobility strategies will not cause a significant effect in travel time. This means the study area must be large enough in order to contain most of the population traveling within this area. However, the modeling of realistic and functioning micro-simulation networks of larger urban area is still a challenging task. Regarding the eval-uation of single trip times, it is possible to compare the simulated trips with recorded GPS traces of real person.
Better tools are necessary to extract microsimulation networks from OSM data and to enrich the network with information from other sources, such as traffic light programs or time tables of public transport. Travel plans and the timing of individual persons could also compared to the timing of GPS traces recorded by real persons. SUMOPy includes already tools to read GPS traces and to identify their route using map-matching procedures.
Future developments of SUMOPy’s activity based demand framework include: (1) an im-provement of the virtual population synthesizer by using more person attributes from various data sources during the plan generation and selection. (2) implementation of more strategies, such as auto+public transport, taxi or ride/bike sharing; (3) support of 24h multi-destination trip generation; (4) the integration of SUMO’s DUAROUTER as part of the plan generation; (5) the use of parameterized utility function to support a more realistic strategy selection; However, the latter does require calibration with realistic scenarios.
References
[1] M. Balmer, M. Rieser, K. Meister, D. Charypar, N.
Lefeb-vre, and K. Nagel. Matsim-t: Architecture and simulation times.
http://archive.matsim.org/uploads/121/matsim architecture and simulation times 4a4b4cfa4f.pdf. [2] J.L Bowman and M.E Ben-Akiva. Activity-based disaggregate travel demand model system with
activity schedules. Transportation Research Part A: Policy and Practice, 35(1):1 – 28, 2001. [3] E. Cascetta.Transportation systems engineering: theory and methods. Kluwer Academic Publisher,
Boston/Dordrecht/London, 2001. (Italian version available).
[4] L. Codeca, R. Frank, S. Faye, and T. Engel. Luxembourg sumo traffic (lust) scenario: Traffic demand evaluation.IEEE Intelligent Transportation Systems Magazine, 9(2):52–63, Summer 2017. [5] Milad Ghasri, Taha Hossein Rashidi, and S. Travis Waller. Developing a disaggregate travel demand system of models using data mining techniques. Transportation Research Part A: Policy
and Practice, 105:138 – 153, 2017.
[6] Daniel Krajzewicz, Jakob Erdmann, Michael Behrisch, and Laura Bieker. Recent development and applications of SUMO - Simulation of Urban MObility. International Journal On Advances
in Systems and Measurements, 5(3&4):128–138, December 2012.
on Ambient Systems, Networks and Technologies (ANT-2014), the 4th International Conference on Sustainable Energy Information Technology (SEIT-2014).
[8] M. Maciejewski and K. Nagel. Towards multi-agent simulation of the dynamic vehicle routing problem in matsim. In Roman Wyrzykowski, Jack Dongarra, Konrad Karczewski, and Jerzy Wa´sniewski, editors,Parallel Processing and Applied Mathematics, pages 551–560, Berlin, Heidel-berg, 2012. Springer Berlin Heidelberg.
[9] K. Meister, M. Balmer, F. Ciari, A. Horni, M. Rieser, R.A. Waraich, and K.W. Axhausen. Large-scale agent-based travel demand optimization applied to switzerland, including mode choice. In
12th World Conference on Transportation Research, Lisbon, 2010.
[10] J. Schweizer. Sumopy wiki, 2016. http://www.sumo.dlr.de/wiki/Contributed/SUMOPy. [11] TPER. Trasporto passeggeri emilia romagna. https://www.tper.it/.
[12] O. Verbas, H. Mahmassani, M.Hyland, and H. Halat. Integrated mode choice and dynamic traveler assignment in multimodal transit networks: Mathematical formulation, solution procedure, and large-scale application. 2564:78–88, 12 2016.
[13] SUMO Wiki. Activity-based demand generation. Technical report, DLR, Germany, 2017. http://sumo.dlr.de/wiki/Demand/Activity-based Demand Generation.