VOLUME 40, ARTICLE 6, PAGES 121
,
154
PUBLISHED 23 JANUARY 2019
https://www.demographic-research.org/Volumes/Vol40/6/ DOI: 10.4054/DemRes.2019.40.6
Research Article
Race/ethnic inequalities in early adolescent
development in the United Kingdom and United
States
Afshin Zilanawala
Laia Bécares
Aprile Benner
© 2019 Afshin Zilanawala, Laia Bécares & Aprile Benner.
This open-access work is published under the terms of the Creative Commons Attribution 3.0 Germany (CC BY 3.0 DE), which permits use, reproduction, and distribution in any medium, provided the original author(s) and source are given credit.
1 Introduction 122 1.1 Race/ethnicity differences in children’s socioemotional and
cognitive development
123
1.2 Comparative socioeconomic contexts for racial/ethnic group differences
125
1.3 Importance of early adolescence 127
1.4 Current study 127
2 Data 128
2.1 Measures 130
2.1.1 Socioemotional development 130
2.1.2 Cognitive development: Verbal skills/academic performance 131
2.1.3 Race and ethnicity 132
2.1.4 Covariates 132
2.2 Analytic sample 133
2.3 Planned analyses 133
3 Results 134
3.1 Race/ethnic variation in outcomes and explanatory factors 134 3.2 The effects of adolescent characteristics and sociodemographic,
cultural, and psychosocial resources for UK sample
136
3.3 The effects of adolescent characteristics and sociodemographic, cultural, and psychosocial resources for US sample
138
4 Discussion 140
Race/ethnic inequalities in early adolescent development in the
United Kingdom and United States
Afshin Zilanawala1
Laia Bécares2 Aprile Benner3
Abstract
BACKGROUNDComparative literature investigating race/ethnic patterning of children’s health has found racial/ethnic minority status to be linked to health disadvantages. Less is known about differences during early adolescence, a period during which health outcomes are linked to later life health.
OBJECTIVE
Using the UK Millennium Cohort Study (n = 10,188) and the US Early Childhood Longitudinal Survey–Kindergarten Cohort (n ~ 6,950), we examine differences in socioemotional and cognitive development among 11-year-old adolescents and the contribution of family resources in explaining any observed differences, including socioeconomic, cultural traditions, and psychosocial resources.
RESULTS
Adverse socioemotional health and cognitive development were associated with race/ethnic minority status in both countries. In the United States, we found that cultural resources and family socioeconomic capital played a large role in attenuating differences in problem behaviors between Asian American, Black, and Latino adolescents and their White peers. In the United Kingdom, the explanatory factors explaining differences in problem behaviors varied by racial/ethnic group. In both contexts, family resources cannot explain the sizable cross-country differences in verbal skills. In the United Kingdom, Indian adolescents had nearly one-third of a standard deviation increase in their verbal scores whereas in the United States, Black and Latino
1 University College London (UCL), UK and Oregon State University, USA.
adolescents had scores nearly two-fifths and one-fifth of a standard deviation below the mean, respectively.
CONTRIBUTION
We use a detailed race/ethnic classification in the investigation of racial/ethnic inequalities across the United States and United Kingdom. There are strong family resource effects, suggesting that relative family advantages and disadvantages do have meaningful associations with adolescent socioemotional and cognitive development. Although levels of resources do explain some cross-national differences, there appears to be a broader range of family background variables in the United Kingdom that influence adolescent development. Our findings point to the critical role of both the extent and nature of family social capital in affecting adolescent development.
1. Introduction
A burgeoning line of comparative research examining race/ethnic inequalities in children’s health in the United Kingdom (UK) and the United States (US) has confirmed that, across national settings, racial/ethnic minority status is associated with a variety of markers of children’s health. Evidence of cross-national racial/ethnic inequalities have been found for low birth weight (Teitler et al. 2007), body mass index (Zilanawala et al. 2015a), and cognitive development (Washbrook et al. 2012), with disadvantages observed for children from Black and Asian aggregate ethnic groups in the United Kingdom, and for Hispanic, American Indian, and Black children in the United States, when compared to White British/American children. To date, however, no international comparative study has examined racial/ethnic inequalities in early adolescence, a particularly salient developmental period given the influence in both countries of a myriad of academic, social, and biological stressors (Benner and Wang 2015), including the need to achieve a sense of coherent identity and the necessity of navigating school transitions. In addition, much of the extant comparative literature on racial/ethnic disparities has focused on children’s physical health, and we know less about race/ethnic patterning in young people’s socioemotional health, an important predictor of academic achievement (Currie and Stabile 2007) and overall well-being.
Socioemotional development is defined broadly as social, emotional, and behavioral problems, including externalizing and internalizing behaviors (Goodman 1997). Lastly, we examine the contribution of adolescent and family characteristics that could account for potential racial/ethnic differences in early adolescent development across sociodemographic, cultural, and psychosocial domains. By undertaking a cross-national, comparative approach, we are also able to determine whether the contributions of adolescent and family characteristics are similar across national settings.
1.1 Race/ethnicity differences in children’s socioemotional and cognitive development
Comparative literature on children’s mental health, child behavior, and cognitive development distinguishes differences between children of immigrant and native-born mothers instead of using detailed racial/ethnic classifications. Such crude categorizations have revealed inconsistent advantages and disadvantages. For example, in US and UK data examining 5-year-old children’s externalizing and internalizing behaviors, an immigrant advantage has been documented in externalizing behavior in the United States only, but immigrant disadvantages in internalizing behavior emerge in both the United States and United Kingdom (Jackson, Kiernan, and McLanahan 2012). Possible explanations focus on differing cultural beliefs and expectations between immigrants and natives and selection processes between families who migrate to the United States and United Kingdom versus those who remain in their home countries (Abraido-Lanza et al. 1999). A similar study investigating the same age group found no differences in child behavior between children of immigrant and native-born mothers in both contexts, but children of immigrants in the two countries performed more poorly on cognitive tests relative to their peers of native-born mothers (Washbrook et al. 2012). Parental language proficiency had important implications in explaining gaps between immigrant and native children.
their White peers in reading abilities in the United States, even after statistical adjustment for socioeconomic characteristics (Han, Lee, and Waldfogel 2012). Primary home language and parental English proficiency were highlighted as key family resources in accounting for differences in school readiness.
Relatedly, in a comprehensive analysis of a range of academic skills and behavior among US kindergarteners, Black and Hispanic children consistently underperform in math and reading skills, self-control, and approaches to learning (Reardon and Portilla 2016). By 5th grade, more than half of Asian American children were performing at the
highest levels for their group in reading achievement, whereas nearly three-quarters of African American children had reading skills that fell in the below average range (Davis-Kean and Jager 2014). The same study also found a considerable gap between high achieving Asian American children in math skills compared to their Hispanic and African American peers. In examining historical achievement gaps, a recent evaluation of the Black-White and Hispanic-White gaps in reading achievement found no evidence that gaps have narrowed for 9–10 year olds (Paschall, Gershoff, and Kuhfeld 2018). However, this study only examined one dimension of family resources, namely poverty status, to understand race/ethnic inequalities.
Turning to socioemotional health, Han, Lee and Waldfogel (2012) found fewer externalizing problems for Asian, Latino, and Mexican-origin children versus White children, more externalizing problems for Black versus White children, and fewer internalizing problems for other Asian and Mexican children versus White children. Moreover, during the elementary and middle school years, teachers and parents have consistently been found to rate African American children as having higher externalizing behavior than peers from other racial/ethnic groups (Keiley et al. 2000; Miner and Clarke-Stewart 2008).
average, and Indian children were above average across the first decade of life (ages 3 to 11), differences that were moderately explained by socioeconomic characteristics, cultural factors, and maternal mental health (Zilanawala, Kelly, and Sacker 2016).
UK studies focusing on adolescents suggest fewer socioemotional difficulties among most ethnic minority groups in the United Kingdom when compared to White children. For example, studies show an advantage for Indian and Pakistani children (Astell-Burt et al. 2012; Fagg et al. 2006; Goodman, Patel, and Leon 2010), Bangladeshi (Astell-Burt et al. 2012; Stansfeld et al. 2004) and Black African and Black Caribbean (Astell-Burt et al. 2012; Fagg et al. 2006) adolescents compared to their White peers in outcomes such as socioemotional health. However, such studies use wide age ranges, for example 5–15 years, making it difficult to disentangle whether more or fewer socioemotional difficulties emerge during adolescence, or if any ethnic variation exists during early adolescence. Given increased global migration and growing multicultural communities, we need a clearer picture of the level of psychosocial development and its associated risk factors among early adolescents across race/ethnic groups.
1.2 Comparative socioeconomic contexts for racial/ethnic group differences
light on which patterns in the United States can and cannot be generalized to other ethnic subgroups and national settings. Although racial/ethnic groups in the United Kingdom (e.g., South Asians, Black African, and Caribbean groups) are distinctly different from those in the United States, in which migrants dominate from Mexican and Latin American origin, racial/ethnic minorities in both countries tend to have lower socioeconomic status (Zilanawala et al. 2015a), a similarity that would result in racial/ethnic minorities in both countries having worse developmental outcomes than their White counterparts. However, differences in the motivations and historical periods of immigration and forced migration across and within national contexts could lead to expected differences across developmental profiles across race/ethnic groups.
In the United States, European Americans have historically been the largest racial/ethnic group, alongside presenting with considerable socioeconomic advantages and institutional control (McDermott and Samson 2005). In contrast, African American and Hispanic groups have experienced significant discrimination and injustice. Considerable evidence underscores racial/ethnic gaps in achievement in the United States, with marked disadvantages for African American groups compared to their European American peers, and worryingly these gaps are increasing (Fryer and Levitt 2004). Conversely, Asian American groups have often been characterized as the ‘model minority’ and have lower risk of marginalization (Lee 2015); however, their access to power and prestige is not equal to that of European Americans (Kim 1999). Relative to their ethnic minority peers, Asian American children present with advantages in mathematics, language, and reading in early childhood (Farkas 2003).
1.3 Importance of early adolescence
Insights from a life-course perspective inform our understanding of the saliency of adolescent well-being; health outcomes in adolescence have a persistent effect on later life health (Sawyer et al. 2012). Adolescents are faced with increased development demands through changes in biological and social transitions. Early adolescence, which starts at nearly 11 years is an important, and understudied period of the life course, when increased prevalence of mood disorders has been observed (Merikangas et al. 2010). Scholars identify early adolescence as a sensitive phase due to the onset of puberty and the accompanying academic transitions, changes in academic expectations, and increasing influence of peer groups (Sawyer et al. 2012). Socioemotional health is an integral component of adolescent health (Costello et al. 2002) and has been linked to academic achievement, subsequent anxiety and depression, and eating pathology (Bartels et al. 2013; Bos et al. 2006). The importance of health and health inequalities in early adolescence is underscored in studies showing that mental health in childhood is linked with lower future test scores, welfare receipt, and schooling attainment (Currie and Stabile 2006), and socioemotional difficulties are consequential for a number of outcomes in adulthood, including educational attainment, employment, and health inequalities (Duncan and Brooks-Gunn 1997; Palloni 2006).
One of the critical tasks of adolescence is identity development (Erikson 1994), and more specifically, racial/ethnic identity development (Peck et al. 2014). Children in early adolescence face the additional burden of navigating racial/ethnic identities in a societal context of increased stigma and discrimination (Benner et al. 2018). Given that primary social influences move from parents to peers (Brown and Larson 2009), adolescents may encounter more racial/ethnic biases outside the home (Eccles et al. 1993). Indeed racial/ethnic relations become more consequential during adolescence as racial/ethnic minorities may face differential treatment and engage in more dialogue around race/ethnicity with family members and friends (Tatum 2003). At the same time, there is potential for conflicting cultural values with peers and family members, and this in turn may lead to family and peer conflict and poor socioemotional and cognitive development (McLaughlin, Hilt, and Nolen-Hoeksema 2007).
1.4 Current study
health domains and across developmental contexts (i.e., United States versus United Kingdom). In addition, we seek to more comprehensively examine potential racial/ethnic differences – within and between countries – by considering a host of adolescent and family characteristics that might also explain differences in early adolescent development. Previous comparative studies are limited by aggregating race/ethnic groups into a catch-all children of immigrant group, which obscures heterogeneity in socioeconomic, migratory, and health profiles (Modood 2003). Our conceptual model considers that observed racial/ethnic inequalities in outcomes may be due to the level and type of family resources to which adolescents are exposed; these resources span adolescent characteristics and family sociodemographic, cultural, and psychosocial domains that are known individual correlates of adolescent socioemotional well-being and cognitive development (Bianchi 2000; Heiland and Liu 2006; Mollborn 2016).
We hypothesize that Pakistani, Bangladeshi, and Black African and Caribbean groups in the United Kingdom and Black and Latino groups in the United States may be subjected to poorer socioemotional and cognitive adjustment during early adolescence. Prior literature on these racial/ethnic minority groups suggests measurable characteristics such as socioeconomic conditions and cultural factors may explain differences. In contrast, we hypothesize that Asian Americans in the United States and Indians in the United Kingdom may fare better, being viewed as ‘model minority’ groups. In line with evidence on the advantaged economic conditions of Asian Americans and Indians, we hypothesize sociodemographic characteristics to explain differences between these groups and their White peers. We also hypothesize that any inequalities observed between racial/ethnic minorities and their White peers will be more similar across the United States and United Kingdom when we control for differences in adolescent and family characteristics. Any remaining cross-national differences, after adjusting for adolescent and family differences, may suggest evidence of unmeasured resources. These resources could be related to social policies within each context or access to high quality social support, or to other unmeasured dimensions we may expect to influence adolescent development, such as discrimination and racial microaggressions.
2. Data
timing and design. The MCS is a nationally representative sample of 19,244 children born in the United Kingdom between 2000 and 2002, who were living in the United Kingdom at 9 months old, and who were eligible to receive Child Benefit (a universal child cash welfare benefit) (Plewis et al. 2004). The sample is clustered at the electoral ward level, and disadvantaged residential areas and those with a high proportion of ethnic minority residents were oversampled. Primary respondents were mothers (98%), and data collection occurred when children were 9 months, and 3, 5, 7, and 11 years old. Interview data was available for 69% of families when cohort members were aged 11. During home interviews, questions addressed child socioemotional development, socioeconomic circumstances, cultural tradition factors, and the psychosocial environment. At the fifth wave (age 11), trained interviewers carried out cognitive assessments and questions were asked to the cohort members about their self-esteem. We focused on the fifth data wave because the age at follow-up was the most comparable with the US kindergarten sample (see Plewis et al. 2004 for more details about sampling weights and survey methods employed).
The ECLS-K is a nationally representative, longitudinal study of approximately 21,400 kindergarteners’ educational experiences and development from kindergarten to 8th grade. The data were collected on children who entered kindergarten in both public
and private schools in the fall of 1998. The study used a dual-frame multistage sampling design. Initially, 100 primary sampling units (typically counties) were selected across the United States, after which 1,000 schools with kindergartens within these units were selected. Approximately 23 students from each school were then randomly selected. Data (i.e., parent, child, teacher, and school administrator surveys, direct child assessments) was collected in the fall and spring of kindergarten and 1st
grade and in the spring of 3rd, 5th, and 8th grades. Approximately 75% of the sample
maintained their participation throughout each data collection wave. Due to planned sample attrition, the ECLS-K did not follow approximately 8,500 children who moved schools between kindergarten and 5th grade (Tourangeau et al. 2009). In the ECLS-K,
94% of children sampled in the base year (kindergarten) who did not move completed child assessments in 5th grade, and 91% of those children had completed 5th grade
parent interviews (unweighted percentages; see Tourangeau, Lê, and Nord 2005 for description of completion rates). Our analyses focus on data from wave 6 when children were, on average, 11.2 years old (spring of 5th grade).
socioemotional domain – is comparable in measurement, the reporting differs between the two countries (maternal report in MCS and teacher report in ECLS-K). Despite this difference in informant, assessing racial/ethnic patterning in socioemotional development gives an indication of the extent to which observed inequalities can be generalized to other areas of development. Additionally, it should be noted that the vast majority of the ECLS-K child sample (2%) was not foreign born, thus suggesting comparability in terms of child nativity between the US and UK datasets (100% of the MCS child sample were native born). The percent missing on covariates ranged from 0%–10% in the MCS and 0%–1% in the ECLS-K.
2.1 Measures
2.1.1 Socioemotional development
In the MCS, during the interview, parents answered questions about their child’s socioemotional behavior using the Strengths and Difficulties Questionnaire (SDQ), age 4–15 year version (http://www.sdqinfo.com/). Strengths of the SDQ are its
psychometric properties, representation of children’s socioemotional strengths and difficulties (Goodman 2001), and its wide use in research examining ethnic inequalities. The questionnaire asks five questions in each of five domains: emotional symptoms, conduct problems, hyperactivity–inattention, peer problems, and prosocial behavior. Each question is scored 0 (not at all true), 1 (partly true), or 2 (certainly true), with some questions reverse coded. Scores are summed across the first four domains to construct a total difficulties score, which was analyzed as a continuous variable with higher values indicating increased difficulties. An externalizing behavior score was created using scores from the conduct problems and hyperactivity–inattention scales, and an internalizing behavior score was created by summing emotional symptoms and peer problems scores (α = .89 and .77 for externalizing and internalizing behaviors, respectively). In descriptive analyses we used raw scores, and in regressions socioemotional development was standardized to have a mean of 0 and a standard deviation of 1 for easy interpretation and comparability to the ECLS-K.
following scale: 1 = never (a student never exhibits this behavior), 2 = sometimes (a student exhibits this behavior occasionally or sometimes), 3 = often (a student exhibits this behavior regularly but not all the time), 4 = very often (a student exhibits this behavior most of the time, and N/O = no opportunity (no opportunity to observe this behavior). For each scale, scores were averaged, with higher scores representing more difficulties (α = .89 and .77 for teacher-rated internalizing and externalizing behaviors, respectively). A total difficulties scale was assessed by summing externalizing and internalizing scales. Akin to the UK data, we used raw scores in descriptive tables and standardized scores for regressions to allow for comparability.
2.1.2 Cognitive development: Verbal skills/academic performance
In the MCS, verbal skills were assessed using a subset of the British Ability Scales II (BAS II), which is a battery of cognitive abilities and educational achievement tests suitable for use from ages 2 years 6 months to 17 years 11 months (Elliott, Smith, and McCulloch 1997; Hill 2005). The individual subscales are widely validated, age appropriate, can be analyzed separately, and have been shown to predict later child cognitive performance (Jones and Schoon 2008). Data at age 11 used the Verbal Similarities subscale assessing children’s verbal reasoning and verbal knowledge (Hansen 2014). The subscale scores used in this study are standardized to mean 50 and standard deviation 10 and are adjusted for both item difficulty and age. Age adjustment is made within three-month age bands; thus we control for age at interview in our models to account for heterogeneity of verbal skills of children within these age bands.
Adolescent academic performance in the ECLS-K was assessed using direct assessments. At each data collection wave, children completed untimed, individually administered, two-stage standardized assessments in reading (e.g., vocabulary knowledge, reading comprehension). Adolescents’ performance on the uniform first stage determined whether they took the low-, medium-, or high-difficulty version of the second stage. Item Response Theory was used to develop single proficiency scores across stages (M =142.91,SD = 21.93 for the current sample); these scores are directly comparable across years, as they represent specific points along the same ability continuum (Reardon 2005).
2.1.3 Race and ethnicity
Racial and ethnic categories were constructed using mother reports of the child, based on categories derived from country-specific census data. For the United Kingdom, groups were: White, Indian, Pakistani, Bangladeshi, Black Caribbean (including mixed White and Black Caribbean), Black African (including mixed White and Black African), and Other (mixed racial/ethnic groups and racial/ethnic minority groups that could not be categorized into any of the other groups). For the ECLS-K, categories were: White, Asian American, Black, Latino, and Other.
It is important to note that we rely on MCS and ECLS-K categorizations that are in line with country-specific census classifications. In the ECLS-K, we are unable to make distinctions among different subgroups within each large, race/ethnic group (e.g., Mexican, Puerto Rican, or Dominican, among those in the Hispanic category) due to data unavailability (mothers were simply asked whether they were of Hispanic/Latina origin). Further, we do not make distinctions on the basis of recency of parental immigration, citizenship status, or whether arrival in host countries was voluntary or involuntary, factors with which race, ethnicity, social class, and income are often confounded (Coll et al. 1996). These are compelling dimensions to examine but are outside the scope of our research questions, particularly so as there is little comparable data on these factors. Nevertheless, we adjust for parental nativity in order to account for possible differences between children born to migrant and non-migrant parents.
2.1.4 Covariates
psychosocial environment assessed maternal mental health. In MCS, maternal mental health was assessed via the K6, a screening scale for assessing psychological distress (α = 89) (Kessler et al. 2002). In the ECLS-K, a similar construct was assessed using 12 items from the Center for Epidemiologic Studies Depression Scale (CES-D) (α = .89) (Radloff 1977).
2.2 Analytic sample
Adolescent socioemotional and cognitive development is influenced by multiple births, and therefore we analyzed data on singleton-born adolescents for whom mothers reported on their child’s race/ethnicity and child socioemotional health. The analytic sample was 10,188 in MCS and 6,950 in ECLS-K after selecting on observations complete on covariates. Note that the ECLS-K sample size is rounded to the nearest ten throughout per NCES requirements for restricted-use data. Analytic samples varied slightly by the outcome measure (see Table 1 for more details).
2.3 Planned analyses
3. Results
3.1 Race/ethnic variation in outcomes and explanatory factors
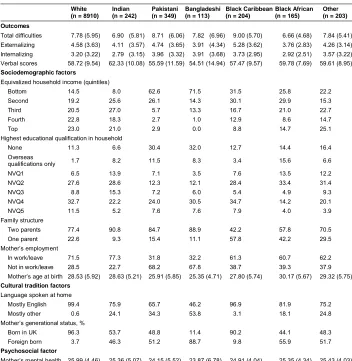
Table 1: Early adolescent development and explanatory factors by race/ethnicity: United Kingdom (mean or percent, (SD))
White (n = 8910)
Indian (n = 242)
Pakistani (n = 349)
Bangladeshi (n = 113)
Black Caribbean (n = 204)
Black African (n = 165)
Other (n = 203)
Outcomes
Total difficulties 7.78 (5.95) 6.90 (5.81) 8.71 (6.06) 7.82 (6.96) 9.00 (5.70) 6.66 (4.68) 7.84 (5.41) Externalizing 4.58 (3.63) 4.11 (3.57) 4.74 (3.65) 3.91 (4.34) 5.28 (3.62) 3.76 (2.83) 4.26 (3.14) Internalizing 3.20 (3.22) 2.79 (3.15) 3.96 (3.32) 3.91 (3.68) 3.73 (2.95) 2.92 (2.51) 3.57 (3.22) Verbal scores 58.72 (9.54) 62.33 (10.08) 55.59 (11.59) 54.51 (14.94) 57.47 (9.57) 59.78 (7.69) 59.61 (8.95) Sociodemographic factors
Equivalized household income (quintiles)
Bottom 14.5 8.0 62.6 71.5 31.5 25.8 22.2
Second 19.2 25.6 26.1 14.3 30.1 29.9 15.3
Third 20.5 27.0 5.7 13.3 16.7 21.0 22.7
Fourth 22.8 18.3 2.7 1.0 12.9 8.6 14.7
Top 23.0 21.0 2.9 0.0 8.8 14.7 25.1
Highest educational qualification in household
None 11.3 6.6 30.4 32.0 12.7 14.4 16.4
Overseas
qualifications only 1.7 8.2 11.5 8.3 3.4 15.6 6.6
NVQ1 6.5 13.9 7.1 3.5 7.6 13.5 12.2
NVQ2 27.6 28.6 12.3 12.1 28.4 33.4 31.4
NVQ3 8.8 15.3 7.2 6.0 5.4 4.9 9.3
NVQ4 32.7 22.2 24.0 30.5 34.7 14.2 20.1
NVQ5 11.5 5.2 7.6 7.6 7.9 4.0 3.9
Family structure
Two parents 77.4 90.8 84.7 88.9 42.2 57.8 70.5
One parent 22.6 9.3 15.4 11.1 57.8 42.2 29.5
Mother’s employment
In work/leave 71.5 77.3 31.8 32.2 61.3 60.7 62.2
Not in work/leave 28.5 22.7 68.2 67.8 38.7 39.3 37.9
Mother’s age at birth 28.53 (5.92) 28.63 (5.21) 25.91 (5.85) 25.35 (4.71) 27.80 (5.74) 30.17 (5.67) 29.32 (5.75) Cultural tradition factors
Language spoken at home
Mostly English 99.4 75.9 65.7 46.2 96.9 81.9 75.2
Mostly other 0.6 24.1 34.3 53.8 3.1 18.1 24.8
Mother’s generational status, %
Born in UK 96.3 53.7 48.8 11.4 90.2 44.1 48.3
Foreign born 3.7 46.3 51.2 88.7 9.8 55.9 51.7
Psychosocial factor
Mother’s mental health 25.99 (4.46) 25.36 (5.07) 24.15 (5.52) 23.87 (6.78) 24.91 (4.04) 25.35 (4.34) 25.43 (4.03)
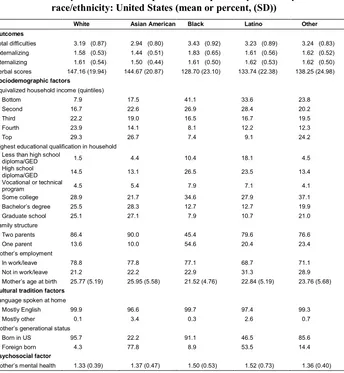
Table 2: Early adolescent development and explanatory factors by race/ethnicity: United States (mean or percent, (SD))
White Asian American Black Latino Other
Outcomes
Total difficulties 3.19 (0.87) 2.94 (0.80) 3.43 (0.92) 3.23 (0.89) 3.24 (0.83) Externalizing 1.58 (0.53) 1.44 (0.51) 1.83 (0.65) 1.61 (0.56) 1.62 (0.52) Internalizing 1.61 (0.54) 1.50 (0.44) 1.61 (0.50) 1.62 (0.53) 1.62 (0.50) Verbal scores 147.16 (19.94) 144.67 (20.87) 128.70 (23.10) 133.74 (22.38) 138.25 (24.98) Sociodemographic factors
Equivalized household income (quintiles)
Bottom 7.9 17.5 41.1 33.6 23.8
Second 16.7 22.6 26.9 28.4 20.2
Third 22.2 19.0 16.5 16.7 19.5
Fourth 23.9 14.1 8.1 12.2 12.3
Top 29.3 26.7 7.4 9.1 24.2
Highest educational qualification in household Less than high school
diploma/GED 1.5 4.4 10.4 18.1 4.5
High school
diploma/GED 14.5 13.1 26.5 23.5 13.4
Vocational or technical
program 4.5 5.4 7.9 7.1 4.1
Some college 28.9 21.7 34.6 27.9 37.1
Bachelor’s degree 25.5 28.3 12.7 12.7 19.9
Graduate school 25.1 27.1 7.9 10.7 21.0
Family structure
Two parents 86.4 90.0 45.4 79.6 76.6
One parent 13.6 10.0 54.6 20.4 23.4
Mother’s employment
In work/leave 78.8 77.8 77.1 68.7 71.1
Not in work/leave 21.2 22.2 22.9 31.3 28.9
Mother’s age at birth 25.77 (5.19) 25.95 (5.58) 21.52 (4.76) 22.84 (5.19) 23.76 (5.68) Cultural tradition factors
Language spoken at home
Mostly English 99.9 96.6 99.7 97.4 99.3
Mostly other 0.1 3.4 0.3 2.6 0.7
Mother’s generational status
Born in US 95.7 22.2 91.1 46.5 85.6
Foreign born 4.3 77.8 8.9 53.5 14.4
Psychosocial factor
Mother’s mental health 1.33 (0.39) 1.37 (0.47) 1.50 (0.53) 1.52 (0.73) 1.36 (0.40)
Note:Nrange is 4,300–4,540 for Whites, 370–410 for Asian Americans, 540–580 for Blacks, 1,030–1130 for Latino, and 270–290 for
other races/ethnicities. AllN’s rounded to the nearest 10 per NCES requirements for restricted-use data. Outcomes are presented in raw scores and standardized for regressions.
38% of adolescents in the United States. The largest racial/ethnic minority group in the United Kingdom was Pakistani (3.4%) and in the United States was Latino (15%–16%). Racial/ethnic inequalities were found in both national settings. For adolescent outcomes, in the United Kingdom, Pakistani and Black Caribbean 11 year olds had disadvantages in socioemotional outcomes and verbal skills: both groups had higher total difficulties, externalizing, and internalizing scores and the lowest verbal scores. Indian and Black African adolescents had the lowest scores on socioemotional outcomes. Indian adolescents had the highest verbal skills scores. In the United States, Asian American adolescents had the lowest scores on total difficulties, externalizing, and internalizing scales, whereas Black and Latino adolescents had the highest total difficulties and externalizing scores. Black and Latino adolescents had the lowest verbal scores.
For the sociodemographic factors, stark racial/ethnic inequalities were also evident for both countries. Pakistani, Bangladeshi, Black Caribbean, and Black African adolescents in the United Kingdom and Asian American, Black, and Latino adolescents in the United States were most likely to be living in households with annual household incomes in the lowest quintile. In the United Kingdom, mothers of Pakistani and Bangladeshi adolescents had the lowest educational attainment, and this was true for mothers of Black and Latino adolescents in the United States as well. Mothers of Pakistani and Bangladeshi adolescents had the lowest employment rates in the United Kingdom, and similar patterns were observed for mothers of Latino adolescents in the United States.
In relation to cultural tradition factors, Pakistani and Bangladeshi adolescents in the United Kingdom were most likely to live in a household in which the primary language spoken was not English. For psychosocial factors, in the United Kingdom, there was little variation in maternal mental health scores across race/ethnicity; in the United States, mothers of Black and Latino adolescents had the poorest mental health.
3.2 The effects of adolescent characteristics and sociodemographic, cultural, and psychosocial resources for UK sample
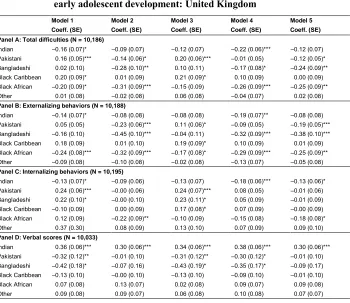
Table 3: Multivariate linear regressions predicting racial/ethnic inequalities in early adolescent development: United Kingdom
Model 1 Model 2 Model 3 Model 4 Model 5
Coeff. (SE) Coeff. (SE) Coeff. (SE) Coeff. (SE) Coeff. (SE)
Panel A: Total difficulties (N = 10,186)
Indian –0.16 (0.07)* –0.09 (0.07) –0.12 (0.07) –0.22 (0.06)*** –0.12 (0.07)
Pakistani 0.16 (0.05)*** –0.14 (0.06)* 0.20 (0.06)*** –0.01 (0.05) –0.12 (0.05)*
Bangladeshi 0.02 (0.10) –0.28 (0.10)** 0.10 (0.11) –0.17 (0.08)* –0.24 (0.09)**
Black Caribbean 0.20 (0.09)* 0.01 (0.09) 0.21 (0.09)* 0.10 (0.09) 0.00 (0.09)
Black African –0.20 (0.09)* –0.31 (0.09)*** –0.15 (0.09) –0.26 (0.09)*** –0.25 (0.09)**
Other 0.01 (0.08) –0.02 (0.08) 0.06 (0.08) –0.04 (0.07) 0.02 (0.08)
Panel B: Externalizing behaviors (N = 10,188)
Indian –0.14 (0.07)* –0.08 (0.08) –0.08 (0.08) –0.19 (0.07)** –0.08 (0.08)
Pakistani 0.05 (0.05) –0.23 (0.06)*** 0.11 (0.06)* –0.09 (0.05) –0.19 (0.05)***
Bangladeshi –0.16 (0.10) –0.45 (0.10)*** –0.04 (0.11) –0.32 (0.09)*** –0.38 (0.10)***
Black Caribbean 0.18 (0.09) 0.01 (0.10) 0.19 (0.09)* 0.10 (0.09) 0.01 (0.09)
Black African –0.24 (0.08)*** –0.32 (0.09)*** –0.17 (0.08)* –0.29 (0.09)*** –0.25 (0.09)**
Other –0.09 (0.08) –0.10 (0.08) –0.02 (0.08) –0.13 (0.07) –0.05 (0.08)
Panel C: Internalizing behaviors (N = 10,195)
Indian –0.13 (0.07)* –0.09 (0.06) –0.13 (0.07) –0.18 (0.06)*** –0.13 (0.06)*
Pakistani 0.24 (0.06)*** –0.00 (0.06) 0.24 (0.07)*** 0.08 (0.05) –0.01 (0.06)
Bangladeshi 0.22 (0.10)* –0.00 (0.10) 0.23 (0.11)* 0.05 (0.09) –0.01 (0.09)
Black Caribbean –0.10 (0.09) 0.00 (0.09) 0.17 (0.08)* 0.07 (0.09) –0.00 (0.09)
Black African 0.12 (0.09) –0.22 (0.09)** –0.10 (0.09) –0.15 (0.08) –0.18 (0.08)*
Other 0.37 (0.30) 0.08 (0.09) 0.13 (0.10) 0.07 (0.09) 0.09 (0.10)
Panel D: Verbal scores (N = 10,033)
Indian 0.36 (0.06)*** 0.30 (0.06)*** 0.34 (0.06)*** 0.38 (0.06)*** 0.30 (0.06)***
Pakistani –0.32 (0.12)** –0.01 (0.10) –0.31 (0.12)** –0.30 (0.12)* –0.01 (0.10)
Bangladeshi –0.42 (0.18)* –0.07 (0.16) –0.43 (0.19)* –0.35 (0.17)* –0.09 (0.17)
Black Caribbean –0.13 (0.10) –0.00 (0.10) –0.13 (0.10) –0.09 (0.10) –0.01 (0.10)
Black African 0.07 (0.08) 0.13 (0.07) 0.02 (0.08) 0.09 (0.07) 0.09 (0.08)
Other 0.09 (0.08) 0.09 (0.07) 0.06 (0.08) 0.10 (0.08) 0.07 (0.07)
Note: * p<0.05, ** p<0.01, *** p<0.001 for two-tailed significance tests. Coefficients represent standard deviations of outcome. White is the reference group. Model 1 adjusts for child age and gender. Model 2 adjusts for Model 1 and for household income, highest educational qualification, family structure, maternal employment, and mother’s age at birth. Model 3 adjusts for Model 1 and for language spoken at home and mother’s nativity. Model 4 adjusts for Model 1 and for mother’s mental health. Model 5 adjusts for all covariates included in Models 1 to 4. All estimates are weighted with sample weights.
compared with their White peers. Cultural tradition factors also partially explained differences for Indian and Black African adolescents, whereas maternal mental health helped explain inequalities for Pakistani, Bangladeshi, and Black Caribbean adolescents (Models 3 and 4). Lastly, in the fully adjusted model (Model 5) which captured adolescent and family resources from our conceptual model, we found Black African adolescents to have significantly lower total difficulties scores (.25 standard deviation) compared to White adolescents. It also appears that adjusting for the relatively adverse family resources of Pakistani and Bangladeshi adolescents disguises an advantage in problem behaviors (.12 and .24 standard deviation, respectively).
The results for externalizing and internalizing behaviors are summarized in Panels B and C and show a similar set of patterns to Panel A. Generally, we see Indian youth to have lower externalizing and internalizing behaviors and these advantages, relative to White youth, are attenuated by socioeconomic and cultural family resources. Both Bangladeshi and Pakistani adolescents experience advantages in externalizing behaviors (.19 and .38 standard deviation, respectively, Model 5, Panel B), after adjusting for family resources. However, both groups of adolescents experience a shortfall in internalizing scores (Panel B), which are largely accounted for when adjusting for socioeconomic characteristics and maternal mental health. Similar to their lower total difficulties scores, Black African adolescents have one-quarter and one-fifth of a standard deviation difference in externalizing and internalizing scores, net of average family characteristics.
Panel D considers verbal scores and higher scores reflect better functioning. We find consistent advantages for Indian children (Models 1–4); after adjusting for advantageous family resources, they perform better than their White peers (.30 standard deviation, Model 5). The opposite is true for Bangladeshi and Pakistani adolescents who had significantly lower verbal scores versus White youth (Model 1) and socioeconomic factors (Model 2) explained these inequalities.
3.3 The effects of adolescent characteristics and sociodemographic, cultural, and psychosocial resources for US sample
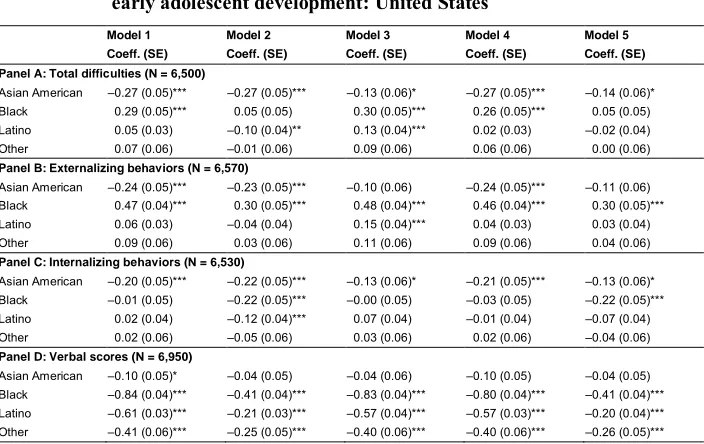
B and C. Black adolescents, in contrast, had more problem behaviors (Model 1), and this inequality was primarily accounted for by their relative economic disadvantage (Model 2). In fully adjusted models for externalizing and internalizing behaviors, the gap between Black and White adolescents was between one-fifth and nearly one-third of a standard deviation (Model 5 in Panels B and C).
Table 4: Multivariate linear regressions predicting racial/ethnic inequalities in early adolescent development: United States
Model 1 Model 2 Model 3 Model 4 Model 5
Coeff. (SE) Coeff. (SE) Coeff. (SE) Coeff. (SE) Coeff. (SE)
Panel A: Total difficulties (N = 6,500)
Asian American –0.27 (0.05)*** –0.27 (0.05)*** –0.13 (0.06)* –0.27 (0.05)*** –0.14 (0.06)*
Black 0.29 (0.05)*** 0.05 (0.05) 0.30 (0.05)*** 0.26 (0.05)*** 0.05 (0.05)
Latino 0.05 (0.03) –0.10 (0.04)** 0.13 (0.04)*** 0.02 (0.03) –0.02 (0.04)
Other 0.07 (0.06) –0.01 (0.06) 0.09 (0.06) 0.06 (0.06) 0.00 (0.06)
Panel B: Externalizing behaviors (N = 6,570)
Asian American –0.24 (0.05)*** –0.23 (0.05)*** –0.10 (0.06) –0.24 (0.05)*** –0.11 (0.06)
Black 0.47 (0.04)*** 0.30 (0.05)*** 0.48 (0.04)*** 0.46 (0.04)*** 0.30 (0.05)***
Latino 0.06 (0.03) –0.04 (0.04) 0.15 (0.04)*** 0.04 (0.03) 0.03 (0.04)
Other 0.09 (0.06) 0.03 (0.06) 0.11 (0.06) 0.09 (0.06) 0.04 (0.06)
Panel C: Internalizing behaviors (N = 6,530)
Asian American –0.20 (0.05)*** –0.22 (0.05)*** –0.13 (0.06)* –0.21 (0.05)*** –0.13 (0.06)*
Black –0.01 (0.05) –0.22 (0.05)*** –0.00 (0.05) –0.03 (0.05) –0.22 (0.05)***
Latino 0.02 (0.04) –0.12 (0.04)*** 0.07 (0.04) –0.01 (0.04) –0.07 (0.04)
Other 0.02 (0.06) –0.05 (0.06) 0.03 (0.06) 0.02 (0.06) –0.04 (0.06)
Panel D: Verbal scores (N = 6,950)
Asian American –0.10 (0.05)* –0.04 (0.05) –0.04 (0.06) –0.10 (0.05) –0.04 (0.05) Black –0.84 (0.04)*** –0.41 (0.04)*** –0.83 (0.04)*** –0.80 (0.04)*** –0.41 (0.04)*** Latino –0.61 (0.03)*** –0.21 (0.03)*** –0.57 (0.04)*** –0.57 (0.03)*** –0.20 (0.04)*** Other –0.41 (0.06)*** –0.25 (0.05)*** –0.40 (0.06)*** –0.40 (0.06)*** –0.26 (0.05)***
Note: * p<0.05, ** p<0.01, *** p<0.001 for two-tailed significance tests. Coefficients represent standardized outcome scores. White is the reference group. Model 1 adjusts for child age and gender. Model 2 adjusts for Model 1 and for household income, highest educational qualification, family structure, maternal employment, and mother’s age at birth. Model 3 adjusts for Model 1 and for language spoken at home and mother’s nativity. Model 4 adjusts for Model 1 and for mother’s mental health. Model 5 adjusts for all covariates included in Models 1 to 4. AllN’s rounded to the nearest 10 per NCES requirements for restricted-use data.
Panel D examines racial/ethnic inequalities in verbal skills. In unconditional estimates, Black and Latino adolescents had significantly lower verbal scores in 5th
4. Discussion
The objective of this comparative study was to examine factors of the family environment that may explain possible racial/ethnic inequalities in an understudied population (i.e., early adolescents) in the United States and in the United Kingdom. A strength of our study is the use of a detailed race/ethnic classification in the investigation of racial/ethnic inequalities across two countries with different composition of racial/ethnic groups, migration patterns, social welfare systems, and racial/ethnic relations. Unlike previous comparative work (Washbrook et al. 2012), we find stronger differences between countries than we do across adolescent outcomes. In particular, poor socioemotional health and cognitive development disadvantages were associated with minority status in both countries, but the factors that explain the race/ethnic inequalities appear to differ between the United States and the United Kingdom.
family capital in ways that are beneficial to their socioemotional development, a hypothesis that warrants additional research.
Turning to verbal skills, in both contexts we find family resources cannot explain the sizable cross-country differences. In the United Kingdom Indian adolescents have nearly one-third of a standard deviation increase in their verbal scores, an advantage that is unaffected by levels of family resources (fully adjusted models). Evidence elsewhere suggests that Indian children’s high verbal performance originates in early childhood and is promoted both by family socioeconomic characteristics and cognitively stimulating home environments in early childhood (Zilanawala, Kelly, and Sacker 2016). In the United States Black and Latino adolescents had significantly lower verbal scores; nearly two-fifths and one-fifth of a standard deviation below the mean, respectively. Although socioeconomic conditions did reduce unadjusted estimates by one-half. The strong economic effects in the US context could be due to the greater income inequality in the United States than in the United Kingdom (Smeeding 2005). Overall, results from both societies suggest effect sizes in racial/ethnic group differences in adolescent development are similar and there is a strong role of family resources in explaining differences by race/ethnicity. Where there are remaining inequalities or advantages in development, in our final models, we can speculate that differences reflect unmeasurable features of each context that may promote or hinder development of racial/ethnic minority groups. This is a critical research question, particularly when the implications of adolescent development on future outcomes are considered.
while we incorporated mother reports. The factors representing socioeconomic conditions, cultural tradition, and maternal psychosocial circumstances investigated in the present study may operate differently across different years in adolescence, and we have focused on a very particular time period (i.e., early adolescence). Future research should examine the longitudinal trajectory of socioemotional difficulties during early through late adolescence and potential variations in reports of socioemotional difficulties by mothers, teachers, and children.
A venerable literature has been developed on inequalities in markers of child health in the US context (Magnuson, Lahaie, and Waldfogel 2006; Magnuson and Waldfogel 2005). However, we focus on 5th graders in isolation, which is a clear
difference with previous studies (Cheng and Powell 2005; Crosnoe 2007; Galindo and Fuller 2010), making it difficult to compare findings in our US analyses to the extant literature that generally focuses on early childhood development. That we find socioemotional advantages for Asian American adolescents and disadvantages for Blacks, along with significantly lower verbal scores for Blacks and Latinos is in line with prior literature focusing on early childhood (Han, Lee, and Waldfogel 2012). Findings from one comparative study aggregating race/ethnic minority children in a catch-all ‘immigrant children group’ suggests lower verbal performance among children in the United States who were born to foreign-born mothers; however this study examines 5-year-old children (Washbrook et al. 2012).
lower verbal scores for Black and Latino American adolescents) even after considering multiple measures of family’s economic conditions.
We emphasize that the goal of our study was to document the extent of racial/ethnic inequalities in early adolescent development across the United Kingdom and United States, taking other known contributing factors into account. We briefly discuss three important implications of our work. First, studies on adolescent development that exclusively investigate one marker of health and development may present a distorted conclusion on racial/ethnic patterning of development, which preferably considers a range of abilities (socioemotional and cognition). Second, we find some advantages in the socioemotional domain for Indian youth in the United Kingdom and Asian American adolescents in the United States, giving some support for the ‘model minority’ hypothesis. The risk of applying a minority model construct in the United Kingdom and United States is that the opposite, or a ‘deficit model,’ can be inferred for other ethnic minority adolescents who may be perceived as underachieving or having poor behavior (Wong 2015). This could potentially reinforce negative stereotypes about the behavioral or cognitive skills of Black African, Pakistani, and Bangladeshi youth in the United Kingdom or African American and Hispanic adolescents in the United States. Moreover, such model minority labels also presume homogeneity in the Asian American population, yet prior research documents vast differences in developmental outcomes across specific Asian ethnic groups in the United States (Lee 2015). Third, we do find racial/ethnic differences in socioemotional and cognitive development across the two countries after including adolescent and family resources. One possible interpretation is that these unexplained differences may relate to public policy, school systems, or integration policies within each country context that may promote or obstruct gaps in adolescent development. Of course, it cannot be ruled out that unobservable differences between race/ethnic minority groups may exist that were not captured in the current study. It is an important priority for future comparative research to carefully disentangle the policies that do or do not support the success of racial/ethnic minority adolescents’ well-being.
allow us to disentangle the benefits of a bilingual home environment, such as cognitive flexibility and positive cultural capital, from the disadvantages in language expression resulting from exposure to a non-English-speaking home environment. Future comparative data analyses should consider detailed questions on English language use, both within the household and with friends. Another limitation is the diversity within each race/ethnic group. Our study did not consider the differences in cultural backgrounds of various subgroups (e.g., Chinese, Filipinos, Puerto-Ricans, Arabs) that may influence the generalizability of the data. Additionally, with the exception of mother’s age at birth, we used a cross-sectional design, which precludes the temporal ordering of other domains that could influence development prior to adolescence (e.g., maternal employment and low family income) and changes in inequalities over time. Future studies are needed to examine the trajectories of racial/ethnic patterning over time and their long-term implications in relation to adolescent development.
References
Abraido-Lanza, A.F., Dohrenwend, B.P., Ng-Mak, D.S., and Turner, J.B. (1999). The Latino mortality paradox: A test of the ‘salmon bias’ and healthy migrant hypotheses.American Journal of Public Health 89(10): 1543–1548.
Amone-P’Olak, K., Burger, H., Ormel, J., Huisman, M., Verhulst, F.C., and Oldehinkel, A.J. (2009). Socioeconomic position and mental health problems in pre- and early-adolescents: The TRAILS study. Social Psychiatry and Psychiatric Epidemiology 44(3): 231–238.doi:10.1007/s00127-008-0424-z. Astell-Burt, T., Maynard, M.J., Lenguerrand, E., and Harding, S. (2012). Racism,
ethnic density and psychological well-being through adolescence: Evidence from the determinants of adolescent social well-being and health longitudinal study.
Ethnicity and Health17(1–2): 71–87.doi:10.1080/13557858.2011.645153. Bartels, M., Cacioppo, J.T., van Beijsterveldt, T.C., and Boomsma, D.I. (2013).
Exploring the association between well-being and psychopathology in adolescents.Behavior Genetics43(3): 177–190.doi:10.1007/s10519-013-9589-7. Benner, A.D. and Wang, Y. (2015). Adolescent substance use: The role of demographic marginalization and socioemotional distress. Developmental Psychology51(8): 1086–1097.doi:10.1037/dev0000026.
Benner, A.D., Wang, Y., Shen, Y., Boyle, A.E., Polk, R., and Cheng, Y.-P. (2018). Racial/ethnic discrimination and well-being during adolescence: A meta-analytic review.American Psychologist 73(7): 855–883.doi:10.1037/amp0000204. Bianchi, S.M. (2000). Maternal employment and time with children: Dramatic change
or surprising continuity? Demography 37(4): 401–414. doi:10.1353/dem.2000. 0001.
Bos, A.E., Muris, P., Mulkens, S., and Schaalma, H.P. (2006). Changing self-esteem in children and adolescents: A roadmap for future interventions. Netherlands Journal of Psychology 62(1): 26–33.doi:10.1007/BF03061048.
Brown, B.B. and Larson, J. (2009). Peer relationships in adolescence. In: Lerner, R.M. and Steinberg, L. (ed.). Handbook of adolescent psychology. Hoboken: John Wiley and Sons: 74–103.doi:10.1002/9780470479193.adlpsy002004.
Claessens, A., Duncan, G., and Engel, M. (2009). Kindergarten skills and fifth-grade achievement: Evidence from the ECLS-K. Economics of Education Review
28(4): 415–427.doi:10.1016/j.econedurev.2008.09.003.
Coll, C.G., Lamberty, G., Jenkins, R., McAdoo, H.P., Crnic, K., Wasik, B.H., and Garcia, H.V. (1996). An integrative model for the study of developmental competencies in minority children. Child Development 67(5): 1891–1914.
doi:10.2307/1131600.
Costello, E.J., Compton, S.N., Keeler, G., and Angold, A. (2003). Relationships between poverty and psychopathology: A natural experiment. JAMA 290(15): 2023–2029.doi:10.1001/jama.290.15.2023.
Costello, E.J., Pine, D.S., Hammen, C., March, J.S., Plotsky, P.M., Weissman, M.M., Biederman, J., Goldsmith, H.H., Kaufman, J., Lewinsohn, P.M., Hellander, M., Hoagwood, K., Koretz, D.S., Nelson, C.A., and Leckman, J.F. (2002). Development and natural history of mood disorders. Biological Psychiatry
52(6): 529–542.doi:10.1016/S0006-3223(02)01372-0.
Crosnoe, R. (2007). Early child care and the school readiness of children from Mexican immigrant families. International Migration Review 41(1): 152–181.
doi:10.1111/j.1747-7379.2007.00060.x.
Currie, J. and Stabile, M. (2006). Child mental health and human capital accumulation: The case of ADHD. Journal of Health Economics 25(6): 1094–1118.
doi:10.1016/j.jhealeco.2006.03.001.
Currie, J. and Stabile, M. (2007). Mental health in childhood and human capital. in: Gruber, J. (ed.).The problems of disadvantaged youth: An economic perspective. Chicago: University of Chicago Press: 115–148.
Davis, E., Sawyer, M.G., Lo, S.K., Priest, N., and Wake, M. (2010). Socioeconomic risk factors for mental health problems in 4–5-year-old children: Australian population study. Academic Pediatrics 10(1): 41–47. doi:10.1016/j.acap.2009. 08.007.
Davis-Kean, P.E. and Jager, J. (2014). Trajectories of achievement within race/ethnicity: ‘Catching up’ in achievement across time. The Journal of Educational Research 107(3): 197–208.doi:10.1080/00220671.2013.807493. Dogra, N., Svirydzenka, N., Dugard, P., Singh, S.P., and Vostanis, P. (2013).
Duncan, G.J. and Brooks-Gunn, J. (1997). Consequences of growing up poor. New York: Russell Sage Foundation.
Eccles, J.S., Jacobs, J.E., Harold, R.D., Yoon, K.S., Arbreton, A., and Freedman-Doan, C. (1993). Parents and gender-role socialization during the middle childhood and adolescent years. In: Oskamp, S. and Costanzo, M. (eds.).Claremont Symposium on Applied Social Psychology, 1993: Gender and social psychology. Newbury Park: Sage: 59–83.
Elliott, C., Smith, P., and McCulloch, K. (1997).British Ability Scales second edition (BAS II): Technical manual. London: NFER-Nelson.
Erikson, E.H. (1994).Identity: Youth and crisis. New York: Norton.
Esping-Andersen, G., Gallie, D., Hemerijck, A., and Myles, J. (2002).Why we need a new welfare state. Oxford: Oxford University Press. doi:10.1093/0199256438. 001.0001.
Fagg, J., Curtis, S., Stansfeld, S., and Congdon, P. (2006). Psychological distress among adolescents, and its relationship to individual, family and area characteristics in East London. Social Science and Medicine 63(3): 636–648.
doi:10.1016/j.socscimed.2006.02.012.
Farkas, G. (2003). Racial disparities and discrimination in education: What do we know, how do we know it, and what do we need to know? Teachers College Record 105(6): 1119–1146.
Fryer, Jr., R.G. and Levitt, S.D. (2004). Understanding the black-white test score gap in the first two years of school. Review of Economics and Statistics 86(2): 447– 464.doi:10.1162/003465304323031049.
Galindo, C. and Fuller, B. (2010). The social competence of Latino kindergartners and growth in mathematical understanding. Developmental Psychology46(3): 579– 592.doi:10.1037/a0017821.
Goodman, A., Patel, V., and Leon, D.A. (2010). Why do British Indian children have an apparent mental health advantage? Journal of Child Psychology and Psychiatry 51(10): 1171–1183.doi:10.1111/j.1469-7610.2010.02260.x.
Goodman, R. (1997). The Strengths and Difficulties Questionnaire: A research note.
Goodman, R. (2001). Psychometric properties of the strengths and difficulties questionnaire. Journal of the American Academy of Child and Adolescent Psychiatry40(11): 1337–1345.doi:10.1097/00004583-200111000-00015. Gresham, F.M. and Elliott, S.N. (1990). Social skills rating system: Manual. Circle
Pines: American Guidance Service.
Han, W.J., Lee, R., and Waldfogel, J. (2012). School readiness among children of immigrants in the US: Evidence from a large national birth cohort study.
Children and Youth Services Review 34(4): 771–782.doi:10.1016/j.childyouth. 2012.01.001.
Hansen, K. (2014). Millennium cohort study first, second, third, fourth, and fifth surveys: A guide to the datasets. London: Centre for Longitudinal Studies. Heiland, F. and Liu, S.H. (2006). Family structure and wellbeing of out-of-wedlock
children: The significance of the biological parents’ relationship.Demographic Research 15(4): 61–104.doi:10.4054/DemRes.2006.15.4.
Hill, V. (2005). Through the past darkly: A review of the British ability scales second edition.Child and Adolescent Mental Health 10(2): 87–98. doi:10.1111/j.1475-3588.2004.00123.x.
Jackson, M.I., Kiernan, K., and McLanahan, S. (2012). Immigrant–native differences in child health: Does maternal education narrow or widen the gap? Child Development 83(5): 1501–1509.doi:10.1111/j.1467-8624.2012.01811.x. Jones, E.M. and Schoon, I. (2008). Child behaviour and cognitive development. In:
Hansen, K. and Joshi, H. (eds.). Millennium cohort study third survey: A user’s guide to initial findings. London: Centre for Longitudinal Studies, University of London: 118–144.
Keiley, M.K., Bates, J.E., Dodge, K.A., and Pettit, G.S. (2000). A cross-domain growth analysis: Externalizing and internalizing behaviors during 8 years of childhood.
Journal of Abnormal Child Psychology 28(2): 161–179. doi:10.1023/A:100 5122814723.
Kelly, Y., Panico, L., Bartley, M., Marmot, M., Nazroo, J., and Sacker, A. (2009). Why does birthweight vary among ethnic groups in the UK? Findings from the Millennium Cohort Study. Journal of Public Health 31(1): 131–137.
Kelly, Y.J., Watt, R.G., and Nazroo, J.Y. (2006). Racial/ethnic differences in breastfeeding initiation and continuation in the United kingdom and comparison with findings in the United States.Pediatrics 118(5): e1428–e1435.doi:10.1542/ peds.2006-0714.
Kessler, R.C., Andrews, G., Colpe, L.J., Hiripi, E., Mroczek, D.K., Normand, S.L., Walters, E.E., and Zaslavsky, A.M. (2002). Short screening scales to monitor population prevalences and trends in non-specific psychological distress.
Psychological Medicine32(6): 959–976.doi:10.1017/S0033291702006074. Kim, C.J. (1999). The racial triangulation of Asian Americans. Politics and Society
27(1): 105–138.doi:10.1177/0032329299027001005.
Lee, S.J. (2015). Unraveling the ‘model minority’ stereotype: Listening to Asian American youth. New York: Teachers College Press.
Magnuson, K., Lahaie, C., and Waldfogel, J. (2006). Preschool and school readiness of children of immigrants. Social Science Quarterly 87(5): 1241–1262.
doi:10.1111/j.1540-6237.2006.00426.x.
Magnuson, K.A. and Waldfogel, J. (2005). Early childhood care and education: Effects on ethnic and racial gaps in school readiness. Future Child 15(1): 169–196.
doi:10.1353/foc.2005.0005.
Maynard, M.J., Harding, S., and Minnis, H. (2007). Psychological well-being in Black Caribbean, Black African, and White adolescents in the UK Medical Research Council DASH study. Social Psychiatry and Psychiatric Epidemiology 42(9): 759–769.doi:10.1007/s00127-007-0227-7.
McDermott, M. and Samson, F.L. (2005). White racial and ethnic identity in the United States. Annual Review of Sociology 31: 245–261. doi:10.1146/annurev.soc.31. 041304.122322.
Miner, J.L. and Clarke-Stewart, K.A. (2008). Trajectories of externalizing behavior from age 2 to age 9: Relations with gender, temperament, ethnicity, parenting, and rater. Developmental Psychology 44(3): 771–786. doi:10.1037/0012-1649. 44.3.771.
Modood, T. (2003). Ethnic differentials in educational performance. In: Mason, D. (ed.). Explaining ethnic differences: Changing patterns of disadvantage in Britain. Bristol: The Policy Press: 53–68.doi:10.2307/j.ctt1t8915s.9.
Mollborn, S. (2016). Young children’s developmental ecologies and kindergarten readiness.Demography 53(6): 1853–1882.doi:10.1007/s13524-016-0528-0. Nazroo, J., Jackson, J., Karlsen, S., and Torres, M. (2007). The Black diaspora and
health inequalities in the US and England: Does where you go and how you get there make a difference? Sociology of Health and Illness 29(6): 811–830.
doi:10.1111/j.1467-9566.2007.01043.x.
Nazroo, J., Zilanawala, A., Chen, M., Bécares, L., Davis-Kean, P., Jackson, J.S., Kelly, Y., Panico, L., and Sacker, A. (2018). Socioemotional wellbeing of mixed race/ethnicity children in the UK and US: Patterns and mechanisms. SSM – Population Health5: 147–159.doi:10.1016/j.ssmph.2018.06.010.
Nazroo, J.Y. (2001).Ethnicity, class and health. London: Policy Studies Institute. Nazroo, J.Y. (2003). The structuring of ethnic inequalities in health: Economic position,
racial discrimination, and racism. American Journal of Public Health 93(2): 277–284.doi:10.2105/AJPH.93.2.277.
Palloni, A. (2006). Reproducing inequalities: Luck, wallets, and the enduring effects of childhood health.Demography 43(4): 587–615.doi:10.1353/dem.2006.0036. Paschall, K.W., Gershoff, E.T., and Kuhfeld, M. (2018). A two decade examination of
historical race/ethnicity disparities in academic achievement by poverty status.
Journal of Youth and Adolescence 47(6): 1164–1177. doi:10.1007/s10964-017-0800-7.
Patton, G.C., Sawyer, S.M., Santelli, J.S., Ross, D.A., Afifi, R., Allen, N.B., Arora, M., Azzopardi, P., Baldwin, W., Bonell, C., Kakuma, R., Kennedy, E., Mahon, J., McGovern, T., Mokdad, A.H., Patel, V., Petroni, S., Reavley, N., Taiwo, K., Waldfogel, J., Wickremarathne, D., Barroso, C., Bhutta, Z., Fatusi, A.O., Mattoo, A., Diers, J., Fang, J., Ferguson, J., Ssewamala, F., and Viner, R.M. (2016). Our future: A Lancet commission on adolescent health and wellbeing.
Peck, S.C., Brodish, A.B., Malanchuk, O., Banerjee, M., and Eccles, J.S. (2014). Racial/ethnic socialization and identity development in Black families: The role of parent and youth reports. Developmental Psychology 50(7): 1897–1909.
doi:10.1037/a0036800.
Phillips, D. (1998). Black minority ethnic concentration, segregation and dispersal in Britain.Urban Studies 35(10): 1681–1702.doi:10.1080/0042098984105. Plewis, I., Calderwood, L., Hawkes, D., Hughes, G., and Joshi, H. (2004). Millennium
cohort study: Technical report on sampling. London: Institute of Education, University of London (Technical report 16).
Pollack, J.M., Atkins-Burnett, S., Najarian, M., and Rock, D.A. (2005).Early childhood longitudinal study, kindergarten class of 1998–99 (ECLS-K): Psychometric report for the fifth grade (NCES 2006-036). Washington, D.C.: US Department of Education.
Radloff, L.S. (1977). The CES-D scale: A self-report depression scale for research in the general population. Applied Psychological Measurement 1(3): 385–401.
doi:10.1177/014662167700100306.
Reardon, S.F. (2005). Invited commentary: Examining patterns of development in early elementary school using ECLS-K data.Education Statistics Quarterly 6: 16–18. Reardon, S.F. and Portilla, X.A. (2016). Recent trends in income, racial, and ethnic
school readiness gaps at kindergarten entry. AERA Open 2(3): 1–18.
doi:10.1177/2332858416657343.
Sawyer, S.M., Afifi, R.A., Bearinger, L.H., Blakemore, S.J., Dick, B., Ezeh, A.C., and Patton, G.C. (2012). Adolescence: A foundation for future health. Lancet
379(9826): 1630–1640.doi:10.1016/S0140-6736(12)60072-5.
Smeeding, T.M. (2005). Public policy, economic inequality, and poverty: The United States in comparative perspective. Social Science Quarterly 86(S1): 955–983.
doi:10.1111/j.0038-4941.2005.00331.x.
Smith, N.R., Kelly, Y.J., and Nazroo, J.Y. (2015). Ethnic differences in cognitive development in the first 7 years: Does maternal generational status matter?
Journal of Epidemiology and Community Health 70(5): 506–512.
Stansfeld, S.A., Haines, M.M., Head, J.A., Bhui, K., Viner, R., Taylor, S.J., Hillier, S., Klineberg, E., and Booy, R. (2004). Ethnicity, social deprivation and psychological distress in adolescents: School-based epidemiological study in east London. British Journal of Psychiatry 185(3): 233–238. doi:10.1192/ bjp.185.3.233.
Tatum, B.D. (2003). Why are all the black kids sitting together in the cafeteria? A psychologist explains the development of racial identity. New York: Basic Book. Teitler, J.O., Reichman, N.E., Nepomnyaschy, L., and Martinson, M. (2007). A cross-national comparison of racial and ethnic disparities in low birth weight in the United States and England. Pediatrics 120(5): e1182–e1189. doi:10.1542/peds. 2006-3526.
Tourangeau, K., Lê, T., and Nord, C. (2005). Early childhood longitudinal study, kindergarten class of 1998–99 (ECLS-K): Fifth-grade methodology report (NCES 2006-037). Washington, D.C.: National Center for Education Statistics, US Department of Education.
Tourangeau, K., Nord, C., Lê, T., Sorongon, A.G., and Najarian, M. (2009). Early childhood longitudinal study, kindergarten class of 1998–99 (ECLS-K): Combined user’s manual for the ECLS-K eighth-grade and K-8 full sample data files and electronic codebooks (NCES 2009-004). Washington, D.C.: National Center for Education Statistics, US Department of Education.
Washbrook, E., Waldfogel, J., Bradbury, B., Corak, M., and Ghanghro, A.A. (2012). The development of young children of immigrants in Australia, Canada, the United Kingdom, and the United States. Child Development 83(5): 1591–1607.
doi:10.1111/j.1467-8624.2012.01796.x.
West, P. (1997). Health inequalities in the early years: Is there equalisation in youth?
Social Science and Medicine 44(6): 833–858.
West, P., Sweeting, H., and Leyland, A. (2004). School effects on pupils’ health behaviours: Evidence in support of the health promoting school. Research Papers in Education 19(3): 261–291.doi:10.1080/0267152042000247972. Wong, B. (2015). A blessing with a curse: Model minority ethnic students and the
Zilanawala, A., Davis-Kean, P., Nazroo, J., Sacker, A., Simonton, S., and Kelly, Y. (2015a). Race/ethnic disparities in early childhood BMI, obesity and overweight in the United Kingdom and United States. International Journal of Obesity
39(3): 520–529.doi:10.1038/ijo.2014.171.
Zilanawala, A., Kelly, Y., and Sacker, A. (2016). Ethnic differences in longitudinal latent verbal profiles in the millennium cohort study. European Journal of Public Health 26(6): 1011–1016.doi:10.1093/eurpub/ckw184.