VOLUME 41, ARTICLE 9, PAGES 231
-
262
PUBLISHED 23 JULY 2019
http://www.demographic-research.org/Volumes/Vol41/9/ DOI: 10.4054/DemRes.2019.41.9
Research Article
The dynamics of the family network during
childhood: A genealogical and longitudinal
approach to rural Mali
Aurélien Dasré
Olivia Samuel
Véronique Hertrich
This publication is part of the Special Collection on “Children and Family Dynamics in sub-Saharan Africa,” organized by Guest Editors Olivia Samuel and Véronique Hertrich.
© 2019 Aurélien Dasré, Olivia Samuel & Véronique Hertrich.
This open-access work is published under the terms of the Creative Commons Attribution 3.0 Germany (CC BY 3.0 DE), which permits use, reproduction, and distribution in any medium, provided the original author(s) and source are given credit.
1 Introduction 232
2 Population and context 234
3 The boundaries of the family 235
4 Data and methodology 236
4.1 Data 236
4.2 Methodology 237
5 Results 238
5.1 A large and complex family environment 238
5.2 The diversity of children’s kinship ties within their zun 239
5.2.1 Types of kinship ties 239
5.2.2 Classification of kinship ties 240
5.3 Dynamic in children’s family environment between censuses 246 5.3.1 Decomposition of demographic factors in c domestic groups
changes
246
5.3.2 The dynamics of kinship ties 247
6 Discussion and conclusion 252
7 Acknowledgements and funding 254
References 255
The dynamics of the family network during childhood:
A genealogical and longitudinal approach to rural Mali
Aurélien Dasré1
Olivia Samuel2
Véronique Hertrich3 †
Abstract
BACKGROUND
Complex extended families are common in rural sub-Saharan Africa. Relationships between family members take on a wide range of forms (polygamy, classificatory kinship system). However, the complexity of children’s family unit and changes in it are not well taken into account by quantitative surveys.
OBJECTIVE
Our paper brings together traditional demographic perspectives, anthropological and genealogical approaches, to analyze children’s kinship networks and how they change over time. By documenting who is present in a child’s network and who remains there over time, our approach aims to generate new insights into the context of child socialisation.
METHODS
Using genealogical data, coupled with results from a follow-up survey conducted in rural Mali, we define the set of kinship ties that connect each child to other members of his domestic group and measure the turnover in children’s family environment.
RESULTS
Children grow up surrounded by complex families whose boundaries extend well beyond parents, siblings, and close relatives. Moreover, this environment constantly changes. In the space of five years, 50% of the people in a child’s relational network are replaced.
1 Université Paris Nanterre, Laboratoire CRESPPA, Paris, France, and Institut national d’études
démographiques (INED), Paris, France. Email:[email protected].
2 Université Versailles Saint Quentin, Laboratoire Printemps, Versailles, France, and Institut national d’études
démographiques (INED), Paris, France. Email:[email protected].
CONTRIBUTION
Relationship between family dynamics and children’s socialisation have been largely ignored in demographic studies. This article shows that longitudinal data can shed light on the impact on children of family dynamics.
1. Introduction
Children growing up in rural sub-Saharan Africa are usually surrounded by a family constellation made up of many relatives. Knowledge of African family systems and their complexity comes mostly from anthropological research. That research describes kinship rules, the rules that govern power relations between women and men and between generations, rites of passage, organisation of habitat, etc. (Dozon 1986). Relationships between individuals are governed by subtle, complex rules that concern membership in several groups at once (domestic group, lineage, clan, etc.) and categories of kinship ties (mother and father, classificatory kinship systems, etc.). Depending on whether the predominant system is patrilineal, matrilineal, or bilateral, the roles of different relatives vis-à-vis children will differ. Another source of complexity is conjugal practices, such as polygamy, or rules of family solidarity that lead to diverse family arrangements and a large number of adults being in contact with children. Another trait of families in Africa is that parental roles may be delegated to different relatives, notably via the tradition of child fostering (Goody 1978; Isiugo-Abanishe 1994). Parents are not the only relatives who raise children, especially concerning health (Adams, Madhavan, and Simon 2002; Ellis et al. 2013). The extended family network is called upon to play a central role, and its members have obligations to children. The extended family and the community are key actors in child socialisation (Fellous 1981).
Anthropologists describe the many forms of family arrangements, the changes they are subject to, and the place children occupy within them. However, observations are restricted to limited population groups, and they are not designed to produce quantified results.
(household); family relations are limited to ties between the head of the household and each person present in the household (van de Walle 2006). Hence, research based on these sources systematically views the family through the prism of the household. It usually defines presence and marital status only for the father and the mother of children present in the household, and it defines the family structure of the household as derived from this information (nuclear family, single parent, monogamous, or polygamous). This approach in terms of households certainly has an operational advantage; in addition, it stresses biological ties – child, siblings, parents – and family ties based on cohabitation. However, many studies show that the boundaries of a residence do not necessarily coincide with the boundaries of a family, and that the analytical pertinence of the household can be contested (Gastellu 1980; Desai 1992; Pilon and Vignikin 2006; Randall, Coast, and Leone 2011; Madhavan et al. 2017). Complex forms of family tend to be ignored, even though they are common in Africa (Kriel et al. 2014). The picture that emerges of the family as nuclear is incomplete and distorted, and it contradicts the findings of anthropologists.
In addition, in statistical surveys, the usual method for gathering information from household members does not enable precise determination of the links between each individual in the household and people in the environment other than household head. This approach masks relations within the family, in particular between children and other household members. From children’s point of view, this system of representation overemphasises the presence or absence of biological parents and tends to ignore other family members who may play a role in bringing up children.
Another problem posed by the use of traditional surveys or censuses in studying the family is the fact that they are transversal. Although surveys gather retrospective information on fertility or health, they do not track changes in household composition over time. Hence, it is not possible to use such surveys to follow changes in family units or to identify the different individuals in a child’s environment at different times in his or her existence. Due to demographic transformations – migration, changes in marital relationships, changes in place of residence – family structures may change throughout childhood and beyond, as shown by research based on a life-course perspective (Elder 1987). A survey on families gathers information on household composition at the time of the survey, but researchers must be aware that those families are the product of past changes and that family composition is sensitive to migration, matrimonial instability, or mortality. With few exceptions, surveys are blind to this fact, and only few studies analyse longitudinal information on family composition over time as children age as, for example, found in Gaydosh (2015), Madhavan and Books (2015), or Marteleto et al. (2016).
Greenhalgh 1995; Kertzer and Fricke 1997), but little empirical work has been done for lack of appropriate data. Madhavan and her colleagues have invented an original tool, called the Kinship Support Tree, which collects information on non-cohabiting as well as cohabiting relatives. This information helps to identify the support given to children by relatives who are close at hand and by those who are more distant (Madhavan et al. 2017).
In this article, we take advantage of an in-depth small-scaled research conducted in Mali over 20 years, which combines a quantitative longitudinal survey with genealogical data to go beyond the limits of anthropological and demographic approaches to study network of kinship ties and its changes during childhood.
Therefore we are aiming for three objectives: (1) question the complexity of children’s family environment, taking into account both the morphology of their domestic group and its composition in terms of kinship; (2) examine the dynamic of this family network and the level of instability according to the type of kin; (3) discuss the place of biological parents and nuclear family in the child’s family environment, taking into account their number, their weight, and their stability over time in the domestic group.
2. Population and context
The area under study comprises a set of seven culturally and economically homogeneous villages located in southeast Mali, whose inhabitants belong to the Bwa ethnic group. This population is typical of the Sudano-Sahelian region. They mainly live on food crops raised through a family-based mode of organisation and production. Farming techniques involve little mechanisation and require many workers, a type of functioning that usually requires collaboration between all members of the various domestic groups. The level of socioeconomic development is relatively low, although in recent years the population has gained access to some types of capital goods (especially motorcycles and mobile telephones) and, since the 1990s, school attendance has been on the rise. The most recent census, that of 2009, found that half of children were going to school. The population is going through its demographic transition. It is marked by a high birth rate (about 8 children per woman in 2009), high infant mortality (5q0 = 140‰) despite a constant decrease since the 1960s. At around 3% per year,
temporary migration as a way to diversify the sources of income and face economic crisis. Since the 1990s, migration became usual among adolescent girls too, going to the cities to be employed as domestic workers. The population is very young. The children 0–12 years old, under consideration in this study, weight 48% of the population in 2009, and this age group grew by an average 2.1% per year between 1987 and 2009.
Bwa social organisation involves tight control of members, and individual and family behaviour that establishes social distinctions are frowned upon (Capron 1988; Hertrich 1996). Despite many changes that allow for greater individual initiative (less strict marriage rules, delay of the age of marriage, more migration of adolescent girls), traditional community values are predominant. The village is the main framework of Bwa social life (Capron 1988). Most daily activities are conducted in public spaces in the village. The importance of community life and sociability gives individuals a solid sense of belonging to their village. At the same time, behaviour is constantly monitored, and the group exercises a kind of social control that prevents family relations from being privatised. Families are structured by rules of patrilineal filiation; residence is patrilocal and virilocal; authority is predominantly patriarchal. Marriage is universal, and generally the couple does not have interests that are independent of the group. A couple has little autonomy in decision-making and activities, and budgets are generally separate. Polygamy concerns one out of five men in couples and one out of three women (Hertrich 2006). The divorce rate is high; 30% of unions break up in the first ten years.Women are the mobile elements of the system; they join the husband’s home when they get married and they leave his village in case of divorce. Unless they are breastfed, children stay in their father’s family or may be requested by their maternal kin in case of conflictual context. Maternal relatives have no official status in the management of political affairs or decisions, but they have a true and important role to the children, especially to provide them affective support and balancing possible tensions in the father’s lineage. Children are especially welcome in their mother’s lineage, where their informal rights have few limits.
All these factors work against construction of a space for exchange and decision-making on the level of married couples or parents.
3. The boundaries of the family
Among the Bwa, the family organisation is based on a social and political unit, the father’s lineage (or patrilineage), and an economic unit – the domestic group, or zun. The lineage is the reference unit in the political, social, and matrimonial relations with other groups. It is an exogamous unit, which plays a key role in the decision and process of marriages. The land rights are attached to the lineage, while their farming is done by the zun (headed by the zunso). The number of zun per lineage is variable, depending on its size and its history.
The most pertinent family unit from the point of view of social organisation and children’s socialisation is the domestic group (‘zun’). This type of group is made up of people who share daily activities: they farm, work, and eat together. This family unit is based on collective organisation of work in fields that are common property, under a leader (called the ‘zunso’) whose authority is recognised by each member of the zun. Food harvested from zun fields is stored in one or more granaries from which grain for meals is taken. Meals are eaten collectively; zun members gather together each day to share them. However, the zun is not a residential unit, and zun members’ huts, used mainly for sleeping, are spread out in and around the village. In polygamous marriages, each wife has her own lodging. Thus, the domestic group is not based on cohabitation; each zun has 2.6 huts on average, and they are sometimes quite far from one another. Children usually sleep in the same hut as their mother when they are young, but they often share a hut with other members of their zun as they grow older.
4. Data and methodology
4.1 Data
Data come from the SLAM Project (Suivi longitudinal au Mali, Longitudinal Survey in Mali) conducted from 1988 to 2009 in seven villages (4,300 inhabitants in 2009). This project is based on several data collection operations, including a follow-up survey and genealogical data.
composition of each zun (including splits, mergers, and disappearances) over the long run (up to 21 years). The database includes 17,622 census observations of individuals recorded as resident by the five local censuses, 8,510 being 0–12 years old at the given census.
Genealogical data were collected over time. At each survey wave, accurate information on kin ties was collected, and kinship diagrams were drawn up and updated. The diagrams were initially used to facilitate recording of data, but they later served to constitute a genealogical database. This database contains identifiers for each individual’s parents and spouse (or spouses), enabling researchers to specify kinship ties between all related individuals present in a zun at the time of each follow-up survey.4 Genealogical information is recorded by establishing a kinship chain via
individuals who are linked to both a child (ego) and another individual (alter) in the zun. In addition to direct ties (between ego and ego’s father or ego and ego’s mother), indirect ties are identified (e.g., the relationship between two brothers are depicted in the kinship chain as ego à father à child of father). We can distinguish between brothers with the same father and mother, and brothers who have only one parent in common. Similarly, more distant kinship ties can be described (cf. Appendix).5
Thank to these data, it is possible to identify all the kinship ties between all individuals present, as long as they can be depicted by a kinship chain, something statistical surveys rarely allow.
4.2 Methodology
These genealogical data, coupled with data from the follow-up survey, was treated to address two main issues: 1) describe the kin composition of the child’s environment; 2) measure the dynamic of this environment over time. The focus is on the children 0–12 years old. The child’s environment is time-located and approached by the people belonging to his/her domestic group (zun) at the given census. To examine changes in the family environment of children over time, we compare the composition of the child’s zun at two successive censuses. In order to do this, children under age 6 at a given census (date t) are identified if they are present at the next census (date t + 5), when they are between 6 and 11 years old. The population present in the zun is
4 This database was analysed with a genealogy programme called Puck (Program for the Use and
Computation of Kinship data), which identifies all individuals via whom any two people are related (Hamberger, Houseman, and Grange 2009; Hamberger and Daillant 2010; Hamberger et al. 2014).
5 This process requires defining a range for the identification algorithm used by the program when it searches
compared at the two dates to determine who has immigrated or emigrated, been born or died, or switched to another zun over the five-year period. In this way, we measure vital changes (births, deaths) and migratory changes (entrances, exits) in the composition of children’s zun between two census surveys. We then estimate the probability that relatives with different types of kinship ties present at date t will be present five years later and examine whose relatives, in the child’s environment, are more stable and whose are more unstable.
To measure the changes in the child’s environment we restricted the sample to children present at two consecutive censuses (1988–1994, 1994–1999, 1999–2004, or 2004–2009). About 20% of children were excluded (emigrants, deceased, and rare cases of missing information). Many of the children who have left the village have certainly experienced a change in their family environment, meaning that our results probably overestimate the stability of children’s family unit.
Between 1988 and 2009, we observe no main changes (or only random variations) in the structure and the dynamics of the domestic groups6 (Appendix). Therefore we
pooled the data of the five rounds to describe the complexity and the dynamics of children’s environment in their zun.
5. Results
5.1 A large and complex family environment
In the Bwa villages studied, the family units where children grow up are often large. Over the period under study (1988–2009), on average, children belonged to a zun with 14.5 members – including the child – and the median zun size was 10.5 members. One out of five children belonged to a very large zun, that is, with over 20 members, and less than 10% belonged to a zun with fewer than six members (Table 1). Hence, many adults were present (46.5% of children were living with at least five adults, i.e., people who were not single), and so were many other children (52.2% lived with at least five other children). A zun has a complex structure. Half of the children were living in a polynuclear unit, that is a group with at least two married men; 4 out of 10 were in a unit where at least one man was polygamous; more than two third were living in a zun composed of three or four generations.
By the time children reach age 12, most of them still live with a parent (more often the mother than the father); however, one quarter does not have both parents in their zun.
6 At the exception of polygamy. The percentage of zun with polygamic men has reduced since 1988 from
This brief description shows that children are socialised in a dense and complex environment, in the company of many adults other than their parents and along with many other children, the result of a fertility rate that is still high and a declining mortality rate.
Table 1: Selected characteristics of the children’s family unit. Proportion of children (0–12 years old) by the composition of their zun, 1988–2009
Composition of the domestic group (zun) % of children
Size
1–5 persons 9.0
6–9 persons 31.7
10–19 persons 39.4
20+ persons 19.9
Total 100.0
Median 10.4
Structure of the zun
Polynuclear (at least two married men) 49.6
Polygamous (at least one polygamous man) 37.6
Individuals present in the zun
At least 5 other children (0–12 years old) 51.4
At least 5 adults (ever-married) 43.3
At least 3 generations 64.0
Father and/or mother present 87.0
Father and mother present 74.5
Number of observations 8,510
Source: SLAM data; authors’ calculations.
5.2 The diversity of children’s kinship ties within their zun
5.2.1 Types of kinship ties
Using genealogical data, we identified the kinship ties between each child and all the members of his or her zun. For all children up to age 12, the total number of kinship ties identified was 114,776, classified in 443 categories.7 Some types of ties were quite
common, while others occurred only once. The ten most common accounted for 63% of the total number of ties (Table 2), the most common being brother, sister, and mother. At the other end of the distribution, 182 types of ties were observed three times or less. Most of these were distant relatives linked via many individuals. These less frequent
7 These findings are calculated in the aggregate for all five waves of the survey. The number of types of
types of ties varied greatly (e.g., two children with a great grandfather in common but no common grandfather; other ties were even more complex). In general, genealogical relations are so diverse that it is very difficult to sum them up. Data on the frequency of the 40 most common types of links are presented in Appendix Table A-1.
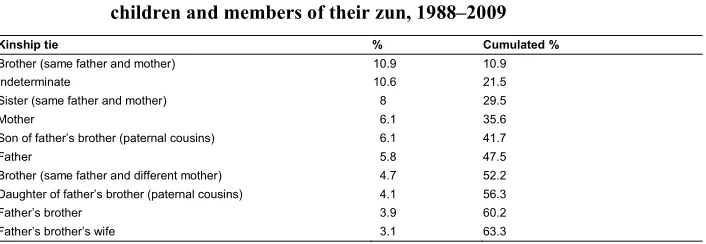
Table 2: Distribution of the ten most common types of kinship ties between children and members of their zun, 1988–2009
Kinship tie % Cumulated %
Brother (same father and mother) 10.9 10.9
Indeterminate 10.6 21.5
Sister (same father and mother) 8 29.5
Mother 6.1 35.6
Son of father’s brother (paternal cousins) 6.1 41.7
Father 5.8 47.5
Brother (same father and different mother) 4.7 52.2
Daughter of father’s brother (paternal cousins) 4.1 56.3
Father’s brother 3.9 60.2
Father’s brother’s wife 3.1 63.3
Source: SLAM data; authors’ calculations.
Note: Explanation: 10.9% of all the kinship ties of children (age 0–12) concerned a brother.
5.2.2 Classification of kinship ties
In order to handle a very heterogeneous body of information, we constructed typologies of ties between children and members of their zun. Aggregating family ties cannot follow general rules, as social organisation can be quite different between populations (Radcliffe-Brown and Forde 1950). Our data allow us to build several kinship ties typology based on the specificity of the social organisation of the Bwa population. We created three typologies that successively distinguish
· nuclear family and non-nuclear family;
· relative genealogical rank position;
· paternal and maternal relatives.
cowives, and new husbands of the mother (a rare case). Many people are members of an extended nuclear family given the frequency of polygamy and the instability of marriage. Another category is made up by relatives who are not part of the nuclear family. Finally, a group of indeterminate relations includes kinship ties that could not be classified.
The second typology is based on classificatory kinship. It distinguishes zun members by their generational rank in relation to the child. This unusual type of kinship system – labelled ‘Hawaiian’ by anthropologists (Ghasarian 1996) – is used by the Bwa and by most population groups in the region. Generation and age are of main importance to define statuses, hierarchy, and the behavior expected from each one. For instance, the father’s brothers and the mothers’ brothers will be designed as ‘father’ while the father’s sisters and the mother’s sisters are all named ‘mother.’ Between members of the same generation (genealogical rank), one (woman or man) will speak about an ‘elder’ or a ‘junior’ for the siblings of his sex but will use a generic term (brother or sister) for those from the other gender. These rules apply for every relative, even in case of extended kin ties. Through the classificatory terminology, everyone knows easily his/her position with regard to a relative and the expected rights and duties related to this position. Intergenerational ties are common and important in socialisation. In particular, grandmothers can play an important role in bringing up children. This role has been well documented in countries with a high rate of mortality due to HIV/AIDS, but it is also important elsewhere, in other contexts. A study carried out in 2006–2007 in rural Mali has shown that the oldest women present in the household play an active role when children fall ill (Ellis 2013); the same has been shown for rural Ethiopia (Gibson and Mace 2005). Hence it is important to identify such ties in children’s family environment. It is best to distinguish between maternal and paternal grandmothers, since some studies have shown that their presence does not have the same impact on children’s chances of survival (Sear et al. 2002; Sear and Mace 2008).
Thus, the third typology draws a distinction between paternal relatives (whose kinship chain goes only through the father), maternal relatives (whose kinship chain goes only through the mother), and bilateral relatives, whose kinship chain goes through both father and mother.8 In patrilineal societies, the distinction between
paternal and maternal relatives is important, and social relations with kin – concerning marriage, responsibilities, etc. – are organised around that distinction. If maternal relatives have no official status in the management of political affairs or decisions in the Bwa population, they have a true and important role to the children, especially to provide them affective support and balancing the possible tensions in the father’s
8 Bilateral relatives include core nuclear family and other relatives of ego such as children or spouse of sibling
lineage. Children are especially welcomed in their mother’s lineage, where their informal rights have few limits.
Like the second typology, the third one is rarely used in statistical surveys (Madhavan and Brooks 2015; Madhavan and Townsend 2007; Sear et al. 2002; Sear and Mace 2008), although anthropologists have highlighted the central role of paternal or maternal relatives (depending on whether the society is patrilineal or matrilineal) in children’s upbringing (e.g., what happens when parents separate and the importance of the paternal/maternal uncle).
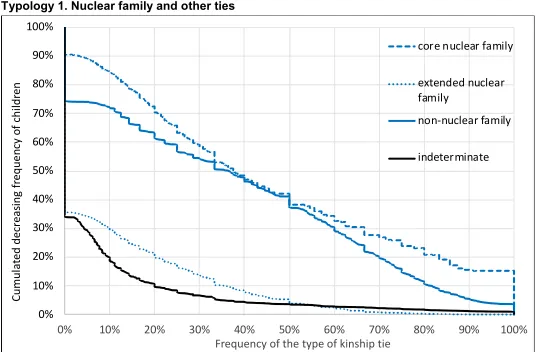
Figure 1 shows the distribution of kinship ties between a child (ego) and zun members according to different classification systems. Each typology is based on the distribution of kinship ties for the ‘average’ child, that is, between the child and the 13.5 other people present on average in the zun.
Figure 1: Distribution (%) of kinship ties between children and zun members, according to three typologies, 1988–2009
Typology 1. Nuclear family and other kin
Typology 2. Classificatory kin (intergenerational)
Typology 3. Paternal and maternal relatives
Source: SLAM data; authors’ calculations.
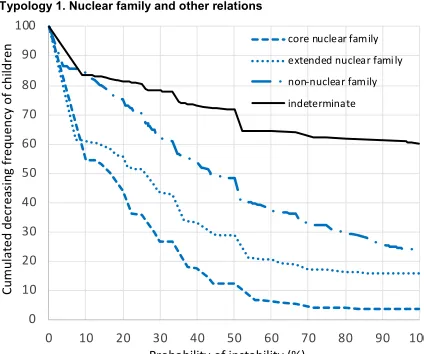
A focus on the nuclear family (Typology 1) confirms that it accounts for a minority of kinship ties in children’s family environment. On average, the core nuclear family accounts for 30% of children’s kinship ties with zun members. In other words,
0% 10% 20% 30% 40% 50% 60% 70% 80% 90% 100% indeterminate non-nuclear family core nuclear family extended nuclear family 0% 10% 20% 30% 40% 50% 60% 70% 80% 90% 100% G0 classificatory brothers / sisters
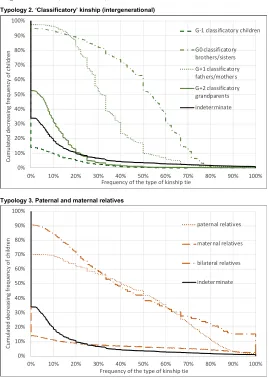
less than a third of the people in the zun with whom children share a kinship tie are of direct descent (father/mother) or full siblings (with the same two parents). However, 40% of children live in a zun where the core nuclear family accounts for the majority – at least 50% – of their kinship ties (Figure 2). The extended nuclear family accounts for 10% of ties on average, mostly with half-siblings. Finally, this first typology reveals that most kinship ties (60%) concern relatives who are neither parents nor full siblings of children.
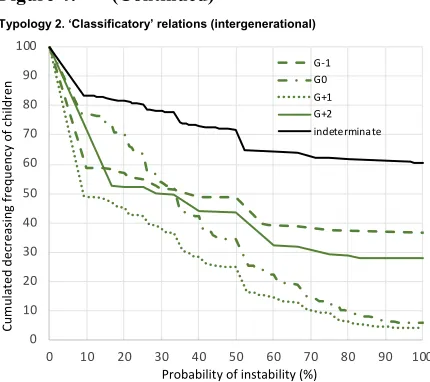
Concerning the second typology, relationships with individuals of the same genealogical rank as the child (G0) predominate (45% of ties, Figure 1, Typology 2). In terms of distribution, 60% of children live in a zun where collateral relatives account for the majority (at least 50%) of kinship ties (Figure 2, Typology 2). This is easily explained by demographic conditions characterised by high fertility, a large drop in mortality among children and adolescents (Samuel and Hertrich 2016), and polygamy. Many people in the zun have the same genealogical rank as children’s biological parents (G+1) (30% of kinship ties); patrilineal organisation results in the presence of many of the father’s collateral relatives (mainly brothers and their wives). Relatives with the rank of grandparents (G+2) account for 6% of kinship ties. This category is quite small because a child can only have four grandparents and because mortality is high in this group. However, about half of children have classificatory grandparents in their zun (Figure 2, Typology 2).
Generally, there are few members of Generation G-1, which represents classificatory ‘children.’ This reflects the fact that the age gap between collateral relatives can be large; even when ego is not more than 12 years old, he or she may have ‘nephews’ or ‘nieces.’
These results hold whatever the survey date or children’s gender. However, as children grow up, the share of those with relatives of the same generational rank increases because of births of siblings and cousins; the share of relatives of a higher rank diminishes due to mortality among adults.
The third typology focused on maternal and paternal ties shows that on average, half of children’s kinship ties within their zun stem from the paternal side; bilateral ties make up 45% of all ties; maternal relatives account for only a small fraction of ties (less than 5%).9 Paternal kin are thus central in children’s environment; 70% of children have
at least one paternal relative (outside the core nuclear family), compared to only 14% with a maternal relative (Figure 2, Typology 3).
9 The small share of maternal relatives is due primarily to this society’s patrilocal and patrilineal organisation.
Specification of kinship ties between children and their surrounding family makes it possible to adopt different perspectives. The three typologies proposed highlight the nuclear family, classificatory kin, and collateral kin respectively. Since each one captures a different form of organisation of the family around the child, together they give a picture of the diversity of these forms. What emerges is the weight of ties with the closest kin (although these ties are not in the majority), the overriding importance of ties with relatives of the same generation, and the importance of patrilineal relatives. These relatives are the main figures in children’s socialisation. Domestic units also have individuals whose kinship tie is not ascertained (indeterminate). On average, this category accounts for 10% of children’s kinship ties within the zun. The distribution of this category among children is highly polarised (Figure 2); 65% of children live in a zun where they have no such kinship tie, but 10% of children live in a zun where this type of tie accounts for 20% of all their kinship ties. Hence, the importance of this type of tie varies greatly from one zun to another.
Figure 2: Distribution of the frequency of types of kinship ties between children and members of their zun
Typology 1. Nuclear family and other ties
0% 10% 20% 30% 40% 50% 60% 70% 80% 90% 100%
0% 10% 20% 30% 40% 50% 60% 70% 80% 90% 100%
Cumul
at
ed decreas
ing
fr
eque
n
cy
o
f chi
ldr
en
Frequency of the type of kinship tie
core nuclear family
extended nuclear family
non-nuclear family
Figure 2: (Continued)
Typology 2. ‘Classificatory’ kinship (intergenerational)
Typology 3. Paternal and maternal relatives
Source: SLAM data; author’s calculations.
Note: Explanation: Typology 1: 90% of children live a zun with at least a member of their core nuclear family; 40% of children live in a zun where members of their core nuclear family account for at least 50% of their kinship ties; 60% live in a zun where members of their core nuclear family account for less than 50% of their kinship ties.
0% 10% 20% 30% 40% 50% 60% 70% 80% 90% 100%
0% 10% 20% 30% 40% 50% 60% 70% 80% 90% 100%
Cumulat
ed decr
eas
ing fr
eque
ncy
o
f chi
ldr
en
Frequency of the type of kinship tie
G-1 classificatory children
G0 classificatory brothers/sisters
G+1 classificatory fathers/mothers
G+2 classificatory grandparents
indeterminate
0% 10% 20% 30% 40% 50% 60% 70% 80% 90% 100%
0% 10% 20% 30% 40% 50% 60% 70% 80% 90% 100%
Cumulat
ed decreasing frequency of chi
ldren
Frequency of the type of kinship tie
paternal relatives
maternal relatives
bilateral relatives
5.3 Dynamic in children’s family environment between censuses
Individuals spend their childhood in the company of many other children and of adults of both sexes with whom they have many types of kinship ties. The transversal approach used up until now does not enable us to determine how stable this environment is. Are children’s complex and diverse environments relatively stable? Or do relatives move? The two experiences are very different. In the first case, both close and distant relatives, present during childhood, build up lasting relationships with a child. In the second case, complexity of relations, coupled with mobility, makes for relatively fleeting relationships and also for still greater diversity in the types of kinship ties experienced by children.
5.3.1 Decomposition of demographic factors in domestic groups changes
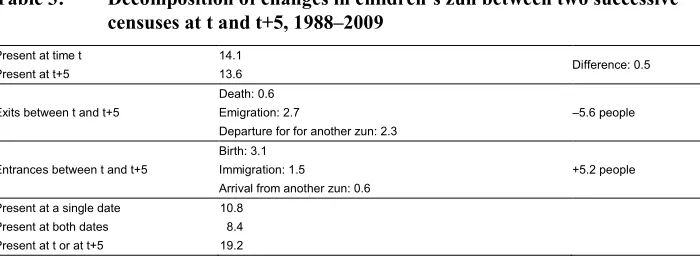
Longitudinal data can be used to measure changes in the people present in a child’s zun from one census to the next, over a five-year time interval. The average number of people in a zun went from 14.1 at the beginning of the observation period (date t) to 13.6 people five years later (date t+5).10 This stability in zun size masks rapid changes
in its composition due to births, deaths, and migration outside the villages and between villages (Table 3). Out of the 14.1 people present on average at the beginning of the observation period, 5.6 are no longer there five years later and 5.2 individuals have replaced them.
In this population group in the middle of the demographic transition, births are the main factor of zun population growth (3.1 births on average). The second most important factor is migration into the villages under study (+1.5 individuals) or between villages (+0.6 individuals). These entrances are almost completely offset by exits, consisting mostly of emigration (–2.7) and also departures to other zuns in the village (–2.3).11 This mechanism of entrances and exits leads to large changes in zun
composition over a relatively short length of time.
10 These figures aggregate the four periods between censuses: 1988–1994, 1994–1999, 1999–2004, 2004–
2009. This number differs from the 14.5 members cited in the section above entitled “A large and complex family environment.” The number here is lower because only 80% of children are considered, namely those aged 0 to 6 in t and present in t and t+5.
11 Departures to other zun refer to the point of view of the child. These moves are due either to individuals
Table 3: Decomposition of changes in children’s zun between two successive censuses at t and t+5, 1988–2009
Present at time t 14.1
Difference: 0.5
Present at t+5 13.6
Exits between t and t+5
Death: 0.6
–5.6 people Emigration: 2.7
Departure for for another zun: 2.3
Entrances between t and t+5
Birth: 3.1
+5.2 people Immigration: 1.5
Arrival from another zun: 0.6
Present at a single date 10.8
Present at both dates 8.4
Present at t or at t+5 19.2
Source: SLAM data; authors’ calculations.
Note: Explanation: On average, 14.1 people were present in a child’s zun at the beginning of the period of observation. Of those people, 2.7 migrated over the following five years.
If we take into account the people present in a child’s environment at two successive censuses, on average, there are a little more than 19 people in a child’s environment rather than 14, counting both those present at the first observation and at the second (Table 3). On average, only 44% of individuals stay in a same zun of the child over a five-year period.12 In other words, from a child’s point of view, most of the members of the family environment change over the five years between two censuses.
Over the five years between two censuses, only 5% of children experience no change in the makeup of their zun (excluding births); half of children experience renewal of at least a third of the members of their zun; 20% of children experience renewal of up to half of the members.
5.3.2 The dynamics of kinship ties
Children share the experience of a dense network of diverse relationships subject to swift change in the individuals present. This instability over the first years of their lives affects children differently depending on the type of kinship ties they have. The most stable and least stable ties should be distinguished. Table 4 and Figure 3 show the instability of kinship ties by giving the probability, for a given type of relationship or group of types of relationships, of being present in a child’s zun at time t and absent at time t+5.
12 Of course, it is possible for an individual to be present at the two census dates and to have been absent over
Instability depends heavily on the type of kinship tie. The most stable relationships are those with members of the core nuclear family (Figure 3, Category 1), in particular for fathers and mothers (Table 4). For example, there is an 8% probability that a child’s mother present at date t will be absent five years later; this is the lowest probability of absence for all kinship ties. The probability that the father will be absent is 10%, the second lowest. In contrast, siblings are much more instable. The probability that sisters (same father, same mother) will be absent is 37%; more will be said about the reasons for this instability below. Consequently, even the most stable relationships, such as those within the core nuclear family, change a good deal.13 This is particularly true of
female kin; the probability for a child that female relatives in his or her core nuclear family will not all be present in five years is 24%, versus 17% for male relatives. Although the most stable relationships are usually those within the nuclear family, in terms of distribution (Figure 4), half of children experience a change of at least 25% of the members of their extended nuclear family.
Table 4: Proportion of children’s relatives present at t and absent at t+5 (%), by type of kinship tie, 1988–2009
Type of kinship tie %
Mother 8.0
Father 9.6
Brother (same father and mother) 21.4
Brother (same father and different mother) 24.9
Paternal grandmother 30.7
Sister (same father and mother) 37.3
Paternal grandfather 38.9
Brother (same mother and different father) 40.0
Father’s brother 45.8
Sister (same father and different mother) 46.0
Brother’s/sister’s son of the mother 46.8
Brother’s/sister’s son of the father 47.3
Sister (same mother) 51.9
Brother’s/sister’s daughter of the mother 58.7
Brother’s/sister’s son of the father 59.3
Other relatives 61.5
Indeterminate kinship tie 66.3
Father’s sister 67.9
Source: SLAM data; authors’ calculations.
Note: Explanation: 21.4% of the full brothers of children under age 13 who are present in the child’s zun at time t are absent in t+5.
13 The probability for a child’s relatives to move within five years is positively correlated with the zun’s size.
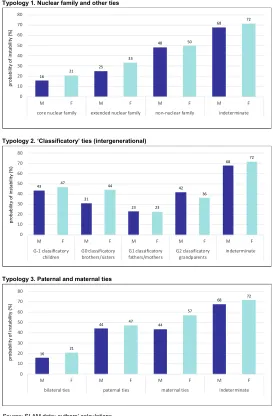
Figure 3: Proportion of children’s relatives present at time t and absent in t+5 (%), by type and gender of kinship relatives
Typology 1. Nuclear family and other ties
Typology 2. ‘Classificatory’ ties (intergenerational)
Typology 3. Paternal and maternal ties
Source: SLAM data; authors’ calculations.
Note: Explanation: Typology 1: 16% of a child’s male relatives who are members of the child’s core nuclear family (child under age 13) and present at time t, are absent in t+5. Typology 2: 44% of a child’s female relatives, who are members of the child’s genealogical rank (G0) and present at time t, are absent in t+5. Typology 3: 44% of a child’s male relatives with a paternal ties, and present at time t, are absent in t+5.
16 21 25 33 48 50 68 72 0 10 20 30 40 50 60 70 80
M F M F M F M F
core nuclear family extended nuclear family non-nuclear family indeterminate
prob
abilit
y of ins
tability (%) 43 47 31 44 23 23 42 36 68 72 0 10 20 30 40 50 60 70 80
M F M F M F M F M F
G-1 classificatory children G0 classificatory brothers/sisters G1 classificatory fathers/mothers G2 classificatory grandparents indeterminate p
robability of ins
tability (%)
16 21
44 47 44 57 68 72 0 10 20 30 40 50 60 70 80
M F M F M F M F
bilateral ties paternal ties maternal ties indeterminate
pr
o
ba
b
ility of i
ns
tab
ili
For relatives considered as a function of their generational rank (Typology 2), individuals in the same generation as a child are more likely to leave (Figures 3 and 4), due to frequent migration of young people to find work (Lesclingand et al. 2016; Lesclingand and Hertrich 2017) and to girls’ departure to their husband’s home upon marriage. This factor provides much of the explanation for why female relatives – sisters or female cousins – are less stable than male relatives. However, mothers are more stable than fathers, and grandmothers are more stable than grandfathers, due to the age gap between spouses; wives are usually younger than husbands, so wives are less likely to die during the five years that elapse between censuses.
Matrilineal or patrilineal kinship ties (Typology 3) are slightly more unstable when they concern women, but maternal kin is not very present in children’s zuns.
We are far indeed from the picture of family stability that emerges from successive transversal measurements of family structures. On the contrary, a longitudinal approach based on changes in families at the individual level reveals large transformations in family environments that concern, to different degrees, all categories of children’s relatives.
Figure 4: Distribution of the proportion (%) of children’s relatives present at t and absent at t+5, by type of kinship tie, 1988–2009
Typology 1. Nuclear family and other relations
0 10 20 30 40 50 60 70 80 90 100
0 10 20 30 40 50 60 70 80 90 100
C u m u la te d d e cr e as in g fr e q u e n cy o f ch ild re n
Probability of instability (%)
Figure 4: (Continued)
Typology 2. ‘Classificatory’ relations (intergenerational)
Typology 3. Paternal and maternal relatives
Source: SLAM data; authors’ calculations.
Note: Explanation: 11% of children live in a zun where 50% of their core nuclear relatives present at t are absents at t+5. 45% of children live in a zun where 50% of their non-nuclear relatives present at t are absents at t+5.
0 10 20 30 40 50 60 70 80 90 100
0 10 20 30 40 50 60 70 80 90 100
C u m u la te d d e cr e as in g fr e q u e n cy o f ch ild re n
Probability of instability (%)
G-1 G0 G+1 G+2 indeterminate 0 10 20 30 40 50 60 70 80 90 100
0 10 20 30 40 50 60 70 80 90 100
C u m u la te d d ec re as in g fr eq u en cy o f ch ild re n
Probability of instability (%)
6. Discussion and conclusion
The key question posed in our introduction is to know if it is possible to reconcile anthropological and demographic approaches to study children’s family environment. Through a local study on a rural population group in southeast Mali, spanning a period of 20 years, we developed an original longitudinal survey method that provides specific tools for apprehending the reality of family environments in all their detail, including changes in those environments. First, the choice of unit of observation and analysis is essential. Instead of assuming that the residential unit, that is, the household, is the relevant unit, we focussed on a larger unit, namely the zun. This unit is the basis of the social and economic organisation of the population. Within this unit, financial resources are allotted to children, and decisions are taken about their upbringing. Longitudinal morphological data served to characterise the structure of zuns, and hence the types of family arrangements in children’s environment (presence of parents, number of couples, polygamy, etc.). The use of a genealogical database in addition opened up other avenues of investigation by making it possible to identify kinship ties between children and all the other members of their zuns. This is an innovation in statistical studies on the family. Longitudinal studies on the family and on childhood in Africa are rare. To the best of our knowledge, no other study has used such detailed genealogical information to look at family dynamics by identifying the different types of kinship ties in children’s environment.
different amounts of time and resources. Although we cannot measure the intensity of children’s relationships with their kin, we can hypothesise that relational diversity gives children a wealth of relational resources that potentially can be converted into social capital to be mobilised later in life, when family solidarity is needed. For example, the extended family is often helpful for sheltering people during an urban migration (Aldous 1962). In the Bwa population for instance, young girls in work migration in Bamako can count on this social network to find a job (Lesclingand 2004).
The second axis of our analysis concerns changes in the family. Our longitudinal survey data have enabled us to explore changes in family structure over time (in five-year periods), concerning both the number of people present in children’s environment and the stability of ties with relatives. Results show that the family structures that surround children are complex social organisations that are constantly changing. The density and instability of the family environment are central to children’s experience. On average, children have 14 people in their zun. This number varies little over time, but more than half of the 14 people change over five years. Members of the core nuclear family are the most stable, but even so, over five years, the risk of a change in a member of the core nuclear family can be as high as 36%. More distant relatives, of whom many are many present in the zun, come and go.
Our results matching longitudinal demographic and genealogical data demonstrate the risk of bias when data on the family are limited to people present in the household at a given date. This approach is the most common, since it can be applied directly using both statistical surveys and census data. It can freeze and distort the contours of the family by ignoring certain relatives and non-relatives who live in the same economic unit more or less permanently and are in contact with children. Such an approach can overemphasise the importance of the nuclear family, which is the most stable part of a child’s environment. We have shown that the family in this restricted sense is far from providing the main framework for socialisation.
7. Acknowledgements and funding
Our colleague and friend Véronique Hertrich died in 2019 before the publication of this article. We pay tribute to her for her great contribution to the demography of the African family.
We warmly thank the Institut de la statistique du Mali (Instat) for allowing us to use national census data, our colleagues in the DyPE project for their constructive feedback, and, in the field, our assistant interpreters and the population of the villages studied for their welcome and long-term investment in the survey.
This publication article was prepared under the project DyPE – “Childhood and Parenthood Dynamics in rural Africa” conducted with the financial support of The
French National Research Agency(ANR-12-BSH1-0005-01) and the financial support
of the Marie Sklodowska-Curie H2020 grant n°690984.
Results are based on data from the SLAM project (“Suivi longitudinal au Mali”), under the scientific responsibility of Véronique Hertrich (Ined, Paris, France).
References
Adams, A.M., Madhavan, S., and Simon, D. (2002). Women’s social networks and child mortality in Mali. Social Science and Medicine 54(2): 165–178.
doi:10.1016/S0277-9536(01)00017-X.
Aldous, J. (1962). Urbanization, the extended family, and kinship ties in West Africa.
Social Forces41(1): 6–12.doi:10.2307/2572913.
Bonvalet, C. and Lelièvre, E. (2012). Du concept de ménage à celui d’entourage. In: Bonvalet, C. and Leliève, E. (eds.). De la famille à l’entourage. Paris: INED: 51–66.
Caldwell, J. and Caldwell, P. (1987). The cultural context of high fertility in sub-Saharan Africa. Population and Development Review 13(3): 409–437.
doi:10.2307/1973133.
Caldwell, J., Hill, A.G., and Hull, V.J. (1988). Micro-approaches to demographic
research. London: Kegan Paul.
Capron, J. (1988). Introduction à l’étude d’une société villageoise, 1955–1968.Tours: Université François-Rabelais de Tours.
Desai, S. (1992). Children at risk: The role of family structure in Latin America and West Africa.Population and Development Review 18(4): 689–717.doi:10.2307/ 1973760.
Dozon, J.-P. (1986). En Afrique, la famille à la croisée des chemins. In: Burguière, A., Klapisch-Zuber, C., Ségalen, M., and Zonabend, F. (eds.).Histoire de la famille:
2. Le choc des modernités. Paris: Armand Colin: 301–337.
Elder, G.H. (1987). Families and lives: Some developments in life-course studies.
Journal of Family History 12(1–3): 179–200. doi:10.1177/03631990870
1200110.
Ellis, A.A., Doumbia, S., Traore, S., Dalglish, S.L., and Winch, P.J. (2013). Household roles and care-seeking behaviours in response to severe childhood illness in Mali. Journal of Biosocial Science 45(6): 743–759. doi:10.1017/S002 1932013000163.
Gastellu, J.-M. (1980). Mais, où sont donc ces unités économiques que nos amis cherchent tant en Afrique? Cahiers de l’ORSTOM, Série Sciences Humaines
17(1–2): 3–11.
Gaydosh, L. (2015). Childhood risk of parental absence in Tanzania. Demography
52(4): 1121–1146.doi:10.1007/s13524-015-0411-4.
Ghasarian, C. (1996).Introduction à l’étude de la parenté.Paris: Seuil.
Gibson, M.A. and Mace, R. (2005). Helpful grandmothers in rural Ethiopia: A study of the effect of kin on child survival and growth.Evolution and Human Behavior
26(6): 469–482.doi:10.1016/j.evolhumbehav.2005.03.004.
Goody, E.N. (1978). Some theoretical and empirical aspects of parenthood in West Africa. In: Oppong, C., Adaba, G., Bekombo-Priso, M., and Mogey, J. (eds.).
Marriage, fertility and parenthood in West Africa. Canberra: Australian National
University: 227–272.
Greenhalgh, S. (1995). Situating fertility: Anthropology and demographic inquiry. Cambridge: Cambridge University Press.doi:10.1017/CBO9780511621611. Hamberger, K. and Daillant, I. (2010). L’analyse de réseaux de parenté: Concepts et
outils. Annales de démographie historique 116(2): 13–52. doi:10.3917/adh. 116.0013.
Hamberger, K., Grange, C., Houseman, M., and Momon, C. (2014). Scanning for patterns of relationship: Analyzing kinship and marriage networks with Puck
2.0. The History of the Family 19(4): 564–596. doi:10.1080/1081602X.
2014.892436.
Hamberger, K., Houseman, M., and Grange, C. (2009). La parenté radiographiée: Un nouveau logiciel pour l’analyse des réseaux matrimoniaux. L’homme 3: 107– 137.doi:10.4000/lhomme.22205.
Hertrich, V. (1996). Permanences et changements de l’Afrique rurale: Dynamiques familiales chez les Bwa du Mali. Paris: Centre français sur la population et le développement (Les Études du CEPED 14).
Hertrich, V. (2006). La polygamie: Persistance ou recomposition? Le cas d’une population rurale du Mali. Cahiers québécois de démographie 35(2): 39–70.
doi:10.7202/018592ar.
Isiugo-Abanihe, C.U. (1994). Parenthood in sub-Saharan Africa: Child fostering and its relationship with fertility. In: Locoh, T. and Hertrich, V. (eds.). The onset of
fertility transition in sub-Saharan Africa. Liège: Derouaux Ordina Editions:
163–174.
Kertzer, D.I. and Fricke, T. (1997). Anthropological demography: Toward a new
synthesis. Chicago: The University of Chicago Press.
Kriel, A., Randall, S., Coast, E., and de Clercq, B. (2014). From design to practice: How can large-scale household surveys better represent the complexities of the social units under investigation. African Population Studies 28(3): 1309–1323.
doi:10.11564/0-0-618.
Lesclingand, M. (2004). Nouvelles stratégies migratoires des jeunes femmes rurales au Mali: De la valorisation individuelle à une reconnaissance sociale. Sociétés
contemporaines 55(3): 21–42.doi:10.3917/soco.055.0021.
Lesclingand, M. and Hertrich, V. (2017). When girls take the lead: Adolescent girls’ migration in Mali.Population 72(1): 63–91.doi:10.3917/popu.1701.0063. Lesclingand, M., Pilon, M., Jacquemin, M., and Hertrich, V. (2016). Genre et
migrations dans l’enfance et l’adolescence au Mali. In: Jacquemin M., Bonnet, D., Deprez, C., Pilon, M., and Pison, G. (eds.). Etre fille ou garçon: Regards
croisés sur l’enfance et legenre. Paris: INED: 203–224.
Madhavan, S. and Brooks, A. (2015). Family complexity in rural South Africa: Examining dynamism in children’s living arrangement and the role of kin.
Journal of Comparative Family Studies 46(4): 483–498. doi:10.3138/jcfs.
46.4.483.
Madhavan, S. and Townsend, N. (2007). The social context of children’s nutritional status in rural South Africa. Scandinavian Journal of Public Health 35(69S): 107–117.doi:10.1080/14034950701355700.
Madhavan, S., Clark, S., Beguy, D., Kabiru, C., and Gross, M. (2017). Moving beyond the household: Innovations in data collection on kinship. Population Studies
Marteleto, L.J., Cavanagh, S., Prickett, K., and Clark, S. (2016). Instability in parent– child coresidence and adolescent development in urban South Africa.Studies in
Family Planning 47(1): 19–38.doi:10.1111/j.1728-4465.2016.00048.x.
Pilon, M. and Vignikin, K. (2006). Ménages et familles en Afrique subsaharienne. Paris: Éditions des archives contemporaines.
Puck (2019). Program for the Use and Computation of Kinship data: Logiciel issus du groupe de travail: Traitement informatique de la parenté [electronic resource].
https://www.kintip.net/.
Radcliffe-Brown, R. and Forde, D.I. (1950). Introduction. In: Radcliffe-Brown, A.-R. and Forde, D.I. (eds.). African systems of kinship and marriage. London: International African Institute, Oxford University Press.
Randall, S., Coast, E., and Leone, T. (2011). Cultural constructions of the concept of household in sample surveys. Population Studies 65(2): 217–229.doi:10.1080/ 00324728.2011.576768.
Samuel, O. and Hertrich, V. (2016). Structures familiales, encadrement communautaire et survie des enfants: Une recherche en milieu rural malien.African Population
Studies 30(1): 2160–2176.doi:10.11564/30-1-798.
Sear, R. and Mace, R. (2008). Who keeps children alive? A review of the effects of kin on child survival. Evolution and Human Behavior 29(1): 1–18. doi:10.1016/ j.evolhumbehav.2007.10.001.
Sear, R., Steele, F., McGregor, I.A., and Mace, R. (2002). The effects of kin on child mortality in rural Gambia. Demography 39(1): 43–63. doi:10.1353/dem.2002. 0010.
van de Walle, E. (2006). African households: Census and surveys: A general
Appendix
Determining and counting kin and types of kinship ties
Figure A-1: Kinship diagram
The kinship diagram above shows kinship ties for an imaginary zun composed of 12 people.
Each individual has 11 different kinship ties within the zun, making a total of 12*11 = 132 ties.
Some of the types of ties occur several times. For example, the individual Wathyo has no kinship tie with any other member of his zun. Among the 132 ties in the zun, there exist 11 between Wathyo and other members and 11 between other members and Wathyo, all of which will be classified as ‘indeterminate.’
Following the same principle, there exist 7 ties between a child and his or her mother that will be classified as ‘mother’ ties. However, in this case, these ties are not symmetrical. If the mother is the starting point, she will have 4 ties classified as ‘daughter’ (Mandu, Pune, Wesara and Sehamba) and 3 classified as ‘son’ (Dacko, Nyeni, and Winima).
The table below shows the five most frequent types of link in this example:
Type of kinship tie Frequency
Indeterminate 22
Mother 7
Father 7
Sister 6
Brother 6
Another approach is to determine for each individual ego the proportion of links of each type in the total number of ties the individual has within the zun. If the approach is not centred on ego as in the preceding example, indeterminate ties are the most common. This is because each individual person in the zun has an indeterminate tie with Wathyo, and not all of them have a mother, a father, or another type of kinship tie.
The perspective is different when the approach is centred on ego. For example, Winima, son of the couple Dacko and Niana, has two sisters, Wesahare and Sehamba. These sisters account for 2 ties out of a total 11 whereas the indeterminate tie with Wathyo represents 1 tie out of 11.
In the case of Winima, if we apply Typology 2, which is based on relations between generations, the distribution of kinship ties is the following:
Kinship tie Frequency %
Classificatory brothers and sisters 3 27.3
Classificatory fathers and mothers 5 45.5
Classificatory grandparents 2 18.2
Indeterminate 1 9.1
Table A-1: Distribution of the 40 most common types of kinship ties
Link Number % Relation Number %
Brother (same father & mother) 12513 10.9 Sister (same father & mother) of father 915 0.8
Indeterminate 12168 10.6 Wife of brother (same father & mother) 734 0.6
Sister (same father & mother) 9170 8.0 Daughter of sister (same father & mother) of
father 727 0.6
Mother 7048 6.1 Daughter of brother (same father & mother)of paternal grandfather 662 0.6
Son of brother (same father & mother) of
father 7014 6.1 Brother (same father & mother) of mother 656 0.6
Father 6688 5.8 Sister (same father only) of father 655 0.6
Brother (same father only) 5424 4.7 Son of sister (same father & mother) of father 643 0.6
Daughter of brother (same father &
mother) of father 4726 4.1 Son of brother (same father & mother) ofmother 584 0.5
Brother (same father & mother) of father 4498 3.9 Daughter of son of father (same father &mother) of father 568 0.5
Wife of brother (same father & mother) of
father 3574 3.1 Son of son of brother (same father & mother)of father 530 0.5
Sister (same father only) 3450 3.0 Son of son of brother (same father & mother)of father 530 0.5
Mother of father
(paternal grandmother) 3098 2.7 Grandson of brother (same father & mother)of paternal grandfather 513 0.4
Wife of father 2649 2.3 Wife of son of brother (same father & mother)of father 512 0.4
Son of brother of father of father
(son of paternal grandfather’s brother) 2571 2.2 Wife of brother (same father only) of father 488 0.4
Father of father
(paternal grandfather) 2052 1.8 Daughter of brother of mother 465 0.4
Brother of father of father (brother of
paternal grandfather) 1633 1.4 Daughter of brother (same father & mother) 435 0.4
Daughter of brother (same father only) of
father 1397 1.2 Son of brother (same father only) 398 0.3
Wife of father of father 1370 1.2 Mother of mother (maternal grandmother) 388 0.3
Wife of brother (same father only) of
father 1134 1.0 Granddaughter of brother (same father &mother) of paternal grandfather 388 0.3
Son of brother (same father only??) of
father 1022 0.9 Wife of brother (same father & mother) ofmother 384 0.3
Table A-2: Selected characteristics of the children’s family unit. Proportion of children (0–12 years old) by the composition of their zun and census date
% of children
Composition of the domestic group (zun) 1988 1994 1999 2004 2009
Size
1–5 persons 10.5 9.5 8.4 9.6 7.7
6–9 persons 30.1 30.9 31.4 32.4 33.3
10–19 persons 41.7 36.2 40.2 40.9 38.4
20+ persons 17.8 23.4 20.1 17.1 20.7
Total 100 100 100 100 100
Median 10.5 10.8 10.2 10.3 10.5
Structure
Polynuclear (at least two married men) 51.5 50.1 48.4 45.9 52.3
Polygamic (at least one polygamous man) 41.3 42.5 36.9 33.2 35.5
Mean number of member of nuclear cell* 59.3 59.8 62.5 61.6 60.5
Individuals present
At least 5 other children (0–12) 52.2 55.4 49.9 48.5 51.6
At least 5 adults 46.5 42.8 44.5 40.8 42.7
At least 3 generations 64.0 64.6 62.4 62.8 66.0
Father and/or mother present when child is 12 86.4 88.1 88.2 86.9 85.6
Father and mother present when child is 12 75.0 77.3 77.0 72.9 71.0
Number of observations 1,310 1,656 1,734 1,766 2,044
Source: SLAM data; authors’ calculations.