VOLUME 39, ARTICLE 42, PAGES 1105
,
1150
PUBLISHED 29 NOVEMBER 2018
https://www.demographic-research.org/Volumes/Vol39/42/ DOI: 10.4054/DemRes.2018.39.42
Research Article
Family histories and the demography of
grandparenthood
Bruno Arpino
Jordi Gumà
Albert Julià
© 2018 Bruno Arpino, Jordi Gumà & Albert Julià.
This open-access work is published under the terms of the Creative Commons Attribution 3.0 Germany (CC BY 3.0 DE), which permits use, reproduction, and distribution in any medium, provided the original author(s) and source are given credit.
1 Introduction 1106
2 Background 1107
2.1 The importance of studying the demography of grandparenthood 1107 2.2 Previous studies on the demography of grandparenthood 1108 2.3 Mechanisms influencing the demography of grandparenthood 1109
2.4 Research goals 1111
3 Data and methods 1112
3.1 Data and variables 1112
3.2 Analytic strategy 1115
3.2.1 Sequence and cluster analysis of fertility and partnership
trajectories 1115
3.2.2 Regression analyses 1117
4 Results 1118
4.1 Sequence and cluster analysis 1118
4.2 Family histories and the probability to be a grandparent 1122
4.3 Family histories and number of grandchildren 1129
4.4 Family histories and the probability of having a grandchild aged 10
or younger 1132
4.5 Additional analyses and robustness checks 1136
5 Conclusion and discussion 1136
References 1140
Family histories and the demography of grandparenthood
Bruno Arpino1 Jordi Gumà2 Albert Julià2
Abstract
BACKGROUND
Grandparenthood is an important phase of life for many individuals, and the grandparent role has consequences on younger generations and grandparents themselves.
OBJECTIVE
Despite the importance of the grandparent role, little is known about the demography of grandparenthood. In this study, we examine the variability of demographic aspects of grandparenthood (being a grandparent, number of grandchildren, having at least one young grandchild) according to family (partnership and fertility) histories.
METHODS
Using retrospective data from the Survey of Health, Ageing and Retirement in Europe (SHARE), we employ sequence and cluster analyses to group individuals according to similar patterns of fertility and partnership histories observed between age 15 and 49. In a second step, we use logistic and Poisson regressions to quantify how demographic aspects of grandparenthood vary across the identified family clusters at different ages and by gender.
RESULTS
Family histories are greatly heterogeneous with respect to timing, quantum, and probability of experiencing certain events. This heterogeneity is reflected in a strong variability in the probability of having (young) grandchildren and their number at different ages across the clusters of family trajectories.
CONTRIBUTION
We provide a detailed profile of three demographic characteristics of grandparenthood that significantly influence the opportunity structure for the development of the
grandparent role. Our study quantifies considerable heterogeneities in the demography of grandparenthood according to different typologies of family histories and has important implications for the understanding of current and possible future developments of the grandparent role.
1. Introduction
In contemporary aging societies, grandparents’ lives and those of their grandchildren overlap markedly (Bengtson 2001; Harper 2005; Leopold and Skopek 2015a; Margolis 2016). As a consequence of changes in mortality, compared to the earlier 1900s, nowadays grandparents are more likely to survive throughout their grandchildren’s childhood (Hagestad 2006; Uhlenberg 2005). Today’s grandparents are also on average healthier and have fewer grandchildren to support than in the past (Uhlenberg 2005; Margolis and Wright 2017a). These demographic changes have created an unprecedented opportunity for the development of the grandparent role (Timonen and Arber 2012). In many countries, for example, a considerable proportion of grandparents, especially grandmothers, provide care to their grandchildren (Bordone, Arpino, and Aassve 2017; Glaser et al. 2013; Hank and Buber 2009).
Availability and help received from grandparents have been found to influence young mothers’ labor force participation (Aassve, Arpino, and Goisis 2012) and fertility (Aassve, Meroni, and Pronzato 2012; Schaffnit and Sear 2017; Sear and Coall 2011), particularly in countries where the services offered by the market are costly and public provision is scarce.
Having grandchildren and the amount and quality of relationships grandparents have with them also influence grandparents’ health. Most studies focusing on supplementary childcare have reported positive effects on grandparents’ health and well-being (Arpino, Bordone, and Balbo 2018; Arpino and Bordone 2014; Di Gessa, Glaser, and Tinker 2016; Hughes et al. 2007; Moore and Rosenthal 2015). Other studies have shown negative consequences on grandparents’ physical and psychological health (Grinstead et al. 2003; Triadó et al. 2014), especially when instrumental and high intensity childcare are considered.
the ‘linked lives’ principle (Elder 1994), our findings point to a great heterogeneity in the demography of grandparenthood across different clusters of family histories both for women and men.
2. Background
2.1 The importance of studying the demography of grandparenthood
Studying the demography of grandparenthood is crucial to better understand the current role of grandparents and its potential future development. The likelihood, intensity, quality, and effects of grandparent–grandchildren relationships (and those with the middle generation) are in fact strictly related with, among other things, the demography of grandparenthood. Three demographic characteristics are particularly salient and are the object of the current study: age of grandparents, age of grandchildren, and their number.
Mueller and Elder (2003) notice that age and number of grandchildren, together with geographical proximity, describe an opportunity structure for interactions between the generations. The literature on the determinants of grandparenting has consistently shown that the likelihood of (intensive) provision of grandchild care is considerably higher when grandchildren are young (Hank and Buber 2009; Oppelaar and Dykstra 2004). The age of grandparents is also relevant. On the one hand, younger grandparents are more likely to be physically and mentally fit, and this increases the likelihood of (intensive) grandchild care provision (Hank and Buber 2009). On the other hand, grandparents’ age defines the other roles they may occupy, such as being active in the labor market (Leopold and Skopek 2015a, 2015b), which may compete with the grandparent role.
The number of grandchildren is also a significant demographic aspect of grandparenthood. The higher the number of grandchildren, the more likely they are to live close and have contacts with some of them. Notwithstanding, the higher the number of grandchildren, the lower the time (Oppelaar and Dykstra 2004) and money (Silverstein and Marenco 2001) that can be dedicated to each grandchild. Moreover, a grandparent with a large number of grandchildren may find it difficult to be a significant figure for all of them (Mueller and Elder 2003).
2.2 Previous studies on the demography of grandparenthood
Demographers have long been interested in kinship size and characteristics (Wolf 1994), a topic that has received a renewed interest in the recent literature (Daw, Verdery, and Margolis 2016; Verdery 2015). As for the type of kinship ties that are of interest for this study, at the population level three key demographic forces shape the demography of grandparenthood: mortality, fertility quantum, and timing. Increased life expectancy implies that a higher number of individuals will survive until becoming a grandparent, and it also increases the grandparenthood length of life (Hagestad 2006; Murphy 2011; Post et al. 1997; Watkins, Menken, and Bongaarts 1987). The duration of the grandparent phase of life may be, on the contrary, reduced by fertility postponement, but evidence shows that the effect of mortality reduction is not entirely counterbalanced by increased age at grandparenthood (Leopold and Skopek 2015b; Margolis 2016). On the other hand, lower fertility levels entail a reduction in the average number of grandchildren per grandparent (Bengtson 2001; Murphy 2011; Uhlenberg 2005).
Several studies from the 1980s and 1990s described key demographic characteristics of grandparenthood in the United States (Sprey and Matthews 1982; Szinovacz 1998; Uhlenberg 1996). Other studies used simulation methods to examine the prevalence of kin availability. Among these studies, Murphy (2011) estimated that in Britain the average number of living grandchildren varied considerably over the cohorts born during the period 1850–1950 as a consequence of the fertility dynamics of the two involved generations.
Leopold and Skopek (2015a) used survival methods to estimate the median age at becoming a grandparent, the length of grandparent phase of life, and its overlap with other important roles in 24 European countries. Leopold and Skopek (2015b) investigated similar questions comparing different cohorts in East and West Germany. Both studies highlighted that grandparenthood overlaps rarely with active parenting but frequently with worker and filial roles.
Margolis and Wright (2017a) estimate the length of healthy grandparenthood in the United States and Canada and how this has changed over time. They found that the period of healthy grandparenthood is becoming longer because of improvements in health and mortality, which more than offset delays in grandparenthood due to fertility postponement. They also examined how healthy grandparenthood varies within the United States by education and race/ethnicity.
Finally, Skopek and Leopold (2017) examined educational differences in the probability and timing of grandparenthood among Germans born between 1933 and 1938. The likelihood of becoming a grandmother was much lower among (West) German women with higher levels of education as compared to their counterparts with lower education. No educational differences were found in the chance of becoming a grandfather and in the occurrence and timing of higher-parity transitions.
2.3 Mechanisms influencing the demography of grandparenthood
Demographers studying fertility have often distinguished between its proximate and background (or distal) determinants. “The proximate determinants of fertility are the biological and behavioral factors through which the background determinants (social, economic, and environmental variables) affect fertility. The distinguishing feature of a proximate determinant is its direct connection to fertility” (Bongaarts 2015: 536). The proximate determinants of fertility are the strongest predictors of fertility, and hypothetically if accurately measured and modeled they could perfectly explain fertility outcomes.
grandparents. Also, those who have more children are more likely to have a higher number of grandchildren, everything else being equal. This is also because of intergenerational continuities in fertility (Murphy 2013; Kolk 2015; Kolk and Hällsten 2017). Hence, fertility quantum and timing can be considered as the most proximate determinants of the demography of grandparenthood, and they are among the main determinants on which we focus in this paper.
Partnership status may also influence grandparenthood in several ways. First, partnership status is a proximate determinant of fertility, and so it indirectly influences the demography of grandparenthood. Second, and more interestingly, partnership histories may also influence more directly the demography of grandparenthood. A person can become a (step-)grandparent by entering in a partnership with someone who has grandchildren from a previous relationship (Yahirun, Park, and Seltzer 2018). Similarly, someone who had children and grandchildren from a previous relationship may divorce and enter in a new relationship with another grandparent, so increasing the total number of grandchildren.
Given the complexity and multidimensionality of fertility and partnership histories, in this paper we take a holistic approach and use sequence and cluster analysis to summarize this complexity and obtain a limited number of meaningful typologies of family histories to be analyzed as determinants of the demography of grandparenthood.
The age at which individuals are observed is obviously another key factor that determines their probability of having grandchildren and their number. Even conditional on the same exact family history, the probability to be a grandparent, for example, is higher for older people because their (biological or step-) children will be, everything else being equal, more likely to have their own children. For this reason, we will analyze how the relationship between clusters of family histories is associated with demographic outcomes of grandparenthood by narrow age groups to provide a detailed description of the demography of grandparenthood.
Apart from the abovementioned proximate determinants of grandparenthood, we will account for some important background determinants. Individuals’ socioeconomic status is one of the most important background determinants of fertility and as such can be considered as a distal determinant also for the demography of grandparenthood. In a recent study, Arpino, Gumà, and Julià (2018) found that early-life (e.g., parental socioeconomic background) and childhood conditions (e.g., health) influence fertility and partnership histories through their influence on educational attainment. Therefore, early-life conditions and education may be thought as distal determinants of grandparenthood outcomes because of their indirect effect operating through their influence on family histories.
and partnership formation (Bellani et al. 2017). Therefore, contextual factors can also be listed among the background determinants of the demography of grandparenthood because they may have influenced individuals’ family histories in the past and they can also influence their children’s fertility.
2.4 Research goals
Our contribution to the literature on the demography of grandparenthood is twofold. First, we consider three key demographic aspects of grandparenthood: being a grandparent, number of grandchildren, and having at least one young grandchild (age 10 or younger), and how these characteristics vary at different ages of the older generation. Second, with the exception of Margolis and Wright (2017a) and Skopek and Leopold (2017), the abovementioned recent studies did not consider differences in the demography of grandparenthood across groups of individuals. As noticed by Szinovacz (1998) mean demographic characteristics of grandparenthood may mask huge heterogeneity in the population.
We examine the heterogeneity in three demographic measures of grandparenthood with respect to family histories and more specifically fertility and partnership histories. As discussed in the previous section, family histories are among the most important proximate determinants of the demography of grandparenthood. It is reasonable to assume that they have a strong impact on the demography of grandparenthood, but the goal of this paper is to quantify the degree of variation in the demography of grandparenthood for individuals who experience different fertility and partnership trajectories.
3. Data and methods
3.1 Data and variables
Our analyses are based on data from the Survey of Health, Ageing and Retirement in Europe (SHARE). SHARE is a panel survey representative of the non-institutionalized population aged 50 and over from different European countries (Börsch-Supan et al. 2008). The first wave was carried out in 2004/05, and every second year since then it has attempted to re-interview all individuals. Wave 3 (2008/09), called SHARELIFE, differently from the other waves, collected detailed retrospective information on different life dimensions.
We use SHARELIFE to construct fertility and partnership histories between age 15 and 49 (both included), which gives 35 time points on a yearly time scale. Notice that among all SHARELIFE respondents, only about 1% of men and 0.04% of women had children (biological or adopted) after age 49. SHARELIFE also provided information on most control variables we use. Outcome variables (grandparent measures) are only available in regular SHARE waves. Therefore, we measured the outcome variables using the closest wave to SHARELIFE, that is, wave 2 (2006/07) or, in case of missing data, from the first wave (2004/05). Information on additional control variables was also obtained from the second (or first) wave of SHARE. We restrict our sample to women and men aged 50 years and over at the time we measure the outcomes. Additionally, in order to consider only people at risk of being a grandparent, we restrict our analyses to those who had at least one child (22,796 cases, 87.2% of the original SHARELIFE sample). After discarding respondents with incomplete information on family histories or other variables (1,734 cases; 7.6%), our working sample consists of 21,062 individuals (56.6% women and 43.4% men) from 13 countries (Austria, Belgium, Czech Republic, Denmark, France, Germany, Greece, Italy, Netherlands, Poland, Spain, Sweden, and Switzerland).
The SHARE questionnaire asked each respondent to indicate the total number of grandchildren (including biological, adopted, and step-grandchildren) and the year of birth of the youngest offspring of each of their children. With this information we constructed our three outcome variables: being or not a grandparent, number of grandchildren, and having at least one grandchild aged 10 or younger.
Our explanatory variables are the clusters of family trajectories, obtained as we describe in the next section, and age at the time we measure the outcomes. Age is categorized in five-year intervals starting with ages 50–54 (reference category) and ending with 75 and older.
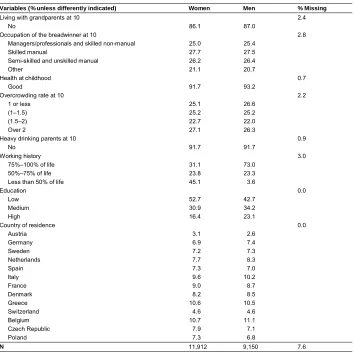
respondents’ situation at age 10: coresidence with biological parents (with both, with only one, with none); coresidence with at least one grandparent (yes orno); household’s overcrowding rate (number of people living in the household divided by the number of rooms); whether at least one of the parents was a heavy drinker (yes or no). We also control for the main parental breadwinner’s occupation when the respondent was 10 by grouping the occupations in four categories following Fritze, Doblhammer, and van den Berg (2014): 1)managers and professionals (legislators, senior officials and managers, professionals, technicians, and associate professionals)and skilled non-manual workers (clerks, service workers, shop workers, and market sales workers); 2) skilled manual workers (skilled agricultural or fishery workers); 3) semi-skilled and unskilled manual (craft or related trade workers, plant/machine operators and assemblers, and elementary occupations); 4) other (other or no occupation). In addition, from SHARELIFE we obtained data on self-reported health during childhood (up to age 15; good vs. fair, poor, or variable) and the percentage of years the respondent has been employed from age 15 to 49.
These control variables are introduced to reduce the risk of capturing effects due to family background and work histories and not to respondents’ family historiesper se. For example, respondents from poorer socioeconomic origin may be more likely to display nonstandard family histories (Oppenheimer, Kalmijn, and Lim 1997).
We further control for country of residence (12 dummies; reference = Austria) and
educational attainment (low – lower secondary or lower = ISCED 0–2–; medium –
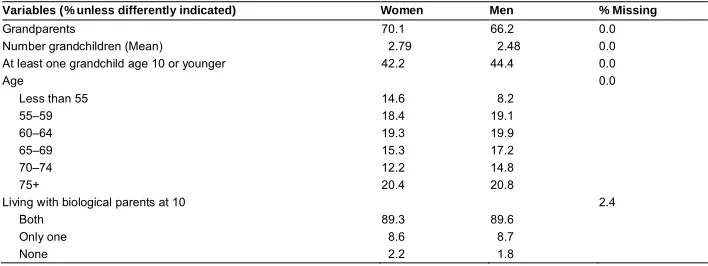
upper secondary = ISCED 3–4–; high – tertiary = ISCED 5–6–). Summary statistics on all variables are reported in Table 1 by gender (with the exception of clusters of family histories that are described in Table 2).
Table 1: Summary statistics on the outcomes and independent variables, by gender
Variables (% unless differently indicated) Women Men % Missing
Grandparents 70.1 66.2 0.0 Number grandchildren (Mean) 2.79 2.48 0.0 At least one grandchild age 10 or younger 42.2 44.4 0.0
Age 0.0
Less than 55 14.6 8.2
55–59 18.4 19.1
60–64 19.3 19.9
65–69 15.3 17.2
70–74 12.2 14.8
75+ 20.4 20.8
Living with biological parents at 10 2.4
Both 89.3 89.6
Only one 8.6 8.7
Table 1: (Continued)
Variables (% unless differently indicated) Women Men % Missing
Living with grandparents at 10 2.4
No 86.1 87.0
Occupation of the breadwinner at 10 2.8 Managers/professionals and skilled non-manual 25.0 25.4
Skilled manual 27.7 27.5 Semi-skilled and unskilled manual 26.2 26.4
Other 21.1 20.7
Health at childhood 0.7
Good 91.7 93.2
Overcrowding rate at 10 2.2 1 or less 25.1 26.6
(1–1.5) 25.2 25.2 (1.5–2) 22.7 22.0 Over 2 27.1 26.3
Heavy drinking parents at 10 0.9
No 91.7 91.7
Working history 3.0
75%–100% of life 31.1 73.0 50%–75% of life 23.8 23.3 Less than 50% of life 45.1 3.6
Education 0.0
Low 52.7 42.7
Medium 30.9 34.2
High 16.4 23.1
Country of residence 0.0
Austria 3.1 2.6
Germany 6.9 7.4
Sweden 7.2 7.3
Netherlands 7.7 8.3
Spain 7.3 7.0
Italy 9.6 10.2
France 9.0 8.7
Denmark 8.2 8.5
Greece 10.6 10.5 Switzerland 4.6 4.6 Belgium 10.7 11.1 Czech Republic 7.9 7.1
Poland 7.3 6.8
N 11,912 9,150 7.6
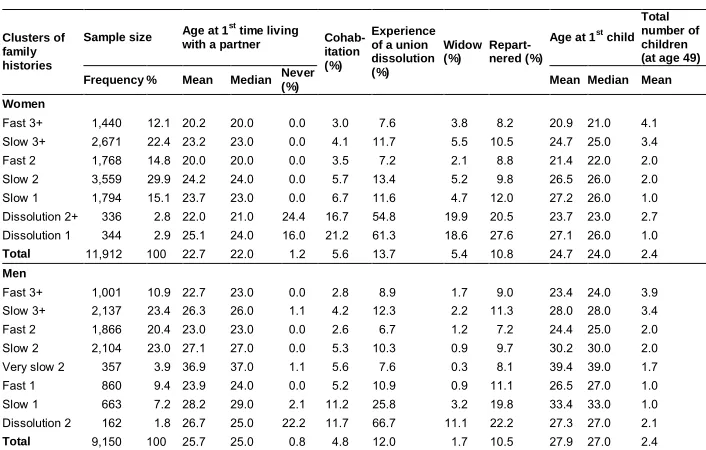
Table 2: Descriptive statistics on the main characteristics of the clusters of family histories, by gender
Clusters of family histories
Sample size Age at 1
st
time living
with a partner Cohab-itation (%)
Experience of a union dissolution (%) Widow (%) Repart-nered (%)
Age at 1st child Total number of children (at age 49)
Frequency % Mean Median Never
(%) Mean Median Mean
Women
Fast 3+ 1,440 12.1 20.2 20.0 0.0 3.0 7.6 3.8 8.2 20.9 21.0 4.1 Slow 3+ 2,671 22.4 23.2 23.0 0.0 4.1 11.7 5.5 10.5 24.7 25.0 3.4 Fast 2 1,768 14.8 20.0 20.0 0.0 3.5 7.2 2.1 8.8 21.4 22.0 2.0 Slow 2 3,559 29.9 24.2 24.0 0.0 5.7 13.4 5.2 9.8 26.5 26.0 2.0 Slow 1 1,794 15.1 23.7 23.0 0.0 6.7 11.6 4.7 12.0 27.2 26.0 1.0 Dissolution 2+ 336 2.8 22.0 21.0 24.4 16.7 54.8 19.9 20.5 23.7 23.0 2.7 Dissolution 1 344 2.9 25.1 24.0 16.0 21.2 61.3 18.6 27.6 27.1 26.0 1.0
Total 11,912 100 22.7 22.0 1.2 5.6 13.7 5.4 10.8 24.7 24.0 2.4
Men
Fast 3+ 1,001 10.9 22.7 23.0 0.0 2.8 8.9 1.7 9.0 23.4 24.0 3.9 Slow 3+ 2,137 23.4 26.3 26.0 1.1 4.2 12.3 2.2 11.3 28.0 28.0 3.4 Fast 2 1,866 20.4 23.0 23.0 0.0 2.6 6.7 1.2 7.2 24.4 25.0 2.0 Slow 2 2,104 23.0 27.1 27.0 0.0 5.3 10.3 0.9 9.7 30.2 30.0 2.0 Very slow 2 357 3.9 36.9 37.0 1.1 5.6 7.6 0.3 8.1 39.4 39.0 1.7 Fast 1 860 9.4 23.9 24.0 0.0 5.2 10.9 0.9 11.1 26.5 27.0 1.0 Slow 1 663 7.2 28.2 29.0 2.1 11.2 25.8 3.2 19.8 33.4 33.0 1.0 Dissolution 2 162 1.8 26.7 25.0 22.2 11.7 66.7 11.1 22.2 27.3 27.0 2.1
Total 9,150 100 25.7 25.0 0.8 4.8 12.0 1.7 10.5 27.9 27.0 2.4
3.2 Analytic strategy
Our empirical approach consists of two steps. First, by applying sequence and cluster analyses, we obtain clusters of similar family histories separately by gender. Second, we analyze the association between these clusters and grandparenthood-related outcomes.
3.2.1 Sequence and cluster analysis of fertility and partnership trajectories
with low number of cases, we group parities higher than the second obtaining four categories: 0 children (0C), 1 child (1C), 2 children (2C), and 3 or more children (3+C). All data on partnership and fertility histories were obtained by the retrospective information provided by respondents. We do not distinguish cohabitation from marriage because the percentage of individuals in our sample that experienced cohabitation at some time was not very large (5.6% for men and 4.8% for women; Table 2). We also did not expect a relevant role of the type of relationship per se.
Combining partnership and fertility variables gives eight possible states (0U0C; 0U1C; 0U2C; 0U3+C; 1U0C; 1U1C; 1U2C; 1U3+C) that we measure at each age from 15 to 49, resulting in a trajectory (sequence) of 35 states for each individual. Note that partnership is not an ‘absorbing’ state; that is, if a partnership is broken and the person passes from living with a partner to not living with a partner, for example as a consequence of a separation, its state is changed back from 1U to 0U.
Once all individual sequences are defined, we calculate (dis)similarities among them using a dynamic algorithm known as optimal matching (OM; Abbott and Forrest 1986; Billari 2001; Sankoff and Kruskal 1983). The similarity between two sequences is systematically determined by calculating the total ‘costs’ of turning one sequence into another. OM calculates similarity between sequences based on three arithmetic operations: insertion, deletion, and substitution. Following previous studies (Aassve, Billari, and Piccarreta 2007), insertion and deletion costs are set to one, and substitution costs are empirically defined as the inverse of the transition rates so that the more common the transition between two states observed in the data, the lower the substitution cost.
OM has been found to be a quite robust method with respect to both the setting of costs and the metric used to calculate distances (see Robette and Bry 2012 and references therein).
Alternative analytical approaches can be employed in order to group similar family trajectories. The approach we used has been validated also in comparison to alternative cluster analysis approaches, such as latent class analysis (LCA; Barban and Billari 2012; Han, Liefbroer, and Elzinga, 2017). One advantage of SA over LCA is that SA is fully non-parametric and it takes into account the order of events, while LCA does not. Latent Class Growth Models (LCGM) seem to be more comparable to SA because they do account for the order of events in the life course. In a recent study, Mikolai and Lyons-Amos (2017) compared LCGM and SA and found similar results.
We implemented SA, OM, and CA using the R package TraMineR (Gabadinho et al. 2011).
3.2.2 Regression analyses
The second stage of our empirical analyses consists of investigating the association between clusters of family trajectories and three outcomes related to demographic aspects of grandparenthood: 1) being a grandparent (i.e., having at least one grandchild or not); 2) number of grandchildren; 3) having at least one young grandchild (i.e., aged 10 or younger). Given the binary nature of the first and third outcomes we use logistic regression models for these two outcomes. The second dependent variable (number of grandchildren) is instead a count variable. Therefore, in this case we employ Poisson’s regressions that allow modeling a count as a function of a set of independent variables (Dobson and Barnett 2008). In each model we interact family histories clusters with age categories. All regression models are estimated separately by gender.
4. Results
4.1 Sequence and cluster analysis
We start by describing the clusters of family histories obtained from cluster analysis applied to the distance matrices generated by the optimal matching procedure. An important step in cluster analysis is to determine the number of clusters. A completely satisfactory and universally accepted solution to determine the number of clusters is not available (Yan 2005). Several goodness of fit statistics are available, and they may give rise to different cluster solutions.
Following common practice in cluster analysis, we combine insights from statistical fit measures and from the visual inspection of the dendrogram (a graphical representation of the arrangement of the clusters in a tree diagram), with the need to obtain a substantively interpretable solution (Everitt et al. 2011). To ease the substantive interpretation of the different cluster solutions, we have considered the medoid sequence, that is, the individual sequence that displays the minimum average distance to all the other sequences within a cluster (Kaufman and Rousseeuw 2005). In other words, the medoid sequence is a real sequence of an individual within a cluster that can be used as the most representative of that cluster (Aassve, Billari, and Piccarreta 2007). To interpret the clusters we also produced descriptive statistics on several aspects of fertility and partnership histories that we present in Table 2 for the final cluster solution.
As a statistical fit measure we considered the average silhouette width (ASW; Kaufman and Rousseeuw 2005), a measure of the coherence of a clustering solution: high value means that the clusters are homogeneous and well separated. Initially, we compared different cluster solutions based on the ASW. From a statistical point of view the solution with highest ASW should be preferred. However, we have noticed that a solution with a slightly lower ASW was better from a substantive point of view because it allowed differentiating some patterns of substantive importance. Thus, we opted for a seven-cluster solution for women and an eight-cluster solution for men that appeared to be the most interpretable solutions from a substantive point of view.
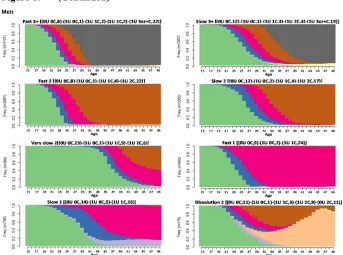
Figure 1: State distribution plots by the clusters of family histories and gender
Figure 1: (Continued)
Men
Notes: 0U / 1U = living without / with a partner; 0C / 1C / 2C / 3or+C = 0 / 1 / 2 / 3 or more children. The medoid sequence is reported on the top of each cluster’s plot.
Among women, the clusterFast 3+is characterized by a relatively ‘fast’ entry into first partnership (mean age = 20.2), early first birth (mean age = 20.9), and by an average number of children higher than 3 (4.1). The medoid sequence for this cluster is (0U0C,5) – (1U0C,1) – (1U1C,2) – (1U2C,3) – (1U3or+C,24). This corresponds to a woman who lived without a partner and childless for five years from age 15 to 19, at the age of 20 started to live with a partner, the next year had a child, at age 23 had her second child, and three years later the third one. She remained in this state of living with a partner and having three or more children until the end of the observation period (age 49).Fast 3+ is the cluster of women who started a union the earliest and ended up having the highest average number of children.
The clusterSlow 3+differs fromFast 3+essentially with respect to the timing of first partnership formation (mean age = 23.2) and first birth (mean age = 24.7), both
happening later. However, women in Slow 3+also have a relatively high number of
However, women in both clusters report lower fertility levels (mean number of children is 2 for both clusters).
Women inSlow 1 are similar to those inSlow 2as far as the timing of partnership and fertility is concerned (mean age at first birth is slightly higher: 27.2vs 26.5) but differ in terms of fertility (mean number of children is 1 instead of 2). The last two clusters,Dissolution 2+and Dissolution 1, are much smaller than the others (Table 2) and differ because of the considerably higher percentage of women who experienced union dissolution (53.2% and 58.1%, respectively). Correspondingly, the percentage of women who experienced more than one partnership is substantively above the average level. On the other hand, these clusters also include women who never lived with a
partner. The two clusters Dissolution 2+ and Dissolution 1 differ among them with
respect to the timing of first union and first birth, which happened around three years earlier forDissolution 2+, with respect to the average number of children (2.7 and 1.0, respectively).
Men, as expected, experience partnership formation and fertility events later than women (three years later, on average; Table 2). However, most clusters of family histories for men are similar in terms of structure to those found for women. For example, for men the cluster Fast 3+ is characterized by a relatively early first union formation and first birth and by the highest average total number of children. The cluster solution for men is characterized by two clusters that we did not find for women: Very slow 2andFast 1.In the clusterVery slow 2, first child and union formation occur much later than in the other clusters (e.g., average age at first child is 39.4), whereas in the clusterFast 1 the average age for both events is below the total average among men. However, fertility for men in clusterVery slow 2is higher (1.7) than for men in cluster Fast 1 (1.0).
16% to 24.4%). In section 4.5 we shall describe a robustness check to deal with the heterogeneity characterizing the ‘dissolution’ clusters.
4.2 Family histories and the probability to be a grandparent
In the second step of our analyses we examine how grandparenthood-related outcomes vary across the clusters of family histories previously identified at different ages and by gender. We start considering the probability to be a grandparent. Figure 2 displays predicted probabilities of being a grandparent with 95% confidence intervals from logistic models that included all control variables and were estimated separately by gender (complete estimates of all models are reported in Tables 3 and 4). Predictions are obtained for each cluster of family histories and age category. Although models included all clusters simultaneously, these are displayed in two separate panels for graphical convenience.
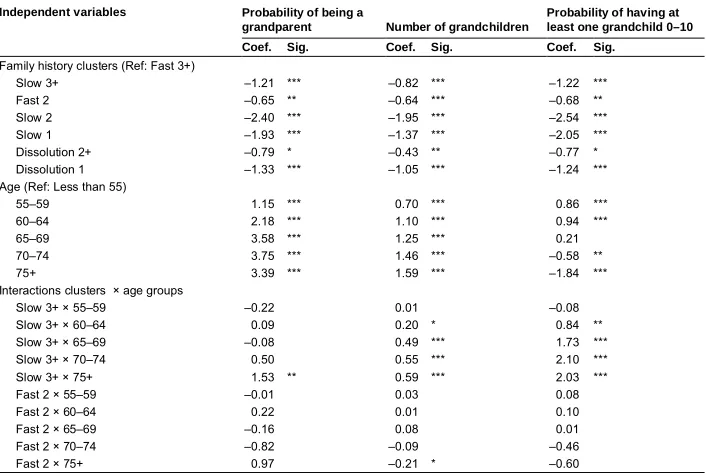
Table 3: Complete estimates of regression models: Women
Independent variables Probability of being a
grandparent Number of grandchildren
Probability of having at least one grandchild 0–10
Coef. Sig. Coef. Sig. Coef. Sig.
Family history clusters (Ref: Fast 3+)
Slow 3+ –1.21 *** –0.82 *** –1.22 *** Fast 2 –0.65 ** –0.64 *** –0.68 ** Slow 2 –2.40 *** –1.95 *** –2.54 *** Slow 1 –1.93 *** –1.37 *** –2.05 *** Dissolution 2+ –0.79 * –0.43 ** –0.77 * Dissolution 1 –1.33 *** –1.05 *** –1.24 *** Age (Ref: Less than 55)
55–59 1.15 *** 0.70 *** 0.86 *** 60–64 2.18 *** 1.10 *** 0.94 *** 65–69 3.58 *** 1.25 *** 0.21 70–74 3.75 *** 1.46 *** –0.58 ** 75+ 3.39 *** 1.59 *** –1.84 *** Interactions clusters × age groups
Table 3: (Continued)
Independent variables
Probability of being a
grandparent Number of grandchildren
Probability of having at least one grandchild 0–10
Coef. Sig. Coef. Sig. Coef. Sig.
Interactions clusters × age groups
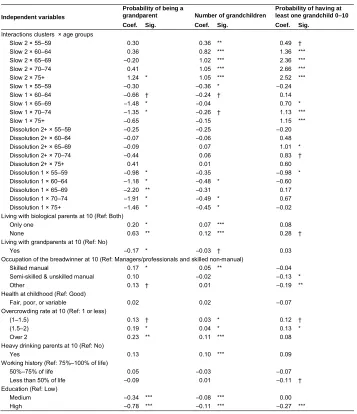
Slow 2 × 55–59 0.30 0.36 ** 0.49 † Slow 2 × 60–64 0.36 0.82 *** 1.36 *** Slow 2 × 65–69 –0.20 1.02 *** 2.36 *** Slow 2 × 70–74 0.41 1.05 *** 2.66 *** Slow 2 × 75+ 1.24 * 1.05 *** 2.52 *** Slow 1 × 55–59 –0.30 –0.36 * –0.24 Slow 1 × 60–64 –0.66 † –0.24 † 0.14 Slow 1 × 65–69 –1.48 * –0.04 0.70 * Slow 1 × 70–74 –1.35 * –0.26 † 1.13 *** Slow 1 × 75+ –0.65 –0.15 1.15 *** Dissolution 2+ × 55–59 –0.25 –0.25 –0.20 Dissolution 2+ × 60–64 –0.07 –0.06 0.48 Dissolution 2+ × 65–69 –0.09 0.07 1.01 * Dissolution 2+ × 70–74 –0.44 0.06 0.83 † Dissolution 2+ × 75+ 0.41 0.01 0.60 Dissolution 1 × 55–59 –0.98 * –0.35 –0.98 * Dissolution 1 × 60–64 –1.18 * –0.48 * –0.60 Dissolution 1 × 65–69 –2.20 ** –0.31 0.17 Dissolution 1 × 70–74 –1.91 * –0.49 * 0.67 Dissolution 1 × 75+ –1.46 * –0.45 * –0.02 Living with biological parents at 10 (Ref: Both)
Only one 0.20 * 0.07 *** 0.08 None 0.63 ** 0.12 *** 0.28 † Living with grandparents at 10 (Ref: No)
Yes –0.17 * –0.03 † 0.03 Occupation of the breadwinner at 10 (Ref: Managers/professionals and skilled non-manual)
Skilled manual 0.17 * 0.05 ** –0.04 Semi-skilled & unskilled manual 0.10 –0.02 –0.13 * Other 0.13 † 0.01 –0.19 ** Health at childhood (Ref: Good)
Fair, poor, or variable 0.02 0.02 –0.07 Overcrowding rate at 10 (Ref: 1 or less)
(1–1.5) 0.13 † 0.03 * 0.12 † (1.5–2) 0.19 * 0.04 * 0.13 * Over 2 0.23 ** 0.11 *** 0.08 Heavy drinking parents at 10 (Ref: No)
Yes 0.13 0.10 *** 0.09 Working history (Ref: 75%–100% of life)
50%–75% of life 0.05 –0.03 –0.07 Less than 50% of life –0.09 0.01 –0.11 † Education (Ref: Low)
Table 3: (Continued)
Independent variables
Probability of being a
grandparent Number of grandchildren
Probability of having at least one grandchild 0–10
Coef. Sig. Coef. Sig. Coef. Sig.
Country of residence (Ref: Austria)
Germany –0.13 –0.06 0.17 Sweden 0.17 0.20 *** 0.45 ** Netherlands –0.29 † 0.07 † 0.48 ** Spain –0.74 *** –0.14 *** 0.39 ** Italy –0.74 *** –0.21 *** 0.32 * France –0.12 0.10 ** 0.41 ** Denmark 0.61 ** 0.23 *** 0.84 *** Greece –0.99 *** –0.22 *** –0.44 ** Switzerland –0.66 *** –0.11 ** 0.02 Belgium 0.22 0.16 *** 0.57 *** Czech Republic 0.47 ** 0.17 *** –0.01 Poland 1.04 *** 0.24 *** 0.66 *** Constant 0.58 * 0.44 *** 0.16
PseudoR2 0.34 0.31 0.16
N 11,912 11,912 11,653
Notes: † p < 0.10; * p < 0.05; ** p < 0.01; *** p < 0.001. The first and third models are logistic regressions; the second model is a Poisson regression. The small reduction of the sample size for the third model is due to a small additional amount of missing cases on the age of the youngest grandchild.
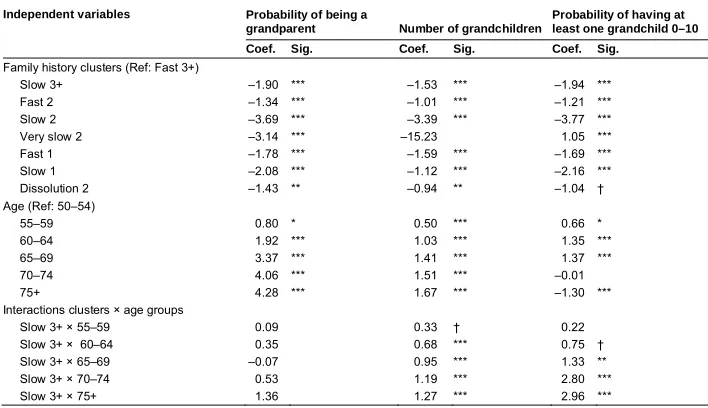
Table 4: Complete estimates of regression models: Men
Independent variables Probability of being a
grandparent Number of grandchildren
Probability of having at least one grandchild 0–10
Coef. Sig. Coef. Sig. Coef. Sig.
Family history clusters (Ref: Fast 3+)
Slow 3+ –1.90 *** –1.53 *** –1.94 *** Fast 2 –1.34 *** –1.01 *** –1.21 *** Slow 2 –3.69 *** –3.39 *** –3.77 *** Very slow 2 –3.14 *** –15.23 1.05 *** Fast 1 –1.78 *** –1.59 *** –1.69 *** Slow 1 –2.08 *** –1.12 *** –2.16 *** Dissolution 2 –1.43 ** –0.94 ** –1.04 † Age (Ref: 50–54)
55–59 0.80 * 0.50 *** 0.66 * 60–64 1.92 *** 1.03 *** 1.35 *** 65–69 3.37 *** 1.41 *** 1.37 *** 70–74 4.06 *** 1.51 *** –0.01 75+ 4.28 *** 1.67 *** –1.30 *** Interactions clusters × age groups
Table 4: (Continued)
Independent variables
Probability of being a
grandparent Number of grandchildren
Probability of having at least one grandchild 0–10
Coef. Sig. Coef. Sig. Coef. Sig.
Interactions clusters × age groups
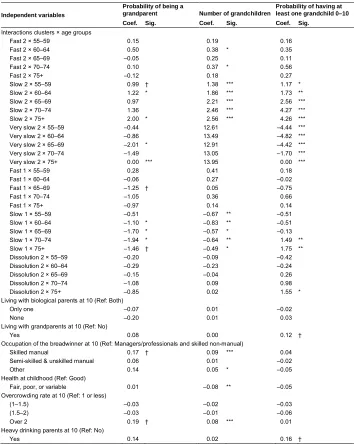
Fast 2 × 55–59 0.15 0.19 0.16 Fast 2 × 60–64 0.50 0.38 * 0.35 Fast 2 × 65–69 –0.05 0.25 0.11 Fast 2 × 70–74 0.10 0.37 * 0.56 Fast 2 × 75+ –0.12 0.18 0.27 Slow 2 × 55–59 0.99 † 1.38 *** 1.17 * Slow 2 × 60–64 1.22 * 1.86 *** 1.73 ** Slow 2 × 65–69 0.97 2.21 *** 2.56 *** Slow 2 × 70–74 1.36 2.46 *** 4.27 *** Slow 2 × 75+ 2.00 * 2.56 *** 4.26 *** Very slow 2 × 55–59 –0.44 12.61 –4.44 *** Very slow 2 × 60–64 –0.86 13.49 –4.82 *** Very slow 2 × 65–69 –2.01 * 12.91 –4.42 *** Very slow 2 × 70–74 –1.49 13.05 –1.70 *** Very slow 2 × 75+ 0.00 *** 13.95 0.00 *** Fast 1 × 55–59 0.28 0.41 0.18 Fast 1 × 60–64 –0.06 0.27 –0.02 Fast 1 × 65–69 –1.25 † 0.05 –0.75 Fast 1 × 70–74 –1.05 0.36 0.66 Fast 1 × 75+ –0.97 0.14 0.14 Slow 1 × 55–59 –0.51 –0.67 ** –0.51 Slow 1 × 60–64 –1.10 * –0.83 ** –0.51 Slow 1 × 65–69 –1.70 * –0.57 * –0.13 Slow 1 × 70–74 –1.94 * –0.64 ** 1.49 ** Slow 1 × 75+ –1.46 † –0.49 * 1.75 ** Dissolution 2 × 55–59 –0.20 –0.09 –0.42 Dissolution 2 × 60–64 –0.29 –0.23 –0.24 Dissolution 2 × 65–69 –0.15 –0.04 0.26 Dissolution 2 × 70–74 –1.08 0.09 0.98 Dissolution 2 × 75+ –0.85 0.02 1.55 * Living with biological parents at 10 (Ref: Both)
Only one –0.07 0.01 –0.02 None –0.20 0.01 0.03 Living with grandparents at 10 (Ref: No)
Yes 0.08 0.00 0.12 † Occupation of the breadwinner at 10 (Ref: Managers/professionals and skilled non-manual)
Skilled manual 0.17 † 0.09 *** 0.04 Semi-skilled & unskilled manual 0.06 0.01 –0.02 Other 0.14 0.05 * –0.05 Health at childhood (Ref: Good)
Fair, poor, or variable 0.01 –0.08 ** –0.05 Overcrowding rate at 10 (Ref: 1 or less)
(1–1.5) –0.03 –0.02 –0.03 (1.5–2) –0.03 –0.01 –0.06 Over 2 0.19 † 0.08 *** 0.01 Heavy drinking parents at 10 (Ref: No)
Table 4: (Continued)
Independent variables
Probability of being a
grandparent Number of grandchildren
Probability of having at least one grandchild 0–10
Coef. Sig. Coef. Sig. Coef. Sig.
Working history (Ref: 75%–100% of life)
50%–75% of life –0.12 † –0.01 –0.16 ** Less than 50% of life 0.13 0.08 * 0.05 Education (Ref: Low)
Medium –0.31 *** –0.09 *** 0.05 High –0.68 *** –0.13 *** –0.14 * Country of residence (Ref: Austria)
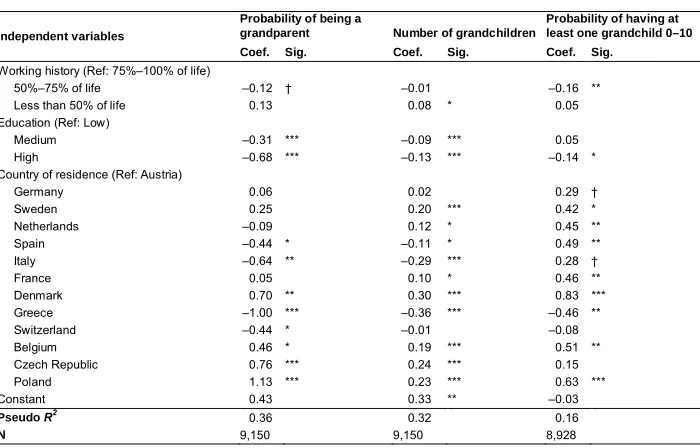
Germany 0.06 0.02 0.29 † Sweden 0.25 0.20 *** 0.42 * Netherlands –0.09 0.12 * 0.45 ** Spain –0.44 * –0.11 * 0.49 ** Italy –0.64 ** –0.29 *** 0.28 † France 0.05 0.10 * 0.46 ** Denmark 0.70 ** 0.30 *** 0.83 *** Greece –1.00 *** –0.36 *** –0.46 ** Switzerland –0.44 * –0.01 –0.08 Belgium 0.46 * 0.19 *** 0.51 ** Czech Republic 0.76 *** 0.24 *** 0.15 Poland 1.13 *** 0.23 *** 0.63 *** Constant 0.43 0.33 ** –0.03
PseudoR2 0.36 0.32 0.16
N 9,150 9,150 8,928
Notes: † p < 0.10; * p < 0.05; ** p < 0.01; *** p < 0.001. The first and third models are logistic regressions; the second model is a Poisson regression. The small reduction of the sample size for the third model is due to a small additional amount of missing cases on the age of the youngest grandchild.
Clusters of women and men in the left hand side of Figure 1, all characterized by average total fertility of 2 or more, differ with respect to the timing of grandparenthood. At the youngest ages there is a considerable heterogeneity across clusters in the probability of being a grandparent, both for women and men. Within the youngest age group (50–54), for both genders the highest probability to have at least one grandchild is found for theFast 3+cluster, characterized, as demonstrated in the previous section, by a relatively early entry into union and first birth and high average total number of children. Within this cluster, the prevalence of grandparenthood at ages 50–54 is around
60% for both women and men (61% and 58%, respectively). The Slow 3+ cluster,
characterized by a slower transition to partnership formation and parenthood, reports much lower percentages (32% for women and 17% for men). Prevalence of
grandparenthood at ages 50–54 is extremely low within theSlow 2 cluster (13% for
Figure 2: Predicted probability of being a grandparent with 95% confidence intervals by age and clusters of family histories; women and men separately
Figure 2: (Continued)
Prevalence of grandparenthood increases for all clusters with age, and by age 75 in most clusters virtually all individuals are grandparents. Exceptions are represented by most clusters in the right side panels of Figure 2. Among women, the probability of
being a grandmother above age 75 remains below 80% for the clusters Slow 1 and
Dissolution 1, meaning that among women who had on average only one child, the risk of remaining grandchildless is much higher than among those who had more children. Similarly, clusters in the right hand side for men (Very Slow 2, Dissolution 2,Fast 1, andSlow 1) at ages 75 and above exhibit a prevalence of grandfatherhood between 74% and 91%. We notice that clusters where the prevalence of union dissolution is high do not display significantly different probabilities of grandparenthood as compared to clusters with similar total number of children (compare, for example, clustersSlow 1 and Dissolution 1for women orVery Slow 2 and Dissolution 2for men). This seems to
indicate that union dissolution per se does not affect the probability of being a
grandparent.
As for the control variables (see Tables 3 and 4), education and country display the clearest associations with the probability of being a grandparent. For both women and men, we find a negative educational gradient: the higher the education, the lower the probability of being a grandparent. Polish older women and men are the most likely to be grandparents, while the Greeks are the least likely to have at least one grandchild. It is also worth noticing that for women we find a positive association between the overcrowding rate at age 10, an indicator of poor parental socioeconomic background, and the probability of being a grandmother.
4.3 Family histories and number of grandchildren
Figure 3: Predicted number of grandchildren with 95% confidence intervals by age and clusters of family histories; women and men separately
Figure 3: (Continued)
Men
which in Figure 2 mostly differed with respect to the timing of becoming a grandparent, show, as expected, substantive differences with respect to the average number of grandchildren. The graphs quantify the expectation that individuals who had more children are also more likely to have more grandchildren. Both grandmothers and
grandfathers in the clusters Fast 3+ display the highest predicted number of
grandchildren at all ages, ranging, on average, from about 1.5 (women = 1.6; men = 1.4) at ages 50–54 to more than 7.5 (women = 8.1; men = 7.6) at ages 75 and older. Their counterparts in the clustersSlow 3+have, on average, less than one grandchild (women = 0.7; men = 0.3) at ages 50–54 and around 6 (women = 6.4; men = 5.9) at ages 75 and older. The gap in the total number of grandchildren between the two types of clusters may be in part due to censoring; that is, some of the respondents’ children in clusterSlow 3+ may have additional children after the end of our observation period.
The average number of grandchildren for both women and men in clustersFast 2
follows a patter similar to those in clustersSlow 3+up to ages 60–64, but then the two patterns become rather different, and the Fast 2 grandparents report 2 grandchildren
less, on average, than the Slow 3+ ones. This indicates that children of Fast 2
respondents also had, on average, about 2 children relatively fast.
Among women, clusters Slow 1 and Dissolution 1 exhibit the lowest average
number of grandchildren at all ages, ranging from about 0.5 at the youngest ages to 1.8 at the oldest ages. For men, all clusters in the right hand side (Very Slow 2,Dissolution 2, Fast 1, andSlow 1) show low average values of the number of grandchildren.
Similarly to what we found for the probability of being a grandparent, among the control variables education and country display the clearest associations with the number of grandchildren (Tables 3 and 4). For both women and men, we find a negative association between educational attainment and number of grandchildren. On average, the lowest number of grandchildren is found in Greece and the highest in Poland for women and in Czech Republic for men. We found a positive association between the overcrowding rate at age 10 and number of grandchildren, especially for women.
4.4 Family histories and the probability of having a grandchild aged 10 or younger
Figure 4: Predicted probability of having a grandchild aged 10 or younger with 95% confidence intervals by age and clusters of family histories; women and men separately
Figure 4: (Continued)
Men
ages, the probability of having a young grandchild tends to coincide, evidently, with that of being a grandparent displayed in Figure 2. Among women, the probability of having a young grandchild is the highest for the clusterFast 3+ at ages 50–54 and 55– 59. From age 65 this probability turns to be the highest for clusterSlow 3+. The curves for these two clusters are rather similar, but that for Slow 3+ is shifted towards the right; that is, they differ mostly for the timing with which a higher or lower prevalence of grandparents with young grandchildren is observed. Similarly, the pair of clusters Fast 2 and Slow 2 also display similar prevalence of having at least one young grandchild with a lag of five years. However, women in these clusters are about 20 percentage points less likely to have a young grandchild at any age compared to their counterparts in the corresponding clusters with higher fertility (Fast 3+and Slow 3+, respectively). Results for men for these four clusters are qualitatively similar. However,
compared to women, men in Fast 3+ exhibit the highest probability to have young
grandchildren at older ages (65–69). For both women and men in the clusterSlow 3+, at ages 75 and older the prevalence of grandparents with young grandchildren is quite high (about 40% and 50%, respectively).
For women, the remaining clusters in the right hand side of Figure 4 (Slow 1, Dissolution 2+, Dissolution 1) show an inverse U-shaped pattern: the probability of having a young grandchild is maximum at central ages (60–64 and 65–69). Whereas at the extreme ages the three clusters exhibit similar probabilities, for central ages there is a substantive gap between women in theDissolution 2+cluster as compared to those in the other two. This gap reaches about 36 percentage points at ages 60–64 when the
prevalence of grandmothers with a young grandchild in the Dissolution 2+ is 73%
(twice the prevalence observed in the other two clusters), which is not statistically different than the prevalence observed at the same ages for the clusters with similar fertility in the left hand side of Figure 4. For men, clusters in the right hand side of Figure 4 display a less systematic pattern. Only theDissolution 2 cluster reaches a high prevalence of grandfathers with a young grandchild at ages 65–69 comparable to that of their female counterparts five years before. The other clusters tend to exhibit lower probabilities and reach the pick at different ages. Interestingly, the clustersVery Slow 2 for men is the only one showing the highest prevalence of grandparents with a young grandchild in the oldest age group: at ages 75 and older, 50% of men that experienced a ‘very slow’ transition to the first and second child have a young grandchild.
4.5 Additional analyses and robustness checks
We have implemented additional analyses and robustness checks (results available upon request) in which we considered: 1) interactions between groups of countries and family histories; 2) excluding education from the control variables; 3) excluding individuals who did not experience dissolution from the ‘dissolutions’ clusters.
Although we controlled for country-level fixed effects, sample sizes were not sufficient to implement country-specific analyses. Descriptive statistics on the prevalence of each cluster of family history by country indicate that some clusters are relatively more frequent in some countries than in others (see Table S-1 in the supplementary materials). For example,Fast 3+ trajectories are especially frequent in
Poland, Slow 3+ in Spain, Slow 2 in Greece, and clusters of family histories
characterized by high proportions of union dissolutions are more frequent in the Netherlands and in Sweden. Although it was not possible to implement country-specific analyses, we tested the interactions between clusters of family trajectories and groups of countries. We found that adding these interactions in our models did not improve the model fit and the interactions were often substantially and statistically insignificant. Additionally, our results of interest (coefficients and statistical significance of family histories clusters and age) were barely affected by the inclusion of the interactions with the groups of countries. This means that, while the likelihood of experiencing different family trajectories varies across different countries, conditional on being in a given cluster of family trajectory the consequences in terms of the demography of grandparenthood are similar across countries.
Education, as discussed in section 2.3, can be thought as a distal determinant of the demography of grandparenthood for its influence on family trajectories. However, education may be endogenous to fertility and partnership behaviours. As a robustness check, we re-run all regression models excluding education from the control variables, and results were very similar to those reported in the paper.
Finally, given the internal heterogeneity characterizing the ‘dissolution’ clusters, we excluded people who did not experience a union dissolution from the ‘dissolution’ clusters and re-run the analyses. Neither point estimates nor the levels of statistical significance were substantially affected.
5. Conclusion and discussion
grandchild aged 10 or younger. We used retrospective data from SHARELIFE (2008/09), the third wave of the Survey of Health, Ageing and Retirement in Europe (SHARE), to reconstruct complete family life courses between ages 15 and 49 and data from the first two waves of SHARE to measure demographic outcomes related to grandparenthood.
Applying sequence and cluster analysis to SHARELIFE we built a typology of family histories, separately by gender. These methods confirmed to be useful tools to summarize efficiently the complexity of family life courses that were found to differ strongly across clusters of individuals with respect to timing and quantum of partnership formation, fertility, and the prevalence of events such as union dissolution. This allowed us to analyze how the demography of grandparenthood varied across a meaningful limited number of groups of individuals characterized by diverse family life courses.
Our research adds to a few recent studies on the demography of grandparenthood (Leolpold and Skopek 2015a, 2015b; Margolis 2016). Differently from these studies we explored the variability of the demography of grandparenthood across groups of individuals. Our findings point to a great heterogeneity in the demography of grandparenthood across different clusters of family histories for both women and men. For the cluster of people who experienced an early entry into partnership, a fast progression to first and higher-order births, and who exhibited a high total fertility (Fast
3+), we found a high prevalence of grandmothers (61%) and grandfathers (58%)
already at ages 50–54. This group was also characterized by the highest average number of grandchildren at all ages (reaching 8.1 grandchildren for women and 7.6 for men at ages 75 and older).
Very different patterns were found for other clusters. Compared to Fast 3+, for example, both women and men in theSlow 2 cluster, characterized by a relatively high age at first union and first birth and by a total fertility of about two children, reported a considerably lower prevalence of grandparenthood at ages 50–54 (13% and 3%, respectively) and a lower average number of grandchildren at ages 75 and older (around four for both women and men).
distal determinants, such as country-level factors or socioeconomic status, similar to the recent study by Skopek and Leopold (2017) focused on education.
Another limitation of our study refers to the use of retrospective data. Although we can expect that fertility histories are correctly reconstructed by the vast majority of respondents, we cannot rule out the possibility of mis- and under-reporting, especially by men.
Our work has several important implications for the development of intergenerational relationships. We highlighted to what extent heterogeneities in family histories translate in different probabilities of having (young) grandchildren. Individuals in the different clusters of family histories have unequal chances to take care of grandchildren and benefit from its possibly positive effects on health and subjective well-being (Arpino, Gumà, and Julià 2018; Arpino and Bordone 2014; Di Gessa, Glaser, and Tinker 2016; Moore and Rosenthal 2015). Clusters also differ regarding the average number of grandchildren, which is also relevant for intergenerational relationships because, for example, the higher the number of grandchildren, the lower the time that can be dedicated to each of them (Oppelaar and Dykstra 2004).
We found that the clusters characterized by a high prevalence of union dissolution did not differ greatly from clusters with very low prevalence of union dissolution but similar fertility, suggesting that union dissolution per se does not substantially impact the demography of grandparenthood. Still, union dissolution may reduce the quality and frequency of grandparent–grandchildren relationships (King 2003).
Importantly, our study also demonstrates a high heterogeneity across clusters of individuals in the timing of grandparenthood or, more precisely, in the probability of having (young) grandchildren and their number at different ages. This has important implications for the development of the grandparent role and its possible interference with other roles (Leolpold and Skopek 2015a, 2015b). The age at which grandparents have (young) grandchildren influences the probability of taking care of them (Hank and Buber 2009). Some studies also showed that age moderates the effect of having grandchildren and grandchild care (Bordone and Arpino 2016).
decisions (Van Bavel and de Winter 2013; Lumsdaine and Vermeer 2015). Women are, in particular, likely to be more affected by overlaps in different roles, as they usually take most of the care responsibility. Although we did not study conflicting roles, our results allow supposing that the likelihood of overlaps between grandparenthood and other roles varies across groups of people who experienced different family life trajectories. An interesting avenue for future research is to forecast future prevalence of overlaps between different roles and study their consequences on grandparents’ well-being, intergenerational relationships, and labor market participation.
References
Aassve, A., Arpino, B., and Goisis, A. (2012). Grandparenting and mothers’ labour force participation: A comparative analysis using the generations and gender
survey.Demographic Research 27(3): 53–84.doi:10.4054/DemRes.2012.27.3.
Aassve, A., Billari, F.C., and Piccarreta, R. (2007). Strings of adulthood: A sequence
analysis of young British women’s work-family trajectories. European Journal
of Population23(3–4): 369–388.doi:10.1007/s10680-007-9134-6.
Aassve, A., Meroni, E., and Pronzato, C. (2012). Grandparenting and childbearing in
the extended family. European Journal of Population 28(4): 499–518.
doi:10.1007/s10680-012-9273-2.
Abbott, A. and Forrest, J. (1986). Optimal matching methods for historical sequences. Journal of Interdisciplinary History 16(3): 471–494.doi:10.2307/204500. Aisenbrey, S. and Fasang, A.E. (2010). New life for old ideas: The ‘second wave’ of
sequence analysis bringing the ‘course’ back into the life course. Sociological Methods and Research 38: 420–462.doi:10.1177/0049124109357532.
Arpino, B. and Bordone, V. (2014). Does grandparenting pay off? The effect of child
care on grandparents’ cognitive functioning. Journal of Marriage and Family
76(2): 337–351.doi:10.1111/jomf.12096.
Arpino, B., Bordone, V., and Balbo, N. (2018). Grandparenting, education and
subjective wellbeing of older Europeans. European Journal of Ageing 15(3):
251–263.doi:10.1007/s10433-018-0467-2.
Arpino, B., Gumà, J., and Julià, A. (2018). Early-life conditions and health at older ages: The mediating role of educational attainment, family and employment trajectories. PloS One 13(4): e0195320.doi:10.1371/journal.pone.0195320. Baizán, P., Arpino, B., and Delclós, C.E. (2016). The effect of gender policies on
fertility: The moderating role of education and normative context. European
Journal of Population 32(1): 1–30.doi:10.1007/s10680-015-9356-y.
Barban, N. and Billari, F.C. (2012). Classifying life course trajectories: a comparison of
latent class and sequence analysis. Journal of the Royal Statistical Society
Bellani, D., Esping-Andersen, G., and Nedoluzhko, L. (2017). Never partnered: A
multilevel analysis of lifelong singlehood. Demographic Research 37(4): 53–
100.doi:10.4054/DemRes.2017.37.4.
Bengtson, V.L. (2001). Beyond the nuclear family: The increasing importance of
multigenerational bonds. Journal of Marriage and Family 63(1): 1–16.
doi:10.1111/j.1741-3737.2001.00001.x.
Billari, F.C. (2001). The analysis of early life courses: Complex descriptions of the
transition to adulthood. Journal of Population Research 18(2): 119–142.
doi:10.1007/BF03031885.
Bongaarts, J. (2015). Modeling the fertility impact of the proximate determinants: Time
for a tune-up. Demographic Research 33(19): 535–560.doi:10.4054/DemRes.
2015.33.19.
Bordone, V., Arpino, B., and Aassve, A. (2017). Patterns of grandparental childcare across Europe: The role of the policy context and working mothers’ need. Ageing and Society 37(4): 845–873.doi:10.1017/S0144686X1600009X.
Bordone, V. and Arpino, B. (2016). Do grandchildren influence how old you feel? Journal of Aging and Health 28(6): 1055–1072. doi:10.1177/08982643 15618920.
Börsch-Supan, A., Brugiavini, A., Jürges, H., Kapteyn, A., Mackenbach, J., Siegrist, J.,
and Weber, G. (2008). First results from the Survey of Health, Ageing and
Retirement in Europe (2004–2007): Starting the longitudinal dimension. Mannheim: MEA.
Daw, J., Verdery, A.M., and Margolis, R. (2016). Kin count(s): Educational and racial
differences in extended kinship in the United States. Population and
Development Review 42(3): 491–517.doi:10.1111/j.1728-4457.2016.00150.x. Di Gessa, G., Glaser, K., and Tinker, A. (2016). The health impact of intensive and
nonintensive grandchild care in Europe: New evidence from SHARE. The
Journals of Gerontology Series B: Psychological Sciences and Social Sciences
71(5): 867–879.doi:10.1093/geronb/gbv055.
Dykstra, P.A. and Komter, A.E. (2006). Structural characteristics of Dutch kin networks. In: Dykstra, P.A., Kalmijn, M., Knijn, G.C.M., Komter, A.E., Liefbroer, A.C., and Mulder, C.H. (eds.). Family solidarity in the Netherlands. Amsterdam: Dutch University Press: 21–42.
Elder, G.H. Jr. (1994). Time, human agency, and social change: Perspectives on the life course.Social Psychology Quarterly 57(1): 4–15.doi:10.2307/2786971.
Elder, G.H. Jr. (1998). The life course and human development. In: Lerner, R.M. (ed.). Handbook of child psychology: Volume 1: Theoretical models of human development. New York: Wiley: 939–991.
Everitt, B., Landau, S., Leese, M., and Stahl, D. (2011).Cluster analysis. Hoboken:
Wiley.doi:10.1002/9780470977811.
Fritze, T., Doblhammer, G., and van den Berg, G.J. (2014). Can individual conditions during childhood mediate or moderate the long-term cognitive effects of poor
economic environments at birth? Social Science and Medicine 119: 240–248.
doi:10.1016/j.socscimed.2014.07.011.
Gabadinho, A., Ritschard, G., Müller, N.S., and Studer, M. (2011). Analyzing and visualizing state sequences in R with TraMineR.Journal of Statistical Software 40(4): 1–37.doi:10.18637/jss.v040.i04.
Glaser, K., Price, D., Di Gessa, G., Ribe, E., Stuchbury, R., and Tinker, A. (2013). Grandparenting in Europe: Family policy and grandparents’ role in providing childcare. London: Grandparent plus.
Grinstead, L.N., Leder, S., Jensen, S., and Bond, L. (2003). Review of research on the health of caregiving grandparents.Journal of Advanced Nursing 44(3): 318–326. doi:10.1046/j.1365-2648.2003.02807.x.
Hagestad, G.O. (2006). Transfers between grandparents and grandchildren: The
importance of taking a three-generation perspective. Zeitschrift für
Familienforschung 18(3): 315–332.
Hagestad, G.O. and Neugarten, B.L. (1985). Age and the life course. In: Shanas, E. and Binstock, R. (eds.).Handbook of aging and the social sciences. New York: Van Nostrand and Reinhold: 35–55.
Han, Y., Liefbroer, A., and Elzinga, C. (2017). Comparing methods of classifying life
courses: Sequence analysis and latent class analysis. Longitudinal and Life
Hank, K. and Buber, I. (2009). Grandparents caring for their grandchildren: Findings
from the 2004 survey of Health, Ageing, and retirement in Europe. Journal of
Family Issues 30(1): 53–73.doi:10.1177/0192513X08322627.
Harper, S. (2005). Grandparenthood. In: Johnson, M.L. (ed.).The Cambridge handbook
of age and ageing. Cambridge: Cambridge University Press: 422–428. doi:10.1017/CBO9780511610714.044.
Helske, S., Steele, F., Kokko, K., Räikkönen, E., and Eerola, M. (2014). Partnership formation and dissolution over the life course: Applying sequence analysis and event history analysis in the study of recurrent events. Longitudinal and Life Course Studies 6(1): 1–25.doi:10.14301/llcs.v6i1.290.
Hughes, M.E., Waite, L.J., LaPierre, T.A., and Luo, Y. (2007). All in the family: The
impact of caring for grandchildren on grandparents’ health. Journals of
Gerontology Series B: Psychological Sciences and Social Sciences 62(2): S108– S119.doi:10.1093/geronb/62.2.S108.
Jendrek, M.P. (1993). Grandparents who parent their grandchildren: Effects on lifestyle. Journal of Marriage and the Family 55(3): 609–621.doi:10.2307/353342.
Kaufman, L. and Rousseeuw, P.J. (2005).Finding groups in data: An introduction to
cluster analysis. Hoboken: Wiley.doi:10.1111/j.1741-3737.2003.00170.x. King, V. (2003). The legacy of a grandparent’s divorce: Consequences for ties between
grandparents and grandchildren. Journal of Marriage and Family 65(1): 170–
183.doi:10.4054/DemRes.2015.32.51.
Kolk, M. (2015). The causal effect of an additional sibling on completed fertility: An estimation of intergenerational fertility correlations by looking at siblings of
twins. Demographic Research 32(51): 1409–1420. doi:10.4054/DemRes.2015.
32.51.
Kolk, M. and Hällsten, M. (2017). Demographic and educational success of lineages in
northern Sweden. Population and Development Review 43(3): 491–512.
doi:10.1111/padr.12091.
Leopold, T. and Skopek, J. (2015a). The demography of grandparenthood: An international profile.Social Forces 94: 801–832.doi:10.1093/sf/sov066.
Leopold, T. and Skopek, J. (2015b). The delay of grandparenthood: A cohort
comparison in East and West Germany.Journal of Marriage and Family 77(2):
Lumsdaine, R.L. and Vermeer, S.J. (2015). Retirement timing of women and the role of
care responsibilities for grandchildren. Demography 52(2): 433–454.
doi:10.1007/s13524-015-0382-5.
Margolis, R. (2016). The changing demography of grandparenthood. Journal of
Marriage and Family 78(3): 610–622.doi:10.1111/jomf.12286.
Margolis, R. and Wright, L. (2017a). Healthy grandparenthood: How long is it, and
how has it changed? Demography 54(6): 2073–2099.
doi:10.1007/s13524-017-0620-0.
Margolis, R. and Wright, L. (2017b). Older adults with three generations of kin:
Prevalence, correlates, and transfers. The Journals of Gerontology Series B:
Psychological Sciences and Social Sciences 72(6): 1067–1072. doi:10.1093/ geronb/gbv158.
Minkler, M., Fuller-Thomson, E., Miller, D., and Driver, D. (1997). Depression in grandparents raising grandchildren.Archives of Family Medicine 6(3): 445–452. doi:10.1001/archfami.6.5.445.
Mikolai, J. and Lyons-Amos, M. (2017). Longitudinal methods for life course research: A comparison of sequence analysis, latent class growth models, and multi-state event history models for studying partnership transitions.Longitudinal and Life Course Studies 8(2): 191–208.doi:10.14301/llcs.v8i2.415.
Moore, S.M. and Rosenthal, D.A. (2015). Personal growth, grandmother engagement
and satisfaction among non-custodial grandmothers. Aging and Mental Health
19(2): 136–143.doi:10.1080/13607863.2014.920302.
Mueller, M.M. and Elder, G.H. (2003). Family contingencies across the generations:
Grandparent-grandchild relationships in holistic perspective. Journal of
Marriage and Family 65(2): 404–417.doi:10.1111/j.1741-3737.2003.00404.x. Murphy, M. (2011). Long-term effects of the demographic transition on family and
kinship networks in Britain. Population and Development Review 37(S1): 55–
80.doi:10.1111/j.1728-4457.2011.00378.x.
Murphy, M. (2013). Cross-national patterns of intergenerational continuities in
childbearing in developed countries. Biodemography and Social Biology 59(2):
101–126.doi:10.1080/19485565.2013.833779.