A Novel Molecular Descriptor Derived from Weighted
Line Graph
CHANDANA ADHIKARI AND BIJAY KUMAR MISHRA
Centre of Studies in Surface Science and Technology, School of Chemistry, Sambalpur University, Jyoti Vihar, Odisha 768019, India
ARTICLE INFO ABSTRACT
Article History:
Received:4 May 2017 Accepted: 3August 2017
Published online 30 September 2019 Academic Editor: Saeed Masoum
The Bertz indices, derived by counting the number of connecting edges of line graphs of a molecule were used in deriving the QSPR models for the physicochemical properties of alkanes. The inability of these indices to identify the hetero centre in a chemical compound restricted their applications to hydrocarbons only. In the present work, a novel molecular descriptor has been derived from the weighted line graph of the molecular structure and applied in correlating the physicochemical properties of alkane isomers with these descriptors. A weight is tagged at the vertex of the line graph, which consequently modifies the weight of the edge. These descriptors were found to classify the alkane isomers and served well in deriving the QSPR models for various physicochemical properties. The mathematical calculations include the quantitative treatment on the role of substituents (alkyl) in governing the properties under study of the alkane isomers. Further, the use of weighted line graph in the enumeration of the topological index opens up a new vista on application to heteroatomic systems.
© 2019 University of Kashan Press. All rights reserved
Keywords:
Weighted line graph Molecular descriptor Physicochemical properties
1.
I
NTRODUCTIONOwing to the ease in handling vertex and edges with simple graph theoretical principles a large number of topological parameters have been enumerated and used in various quantitative structure property/activity relationships [1]. Conversion of graph to matrices have also contributed a lot to this field of studies and also trespassed in to the field of quantum mechanical calculations [2]. Line graphs (LG), obtained by considering each covalent bond a vertex and connectivity of bonds as edge in hydrogen depleted molecular graphs, have been used to derive molecular descriptors and have been widely used in QSPR studies [3−10].
Corresponding author (Email: [email protected]). DOI: 10.22052/ijmc.2017.84168.1287
Subsequently some novel molecular descriptors have been derived from the line graphs. The spectral moments of line graphs have been used as the molecular descriptors to describe the 13C NMR chemical shift of alkanes [11−13]. A folding degree index for some steroid compounds have been evaluated by using iterated line graphs (ILG) and has been used in the study of drug designing [14]. Guevara compared QSPR models obtained with k-fragmental connectivity indices with that obtained from the molecular connectivity indices of ILGs [15]. The mathematical aspects of LG and ILGs have been extensively studied in the recent years [16−28].
Herein, we have made an attempt to tag the vertex of line graph with a weight to derive some novel molecular descriptors.
H3C
CH CH
C H2
CH3
CH3
CH3
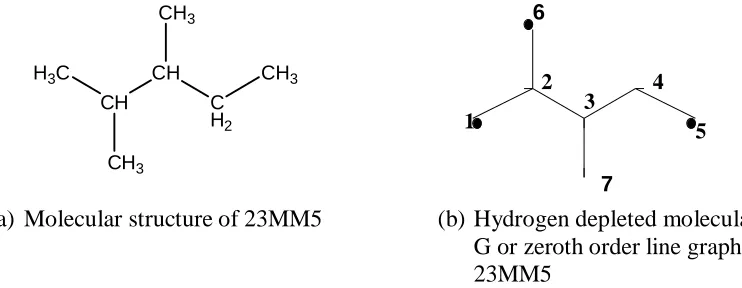
(a) Molecular structure of 23MM5 (b) Hydrogen depleted molecular graph G or zeroth order line graph L(G)0 of 23MM5
Figure 1. Representation of molecular structure and hydrogen depleted molecular graph G of 23MM5.
2.
E
NUMERATION OFW
EIGHTEDL
INEG
RAPHI
NDEXA weighted line graph is the line graph Lw(G) of a molecular graph G in which each vertex (ui) of Lw(G) is assigned with a nonnegative number w(ui), called the weight of ui. As
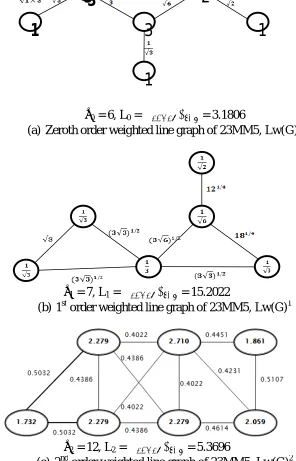
example, the molecular structure and line graph of 2,3-dimethyl pentane (23MM5) can be presented as shown in Figures 1(a) and 1(b). Figures 2(a, b and c) represent the weighted linegraphs of zeroth, first and second order of 23MM5 respectively. Starting with the hydrogen depleted molecular graph G or the zeroth order line graph L(G)0, each vertex of the LG is assigned with a value equal to the weight on the connecting edge of G attached to the vertex ‘vi’ to obtain zero order weighted line graph Lw(G)0. The weight of the edge of
G is the weight of the vertex (w(ui)) is given by
vi-j = w(ui) =
…(1)
where and are the degree (weight) of the vertices vi and vj respectively. The molecular
descriptor for the zeroth order weighted line graph is defined as
L0 = ∑ = ∑
…(2)
1 5
2
3 4
6
θ0 = 6, L0 = ∑ = 3.1806
(a) Zeroth order weighted line graph of 23MM5, Lw(G)0
θ1 = 7, L1 = ∑ = 15.2022
(b) 1st order weighted line graph of 23MM5, Lw(G)1
θ2 = 12, L2 = ∑ = 5.3696
(c) 2nd order weighted line graph of 23MM5, Lw(G)2
Figure 2. Representations of Weighted Line Graph (a) Lw(G)0,(b) Lw(G)1 and (c) Lw(G)2 of 23MM5 and molecular descriptors θi (Bertz index = number of edges in
the respective Line Graph) and Li
1
1
3
1
3
1
2
1
In a similar manner, by considering the edge of Lw(G)0 as the vertex and their connectivity, Lw(G)1 is constructed. The molecular descriptors for higher order Lw(G)s can be determined and denoted as Li, i= 0, 1, 2…., which is the sum of the Lw(G) edges. The
structural difference between the alkane isomers is clearly observed in the plot of molecular descriptor L2 vs physicochemical properties of alkanes. Some dummy descriptors or
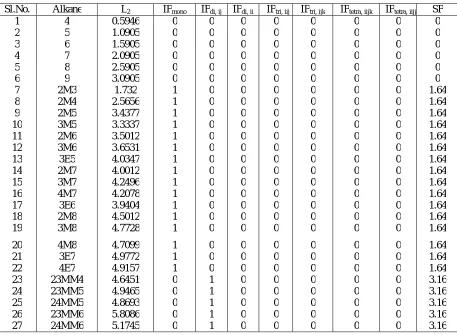
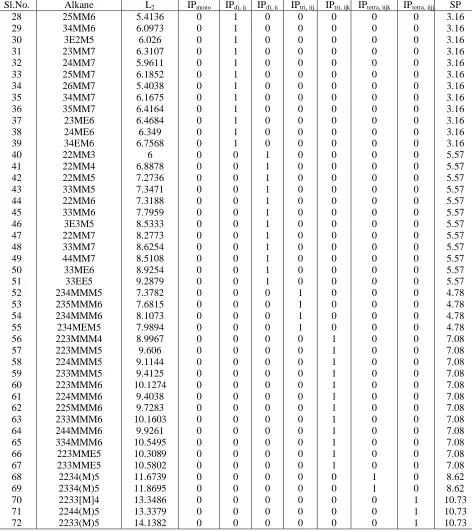
indicators parameters (IP) are used to explain the structural differences of alkane isomers obtained from the plot. One or zero value is assigned for the presence or absence of a particular class of substituent in the structure. A Free-Wilson matrix [29] has been constructed with all the ad hoc indicators (seven in the present study) (Table 3). The physicochemical properties of 72 alkanes (C4−C9) are correlated with the weighted line graph theoretical molecular descriptor L2 along with the indicator parameters (IP) to obtain
a correlation equation,
P = a1L2 + a2 IP1 + a3 IP2 + a4 IP3 + a5 IP4 + a6 IP5 + a7IP6 + a8 IP7 + b …(3)
where P is the physicochemical property collected from Needham-Wei-Seybold data base [30,31], ‘ai’ represents the sensitivity or the contribution of the topological parameter
towards the physicochemical property of the testing molecules and ‘b’ is a constant. The ratio of the coefficient of IP for a particular class of substituent to that of L2, ‘ai/a1’ gives
the contribution of that class of substituent in the molecular structure towards the physicochemical property under consideration. ‘ai/a1’ values for all the physicochemical
properties taken in the present study are determined and it is found that the values are approximately equal (Table 4). The average of ‘ai/a1’ for all the property is taken as the
contribution of that particular class of substituent towards the physicochemical properties of the molecules under consideration and termed as SP (Table 4). Instead of taking seven indicator parameters (IP), a single ad hoc descriptor SP is taken. The value of SP indicates the weight of a particular class of substituent in the molecular structure. Multiple regression analysis is then carried by taking the structural descriptor L2 and the ad hoc descriptor SP
with the physicochemical properties of C3−C9 hydrocarbons. It is found that the descriptor successfully explains the structural difference between the alkane isomers and gives a good model for the surface tension of alkane series.
3.
A
NALYSIS OFW
EIGHTEDL
INE GRAPHI
NDEX(L
I)
From normal hydrogen depleted molecular graph, Bertz indices (θi) have been derived by
the present work, edges of the line graphs are modified with the contribution from the valence electrons of the concerned heteroatom. Akin to enumeration of Kier connectivity index, edges of the line graphs are labeled with a weight and the sum over of the weights has been considered as the weighted line graph index (Li). L0 refers to the zero order line
graph index, which is same as the χ1 index of Kier. From the higher order line graphs, the
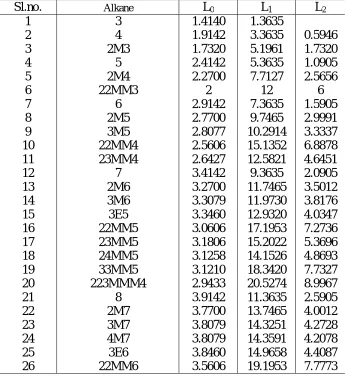
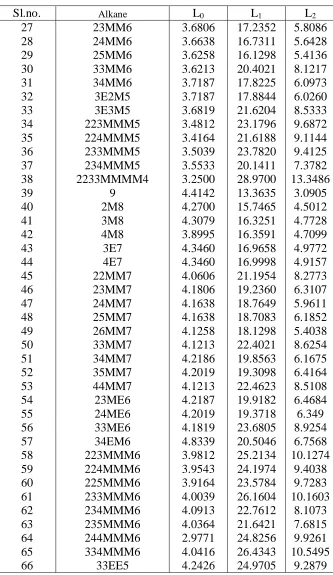
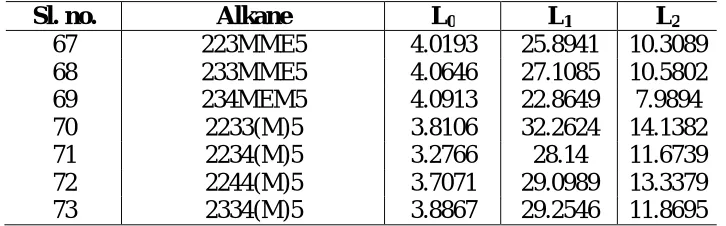
higher order parameters, Li, have been calculated and given in Table 1. Except L2 of
butane, Li for all the other structures are found to be more than one. However, the values
are not as large as the corresponding θis.
The weighted line graph parameter L0 has a homology genesis exhibiting an
increment of 0.5 per increase in methylene unit in a linear graph. It is obvious, as each insertion of a methylene unit adds a weight as (δi δj)-1/2 where δi = δj = 2. In branched
structure, which appears as a tree graph, the increment depends on the degree of the adjacent carbon at the point of insertion.
Table 1. Molecular descriptors of weighted line Graphs of alkane isomers.
Sl.no. Alkane L0 L1 L2
1 3 1.4140 1.3635
2 4 1.9142 3.3635 0.5946
3 2M3 1.7320 5.1961 1.7320
4 5 2.4142 5.3635 1.0905
5 2M4 2.2700 7.7127 2.5656
6 22MM3 2 12 6
7 6 2.9142 7.3635 1.5905
8 2M5 2.7700 9.7465 2.9991
9 3M5 2.8077 10.2914 3.3337
10 22MM4 2.5606 15.1352 6.8878
11 23MM4 2.6427 12.5821 4.6451
12 7 3.4142 9.3635 2.0905
13 2M6 3.2700 11.7465 3.5012
14 3M6 3.3079 11.9730 3.8176
15 3E5 3.3460 12.9320 4.0347
16 22MM5 3.0606 17.1953 7.2736
17 23MM5 3.1806 15.2022 5.3696
18 24MM5 3.1258 14.1526 4.8693
19 33MM5 3.1210 18.3420 7.7327
20 223MMM4 2.9433 20.5274 8.9967
21 8 3.9142 11.3635 2.5905
22 2M7 3.7700 13.7465 4.0012
23 3M7 3.8079 14.3251 4.2728
24 4M7 3.8079 14.3591 4.2078
25 3E6 3.8460 14.9658 4.4087
Table 1. (Continued)
Sl.no. Alkane L0 L1 L2
27 23MM6 3.6806 17.2352 5.8086
28 24MM6 3.6638 16.7311 5.6428
29 25MM6 3.6258 16.1298 5.4136
30 33MM6 3.6213 20.4021 8.1217
31 34MM6 3.7187 17.8225 6.0973
32 3E2M5 3.7187 17.8844 6.0260
33 3E3M5 3.6819 21.6204 8.5333
34 223MMM5 3.4812 23.1796 9.6872
35 224MMM5 3.4164 21.6188 9.1144
36 233MMM5 3.5039 23.7820 9.4125
37 234MMM5 3.5533 20.1411 7.3782
38 2233MMMM4 3.2500 28.9700 13.3486
39 9 4.4142 13.3635 3.0905
40 2M8 4.2700 15.7465 4.5012
41 3M8 4.3079 16.3251 4.7728
42 4M8 3.8995 16.3591 4.7099
43 3E7 4.3460 16.9658 4.9772
44 4E7 4.3460 16.9998 4.9157
45 22MM7 4.0606 21.1954 8.2773
46 23MM7 4.1806 19.2360 6.3107
47 24MM7 4.1638 18.7649 5.9611
48 25MM7 4.1638 18.7083 6.1852
49 26MM7 4.1258 18.1298 5.4038
50 33MM7 4.1213 22.4021 8.6254
51 34MM7 4.2186 19.8563 6.1675
52 35MM7 4.2019 19.3098 6.4164
53 44MM7 4.1213 22.4623 8.5108
54 23ME6 4.2187 19.9182 6.4684
55 24ME6 4.2019 19.3718 6.349
56 33ME6 4.1819 23.6805 8.9254
57 34EM6 4.8339 20.5046 6.7568
58 223MMM6 3.9812 25.2134 10.1274
59 224MMM6 3.9543 24.1974 9.4038
60 225MMM6 3.9164 23.5784 9.7283
61 233MMM6 4.0039 26.1604 10.1603
62 234MMM6 4.0913 22.7612 8.1073
63 235MMM6 4.0364 21.6421 7.6815
64 244MMM6 2.9771 24.8256 9.9261
65 334MMM6 4.0416 26.4343 10.5495
Table 1. (Continued)
Sl. no. Alkane L0 L1 L2
67 223MME5 4.0193 25.8941 10.3089
68 233MME5 4.0646 27.1085 10.5802
69 234MEM5 4.0913 22.8649 7.9894
70 2233(M)5 3.8106 32.2624 14.1382
71 2234(M)5 3.2766 28.14 11.6739
72 2244(M)5 3.7071 29.0989 13.3379
73 2334(M)5 3.8867 29.2546 11.8695
This trend in change is also observed for higher orders of Li. When a methyl group
is a pendant to an alkyl chain, the increment in the L0 varies with degree of the attached
carbon and position in the alkyl chain. With increasing order, the parameters are higher in even orders (0, 2, 4 etc) than the odd orders (1, 3, etc). There is an increasing trend in the parameters for branched alkanes while the data for normal chain exhibit a decreasing trend. Further, Li has been correlated with θi and the extent of correlation has been
presented in a correlation matrix (Table 2). L0 is found to have orthogonal relationship with
higher order index of both weighted and unweighted line graph parameters, while it has a good correlationship with the θ0.The parameters of higher order have a good
interrelationship with each other.
Table 2. Correlation matrix of weighted line graph Indices and Bertz Indices.
L0 L1 L2 θ0 θ1 θ2 θ3 θ4
L0 1
L1 0.51 1
L2 0.28 0.96 1
θ0 0.96 0.71 0.52 1
θ1 0.57 0.99 0.94 0.77 1
θ2 0.28 0.97 0.99 0.51 0.93 1
θ3 0.18 0.91 0.96 0.39 0.84 0.98 1
θ4 0.13 0.85 0.90 0.33 0.77 0.93 0.99 1
4.
A
PPLICATION OFLI
INQSPR
STUDIES OFA
LKANESequation, the correlations with L0 are found to be significant and better than with that of L1
and L2. Though scattered, the plots of the physicochemical parameters with L1 and L2 show
a trend of ordination of the data, higher clarity is observed with L2 than L1.
In a single parametric equation, the BP with L0 has high predictability with a
regression coefficient (R2) of 0.98 and F of 2249.2. However, with L1 and L2, the
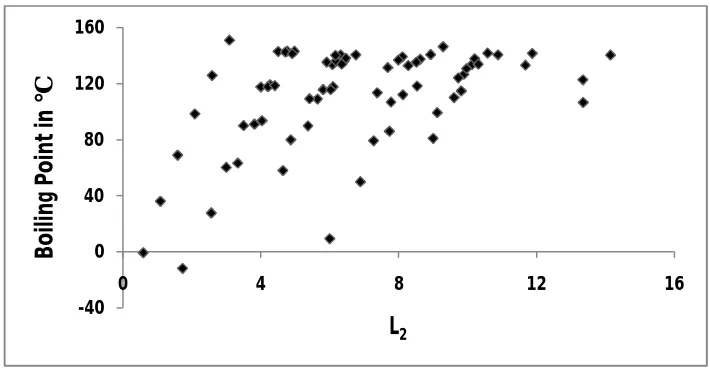
regression coefficients decrease to 0.71 and 0.48 respectively. The plots of L1 and L2 vs
boiling point exhibit a grouping of the compounds in accordance with the structure of the molecules, with more clarity in the plot with L2 for grouping (Figure 3). Addition of one
methyl group as a pendant to the parent alkyl chain constitutes another class of compounds with co-linearity in the plot. Further branching in the alkyl chain leads to several groups, which were identified and accordingly ad hoc indicators of zero and one were assigned for the absence and presence of the branching (Table 3). The contribution of L2 varies to an
extent of 1.644 times on addition of an alkyl group, while addition of another alkyl group at any other position in the alkyl chain adds the contribution to different extent depending on the distance from the first alkyl group. Interestingly, the changes are in an order as presented in Table 1. By considering the extent of contribution, another ad hoc substituent parameter (SP) has been derived which reveals the exact extent of contribution of the substituent towards the activity i.e. instead of using 1 and 0 for the presence and absence of a substituent, SP and 0 have been used. When the data of all the 73 alkanes were subjected to multiple regression analysis, the ‘r’ value increased significantly than that obtained from single parametric equation (i.e. from 0.49 to 0.97). By using the regression model, the BPs have been calculated and plotted against the experimental values to obtain a linear graph (Figure 4).
Figure 3. Plot of BP versus L2 for C3-C9 hydrocarbons.
-40 0 40 80 120 160
0 4 8 12 16
B
o
ili
n
g
P
o
in
t
in
°C
Figure 4. Plot of predicted BP versus observed BP.
Table 3. Topological parameters used in the present study.
Sl.No. Alkane L2 IPmono IPdi, ij IPdi, ii IPtri, iij IPtri, ijk IPtetra, iijk IPtetra, iijj SP
1 4 0.5946 0 0 0 0 0 0 0 0
2 5 1.0905 0 0 0 0 0 0 0 0
3 6 1.5905 0 0 0 0 0 0 0 0
4 7 2.0905 0 0 0 0 0 0 0 0
5 8 2.5905 0 0 0 0 0 0 0 0
6 9 3.0905 0 0 0 0 0 0 0 0
7 2M3 1.732 1 0 0 0 0 0 0 1.64
8 2M4 2.5656 1 0 0 0 0 0 0 1.64
9 2M5 3.4377 1 0 0 0 0 0 0 1.64
10 3M5 3.3337 1 0 0 0 0 0 0 1.64
11 2M6 3.5012 1 0 0 0 0 0 0 1.64
12 3M6 3.6531 1 0 0 0 0 0 0 1.64
13 3E5 4.0347 1 0 0 0 0 0 0 1.64
14 2M7 4.0012 1 0 0 0 0 0 0 1.64
15 3M7 4.2496 1 0 0 0 0 0 0 1.64
16 4M7 4.2078 1 0 0 0 0 0 0 1.64
17 3E6 3.9404 1 0 0 0 0 0 0 1.64
18 2M8 4.5012 1 0 0 0 0 0 0 1.64
19 3M8 4.7728 1 0 0 0 0 0 0 1.64
20 4M8 4.7099 1 0 0 0 0 0 0 1.64
21 3E7 4.9772 1 0 0 0 0 0 0 1.64
22 4E7 4.9157 1 0 0 0 0 0 0 1.64
23 23MM4 4.6451 0 1 0 0 0 0 0 3.16
24 23MM5 4.9465 0 1 0 0 0 0 0 3.16
25 24MM5 4.8693 0 1 0 0 0 0 0 3.16
26 23MM6 5.8086 0 1 0 0 0 0 0 3.16
27 24MM6 5.1745 0 1 0 0 0 0 0 3.16
y = 0.936x + 7.054 R² = 0.936
-40 0 40 80 120 160 200
-25P 15 55 95 135 175
re
d
ic
te
d
Bo
ili
n
g
P
o
in
t
in
°
C
Table 3. (Continued)
Sl.No. Alkane L2 IPmono IPdi, ij IPdi, ii IPtri, iij IPtri, ijk IPtetra, iijk IPtetra, iijj SP
28 25MM6 5.4136 0 1 0 0 0 0 0 3.16
29 34MM6 6.0973 0 1 0 0 0 0 0 3.16
30 3E2M5 6.026 0 1 0 0 0 0 0 3.16
31 23MM7 6.3107 0 1 0 0 0 0 0 3.16
32 24MM7 5.9611 0 1 0 0 0 0 0 3.16
33 25MM7 6.1852 0 1 0 0 0 0 0 3.16
34 26MM7 5.4038 0 1 0 0 0 0 0 3.16
35 34MM7 6.1675 0 1 0 0 0 0 0 3.16
36 35MM7 6.4164 0 1 0 0 0 0 0 3.16
37 23ME6 6.4684 0 1 0 0 0 0 0 3.16
38 24ME6 6.349 0 1 0 0 0 0 0 3.16
39 34EM6 6.7568 0 1 0 0 0 0 0 3.16
40 22MM3 6 0 0 1 0 0 0 0 5.57
41 22MM4 6.8878 0 0 1 0 0 0 0 5.57
42 22MM5 7.2736 0 0 1 0 0 0 0 5.57
43 33MM5 7.3471 0 0 1 0 0 0 0 5.57
44 22MM6 7.3188 0 0 1 0 0 0 0 5.57
45 33MM6 7.7959 0 0 1 0 0 0 0 5.57
46 3E3M5 8.5333 0 0 1 0 0 0 0 5.57
47 22MM7 8.2773 0 0 1 0 0 0 0 5.57
48 33MM7 8.6254 0 0 1 0 0 0 0 5.57
49 44MM7 8.5108 0 0 1 0 0 0 0 5.57
50 33ME6 8.9254 0 0 1 0 0 0 0 5.57
51 33EE5 9.2879 0 0 1 0 0 0 0 5.57
52 234MMM5 7.3782 0 0 0 1 0 0 0 4.78
53 235MMM6 7.6815 0 0 0 1 0 0 0 4.78
54 234MMM6 8.1073 0 0 0 1 0 0 0 4.78
55 234MEM5 7.9894 0 0 0 1 0 0 0 4.78
56 223MMM4 8.9967 0 0 0 0 1 0 0 7.08
57 223MMM5 9.606 0 0 0 0 1 0 0 7.08
58 224MMM5 9.1144 0 0 0 0 1 0 0 7.08
59 233MMM5 9.4125 0 0 0 0 1 0 0 7.08
60 223MMM6 10.1274 0 0 0 0 1 0 0 7.08
61 224MMM6 9.4038 0 0 0 0 1 0 0 7.08
62 225MMM6 9.7283 0 0 0 0 1 0 0 7.08
63 233MMM6 10.1603 0 0 0 0 1 0 0 7.08
64 244MMM6 9.9261 0 0 0 0 1 0 0 7.08
65 334MMM6 10.5495 0 0 0 0 1 0 0 7.08
66 223MME5 10.3089 0 0 0 0 1 0 0 7.08
67 233MME5 10.5802 0 0 0 0 1 0 0 7.08
68 2234(M)5 11.6739 0 0 0 0 0 1 0 8.62
69 2334(M)5 11.8695 0 0 0 0 0 1 0 8.62
70 2233[M]4 13.3486 0 0 0 0 0 0 1 10.73
71 2244(M)5 13.3379 0 0 0 0 0 0 1 10.73
72 2233(M)5 14.1382 0 0 0 0 0 0 1 10.73
Table 4. Substituent parameters for different substituent systems (i, j and k refers to different positions in alkyl chain).
Substituent
Class BP MV MR HV TC ST Avg
mono -1.64398 -1.49541 -1.52473 -1.75967 -1.63573 -1.79132 -1.64181 di, ij -3.21345 -2.88686 -2.93939 -3.37515 -3.16243 -3.43591 -3.16886 di, ii -5.61992 -5.31345 -5.34529 -5.85768 -5.51497 -5.80522 -5.57609 tri, iij -4.85451 -4.52648 -4.52497 -5.07623 -4.71461 -4.99049 -4.78121 tri, ijk -7.15906 -6.7536 -6.77588 -7.44858 -6.98943 -7.37762 -7.08403 tetra, iijk -8.68151 -8.4716 -8.35776 -9.03878 -8.44581 -8.75954 -8.62583 tetra, iijj -10.8251 -10.334 -10.2909 -11.245 -10.7316 -10.9818 -10.7347
Table 5. Parameters of regression model for a generalized equation P = a1SP + a2L2+ b.
Property
(P) a1 a2 b R
2
F R
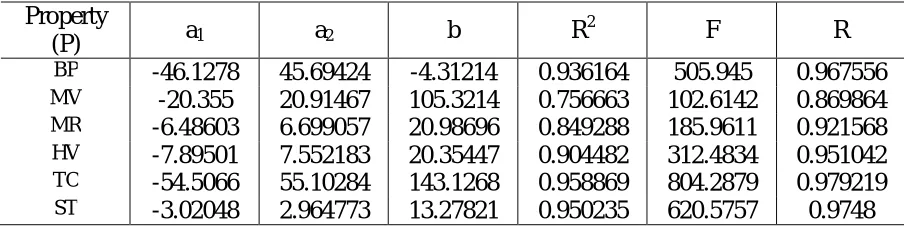
BP -46.1278 45.69424 -4.31214 0.936164 505.945 0.967556 MV -20.355 20.91467 105.3214 0.756663 102.6142 0.869864 MR -6.48603 6.699057 20.98696 0.849288 185.9611 0.921568 HV -7.89501 7.552183 20.35447 0.904482 312.4834 0.951042 TC -54.5066 55.10284 143.1268 0.958869 804.2879 0.979219 ST -3.02048 2.964773 13.27821 0.950235 620.5757 0.9748
The surface tension of a liquid, being an interfacial phenomenon, is found to have poor relationship with the chemical structure. The best correlationship had been obtained by using parameters derived from line graph [9].The use of weighted line graph parameter was found to be more fruitful with a significant increase in the R2 and F value (Table 5). It seems obvious because these parameters relate to the branched alkyl groups which are mostly responsible for the interfacial activity.
Thus, weighted line graph is found to be a promising tool for enumerating molecular descriptors for both carbonaceous as well as heteroatomic systems to be used in QSP/AR studies.
Acknowledgement. BKM thanks University Grant Commission (New Delhi) for financial support through Basic Science Research Faculty Fellowship and Emeritus Fellowship.
R
EFERENCES1. R. Todeschini and V, Consonni, Handbook of Molecular Dscriptors, Wiley VCH,
2. R. K. Mishra and B. K. Mishra,A critical assessment of closed- and open-shell heterocyclobutadienes, Chem. Phy. Lett. 151 (1988) 44−46.
3. F. Harary, Graph Theory, Addison Wesley Publishing Company, New York, 1969.
4. S. H. Bertz in: Chemical Applications of Topology and Graph Theory, R. B. King (Ed.), Elsevier, Amsterdam, 1993, p. 206.
5. S. H. Bertz, Branching in graphs and molecules, Discrete Appl. Math. 19 (1988) 65−83.
6. I. Gutman, L. Popović, B. K. Mishra, M. Kuanar and E. Estrada, Application of line
graphs in physical chemistry. Predicting the surface tensions of alkanes, J. Serb. Chem. Soc. 62 (1997) 1025−1030.
7. M. Kuanar, S. K. Kuanar, B. K. Mishra and I. Gutman, Correlation of line graph parameters with physicochemical properties of octane isomers, Indian J. Chem.
38A (1999) 525−528.
8. I. Gutman and Z. Tomovic, On the application of line graphs in quantitative
structure-property studies, J. Serb. Chem. Soc. 65 (2000) 577−580.
9. I. Gutman, Z. Tomvic, B. K. Mishra and M. Kuanar, On the use of iterated line graphs in quantitative structure-property studies, Indian J. Chem. 40A (2001) 4−11.
10.Z. Tomovic and I. Gutman, Modeling boiling points of cycloalkanes by means of
iterated line graph sequences, J. Chem. Inf. Comput. Sci. 41 (2001) 1041−1045.
11.E. Estrada, Modelling the diamagnetic susceptibility of organic compounds by a
sub-structural graph-theoretical approach, J. Chem. Soc. Faraday Trans. 94 (1998)
1407−1410.
12.E. Estrada, A computer-based approach to describe the 13 C NMR chemical shifts
of alkanes by the generalized spectral moments of iterated line graphs, Comput.
Chem. 24 (2000) 193−201.
13.I. Gutman and E. Estrada, Topological indices based on the line graph of the
molecular graph, J. Chem. Inf. Comput. Sci. 36 (1996) 541−543.
14.E. Estrada, Application of a novel graph-theoretic folding degree index to the study
of steroid–DB3 antibody binding affinity, Comp. Biol. Chem. 27 (2003) 305−313.
15.N. Guevara, Fragmental graphs. A novel approach to generate a new family of
descriptors. Applications to QSPR studies, J. Mol. Struct. (THEOCHEM) 493
(1999) 29−36.
16.A. A. Dobrynin and L. S. Mel’nikov, Wiener index for graphs and their line graphs
with arbitrary large cyclomatic numbers, Appl. Math. Lett. 18 (2005) 307−312.
17.H. S. Ramane, K. P. Narayankar, S. S. Shirkol and A. B. Ganagi, Terminal Wiener
index of line graphs, MATCH Commun. Math. Comput. Chem. 69 (2013) 775−782.
18.A. A. Dobrynin and L. S. Mel’nikov,Wiener index of generalized stars and their
19.B. Wu, Wiener index of line graphs, MATCH Commun. Math. Comput. Chem. 64
(2010) 699−706.
20.H. S. Ramane, I. Gutman and A. B. Ganagi, On diameter of line graphs, Iran. J.
Math. Sci. Inf. 8 (2013) 105−109.
21.A. A. Dobrynin and L. S. Mel'nikov, Trees and their quadratic line graphs having
the same Wiener index, MATCH Commun. Math. Comput. Chem. 50 (2004)
145−164.
22.A. A. Dobrynin and L. S. Mel'nikov, Some results on the Wiener index of iterated
line graphs, Electronic Notes Discrete Math. 22 (2005) 469−475.
23.M. Knor, P. Potočnik and R. Škrekovski, Wiener index of iterated line graphs of
trees homeomorphic to H, Discrete Math. 313 (2013) 1104−1111.
24.A. A. Dobrynin, R. Entringer and I. Gutman, Wiener index of trees: theory and
applications, Acta Appl. Math. 66 (2001) 211−249.
25.A. A. Dobrynin and L. S. Mel’nikov, Wiener index, line graphs and the cyclomatic
number, MATCH Commun. Math. Comput. Chem. 53 (2005) 209−214.
26.M. Knor, P. Potočnik and R. Škrekovski, The Wiener index in iterated line graphs,
Discrete Appl. Math. 160 (2012) 2234−2245.
27. M. Knor, P. Potočnik and R. Škrekovski, On a conjecture about Wiener index in
iterated line graphs of trees, Discrete Math. 312 (2012) 1094−1105.
28. P. Dankelmann, I. Gutman, S. Mukwembi and H. C. Swart, The edge-Wiener index
of a graph, Discrete Math. 309 (2009) 3452−3457.
29. S. M. Free and J. W. Wilson, A mathematical contribution to structure-activity
studies, J. Med. Chem. 7 (1964) 395−399.
30. D. R. Lide, CRC Handbook of Chemistry and Physics, 73rd Ed., CRC Press, Boca
Raton, FL, 1992.
31. D. E. Needham, I. C. Wei and P. G. Seybold, Molecular modeling of the physical