*
Corresponding author: [email protected] 48
Propionic Acid Extraction in a Microfluidic System: Simultaneous
Effects of Channel Diameter and Fluid Flow Rate on the Flow
Regime and Mass Transfer
F. Hosseini, M. Rahimi *, O. Jafari
CFD Research Center, Chemical Engineering Department, Razi University, Kermanshah, Iran
ARTICLE INFO ABSTRACT
Article history: Received: 2018-07-02
Accepted: 2018-11-06
In this work, extraction of propionic acid from the aqueous phase to the organic phase (1-octanol) was performed in T-junction microchannels, and effects of channel diameter and fluid flow rate on the mass transfer characteristics were investigated. The two-phase flow patterns in the studied microchannels with 0.4 and 0.8 mm diameters were observed. Weber number and surface-to-volume ratio were calculated for evaluating flow patterns. Moreover, the effects of volumetric flow rates on the extraction efficiency, volumetric mass transfer coefficient, and pressure drop were examined. Results showed that the pressure drop in the microchannel with 0.4 mm diameter was 2-2.7 times higher than that in the microchannel with 0.8 mm diameter. In both microchannels, with an increase in the flow rate, the extraction efficiency first increased and, then, decreased. In addition, at high flow rates (2.4, 4.5, and 6 mL/min), the extraction efficiency in the microchannel with 0.8 mm diameter increased up to the range of 7-14.9 % compared with that in the microchannel with 0.4 mm diameter.
Keywords:
Extraction, Propionic Acid, Microfluidic, Channel Diameter, Flow Rate
1. Introduction
Microchannel devices are an attractive replacement for conventional heat and mass transfer systems; accordingly, due to the short diffusion path and high surface-to-volume ratio, the increase of heat and mass transfer at low residence times is indentified [1-4]. The mass transfer rate in different types of microchannels is about two or three orders of magnitude higher than conventional mass transfer systems [5]. Furthermore, enlarging microchannels is easy and can be provided with parallel microchannels [6, 7]. There are some disadvantages in using microchannels,
such as high-pressure drop, disability to transport a feed containing solid particles, and the possibility of blocking the channel. However, the use of microchannels in the liquid-liquid extraction operations is very efficient. Solvent extraction has many applications in various industries including the petroleum, food, and chemical industries. Liquid-liquid extraction can be influenced by flow patterns and residence time in the microchannel. The flow patterns in the
microchnnel are controlled by the
Iranian Journal of Chemical Engineering, Vol. 15, No. 4 (Autumn 2018) 49
microchannel geometries, the fluid properties, and the construction material of the microchannel [8]. The common flow patterns in the liquid-liquid two-phase flow are slug,
bubbly, parallel, and annular flows.
Regarding the direct link between the flow patterns and mass transfer characteristics, the hydrodynamics of liquid-liquid two-phase flow and mass transfer characteristics in microchannels have been studied in many literatures [9-12]. There are many interesting research studies in this field, some of which are mentioned as follows. Tang et al. [5] investigated liquid-liquid extraction and two-phase flow patterns in a vertical microchannel. Plug flow and droplet flow were formed in the mixing channel. They studied the effect of various operating conditions on the average droplet diameter, extraction efficiency, and volumetric mass transfer coefficient. Plouffe et al. [13] studied mass transfer rates in complex microreactors in parallel, slug, and drop/dispersed flow regimes. They found that an increase in flow rate and drop flow led to an increase in conversion.
Propionic acid is a significant carboxylic acid, which is used in various industries such as food, chemical, and pharmaceutical
industries [14]. Fermentation processes
mainly produce this acid. Recovery of carboxylic acids from produced dilute solutions with acid content less than 10 % w/w is a problem while using fermentation for the production of carboxylic acids [15, 16]. Solvent extraction is an important recovery method, which, due to lower energy costs, has been used for recovering carboxylic acids. Many studies have been done on the extraction of carboxylic acids in batch systems [17-20]. Nevertheless, there are some disadvantages, such as low interfacial area
and long mixing times, in batch systems. Many researchers have used microchannels for solvent extraction, and they have reported suitable results. Zhao et al. [21] studied liquid-liquid mass transfer performance in two types of T-junction microchannels including opposing-flow and cross-flow.
Kashid et al. [22] used Y-junction
microchannels for extraction of succinic acid from water by n-butanol as a solvent, and they obtained mass transfer coefficients and extraction efficiency. It was found that mass transfer coefficients and efficiency of extraction in such microchannels were higher than conventional extractors.
In this research, the extraction of propionic acid from water using 1-octanol in the microfluidic system as an efficient alternative for conventional extraction systems is undertaken. Simultaneous effects of the channel diameter and the fluid flow rate on the extraction efficiency of propionic acid are the main issues in this work. In fact, investigating the effects of the channel diameter on the extraction efficiency at different flow rates is very helpful in
determining the proper size of the
microchannel at each flow rate. For this purpose, two T-junction microchannels with 0.4 and 0.8 mm diameters were used, and experiments were performed at various volumetric flow rates. In addition, the
two-phase flow patterns in the studied
microchannels were observed, and the surface-to-volume ratio was calculated to evaluate the mixing mechanism.
2. Experimental 2.1. Material
50 Iranian Journal of Chemical Engineering, Vol. 15, No. 4 (Autumn 2018)
water was used for preparing the aqueous phase. NaOH was used to analyze the samples by titration and supplied from the Merck Company. Phenolphthalein solution as an indicator (pH range 8.2–10.0) was used to determine the endpoint in titration and was
provided from the Merck Company. All these materials were used as purchased and without more purification. The physical properties of aqueous and organic phases used in the experiments are summarized in Table 1.
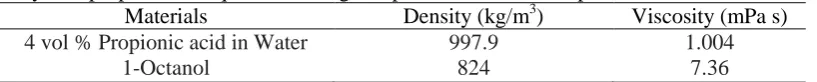
Table 1
Physical properties of aqueous and organic phases used in the experiments.
Materials Density (kg/m3) Viscosity (mPa s)
4 vol % Propionic acid in Water 997.9 1.004
1-Octanol 824 7.36
2.2. Experimental setup
Experiments were performed in two T-junction microchannels with different diameters of 0.4 mm and 0.8 mm and the same length of 40 cm. The microchannels
were fabricated by connecting the glass tubes, and the intersection angle of two liquid inlet channels was 180°. The real photograph of T-junction microchannel is illustrated in Fig. 1.
Figure 1. Real photograph of the T-junction microchannel.
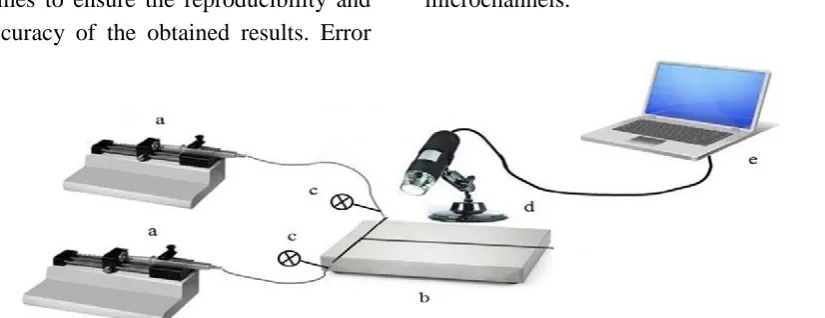
A syringe pump was used to inject aqueous and organic phases into microchannels. In order to observe the two-phase flow patterns in microchannels, the images of fluid flow inside the mixing channel were recorded by a digital microscope (640 × 480 pixels and with the magnification of 10×300) that was connected to a laptop. The pressure drop across the mixing channel was measured by a high-precision pressure transducer (BD sensor, DMP 343, Germany). A schematic view of the experimental setup is shown in Fig. 2.
2.3. Experimental procedure
First, a propionic acid aqueous solution with
Iranian Journal of Chemical Engineering, Vol. 15, No. 4 (Autumn 2018) 51
the aqueous 0.5 M sodium hydroxide and the Phenolphthalein indicator were used for titration. Each experiment was performed three times to ensure the reproducibility and high accuracy of the obtained results. Error
bars were calculated. Violet dye was added to the aqueous phase to observe flow patterns at various volumetric flow rates in the microchannels.
Figure 2. Schematic view of the experimental setup: (a) syringe pumps, (b) microchannel, (c) pressure transducer, (d) digital microscope, and (e) laptop.
3. Data reduction
The Weber (We) numbers of aqueous and organic phases were calculated in terms of the superficial velocities according to the following equations [23]:
2 aq aq aq
DU
W e ρ
σ
= (1)
2 org org org
DU
W e ρ
σ
= (2)
where D,ρaq, ρorg, and σ are the diameter of
the microchannel, the density of aqueous phase, the density of organic phase, and the interfacial tension between water and
1-octanol, respectively. Uaq and Uorg are the
superficial velocities of aqueous and organic phases, respectively, calculated as follows [23]:
aq aq
Q U
A
= (3)
org org
Q U
A
= (4)
where Qaq, Qorg, and A are the volumetric
flow rate of the aqueous phase, the volumetric
flow rate of the organic phase, and
cross-sectional area of the microchannel,
respectively. In the present liquid-liquid mass transfer process, propionic acid is transferred from water to 1-octanol, associated with two immiscible phases. The extraction efficiency of propionic acid can be defined as follows [24, 25]:
, ,
, *
aq in aq out
aq in aq
C C
E
C C
−
−
= (5)
whereCaq in, and Caq out, are the concentrations
of propionic acid at the inlet and outlet of the
aqueous phase, respectively. Caq* is the
equilibrium concentration of the propionic acid in the aqueous phase. The overall
volumetric mass transfer coefficient (K aL ) is
used to evaluate the mass transfer rate. K aL
is defined by the following equations [24, 25]:
,
,,
1
ln aq in aq
L
M aq out aq
C C
K a
t C C
∗
∗
−
=
−
(6)
M
org aq V t
Q Q
=
52 Iranian Journal of Chemical Engineering, Vol. 15, No. 4 (Autumn 2018)
where tMis the residence time of the
two-phase mixture, and V is the total volume of
the mixing channel.
4. Results and discussion
4.1. Liquid-liquid two-phase flow patterns in microchannels
In order to investigate the effect of two-phase volumetric flow rates on the flow patterns, volumetric flow rates of aqueous and organic phases were considered in the range of 0.6 to 6 mL/min. The two-phase volumetric flow rate ratio was equal to unity, and experiments were carried out in both microchannels. The two-phase flow patterns in microchannels were observed using the digital microscope, fixed above the mixing channel of microchannels. Magnification of digital microscope was set at a fixed value, and the pictures were captured at a constant luminance to confirm that all of them were captured under the same conditions. In this section, very small amounts of violet dye were dissolved in the aqueous phase for a better visual observation of flow phenomena. Fig. 3 depicts real pictures of flow patterns in the mixing channel of microchannels. Different flow patterns were observed in the mixing channels, depending on the diameter of microchannels and two-phase volumetric flow rates. For two immiscible fluids, flow patterns primarily depend on interfacial tension, viscous forces, and inertia forces. However, gravity has a negligible effect on flow patterns in the micro-scale devices [8]. Due to the small size of the studied microchannels, interfacial tension and inertial force become dominant stresses [26]. In fact, these stresses are competing with each other and can skew the interface of two liquids. The interfacial tension inclines to decrease the
Iranian Journal of Chemical Engineering, Vol. 15, No. 4 (Autumn 2018) 53
d=0.8 mm d=0.4 mm
a
b
c
d
Figure 3. Real pictures of flow patterns in the mixing channel of microchannels: (a) Qin=0.6 mL/min, (b) Qin=1.8 mL/min, (c) Qin=2.4 mL/min, and (d) Qin=4.5 and 6 mL/min.
Table 2
Weber numbers of aqueous and organic phases for different flow patterns. flow pattern Qin (mL/min) Weaq Weorg
d=0.4 mm
slug 0.6 0.2967 0.24494.5
slug 1 0.5239 0.4325
slug 1.8 0.9694 0.8002
parallel 2.4 4.7472 3.9199
annular 4.5 16.6893 13.7809
annular 6 29.6698 24.4994
d=0.8 mm
slug 0.6 0.0375 0.0309
slug 1 0.1033 0.0853
slug 1.8 0.3339 0.2758
slug 2.4 0.5937 0.4902
parallel 4.5 2.0858 1.7223
54 Iranian Journal of Chemical Engineering, Vol. 15, No. 4 (Autumn 2018)
With the increase of the volumetric flow rate of aqueous and organic phases, parallel flow is formed through coalescence of small-sized slugs. In this flow pattern, aqueous and organic phases flow side by side in the mixing channel. The interface of aqueous and organic phases can be smooth or wavy [21, 23]. In this case, the interface of the two phases was smooth, indicating that the flow was fully developed [27]. The parallel flow was observed at volumetric flow rates of 1.8 and 2.4 mL/min to the microchannel with 0.4 mm diameter and at volumetric flow rates 4.5 and 6 mL/min to the microchannel with 0.8 mm diameter. Increasing the superficial velocity leads to an increase in the inertia force, resulting in the Weber number. Calculated Weber numbers of aqueous and organic phases for the parallel flow pattern were more than unity. This suggests that, in the parallel flow, the inertia force is stronger than the interfacial tension force.
Finally, the annular flow pattern appeared at elevated superficial velocities of phases in the microchannel. In this flow, the organic phase is present in the central core of the mixing channel and surrounded by the aqueous phase. The aqueous phase flowed near the walls of the mixing channel. The annular flow was observed at the volumetric flow rates of 4.5 and 6 mL/min to the microchannel with 0.4 mm diameter. Since, at these volumetric flow rates, superficial velocities in the microchannel with 0.8 mm diameter were low, annular flow was not formed in this microchannel. Weber numbers of aqueous and organic phases related to the annular flow pattern were more than 10, which is in agreement with the observations reported by Zhao et al. [23]. In the annular flow pattern, the inertia force is dominant over the
interfacial tension.
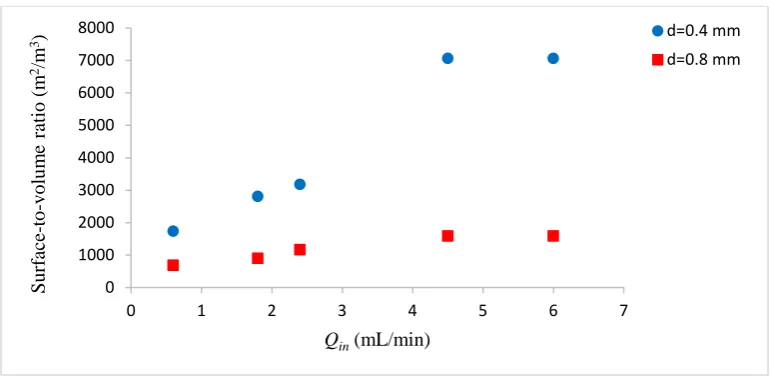
4.2. Surface-to-volume ratio of flow patterns
Iranian Journal of Chemical Engineering, Vol. 15, No. 4 (Autumn 2018) 55 Figure 4. Surface-to-volume ratio as a function of the volumetric flow rate.
4.3. Mass transfer
4.3.1. Extraction efficiency
Fig. 5 presents the extraction efficiency of propionic acid from aqueous into organic phase versus the volumetric flow rate of aqueous and organic phases in the studied microchannels. The results show that, in both microchannels, the extraction efficiency does not have a constant trend with the increase of the volumetric flow rate. First, as the volumetric flow rate increased, the extraction
efficiency increased. However, it decreased at higher flow rates. This can be described by the fact that the extraction efficiency depends on two parameters of the superficial velocity and residence time in the microchannel. With the enhancement of the volumetric flow rate, superficial velocity increases and residence time decreases. An increase in superficial velocity leads to a change in flow patterns, resulting in a change in the surface-to-volume ratio.
Figure 5. Effect of volumetric flow rate on the extraction efficiency.
At the low volumetric flow rates, the flow pattern is slug flow. The mass transfer between the two phases at the slug flow takes place by two different mechanisms: (a) the convection associated with the internal
circulation in each slug; (b) molecular
diffusion associated with concentration
gradients between adjoining slugs [8]. The increase of the extraction efficiency with the volumetric flow rate at the slug flow occurs,
0 1000 2000 3000 4000 5000 6000 7000 8000
0 1 2 3 4 5 6 7
S
u
rf
ace
-to
-v
o
lu
m
e
ra
tio
(
m
2/m 3)
Qin (mL/min)
d=0.4 mm d=0.8 mm
0.5 0.55 0.6 0.65 0.7 0.75 0.8 0.85 0.9 0.95
0 1 2 3 4 5 6 7
E
Qin (mL/min)
d=0.4 mm
56 Iranian Journal of Chemical Engineering, Vol. 15, No. 4 (Autumn 2018)
because the internal circulation in the slugs increases with the enhancement of superficial velocity [8]. Moreover, the increase of the superficial velocity leads to a decrease in the slugs length, resulting in an increase in the surface-to-volume ratio. Therefore, at the slug flow, the increase of superficial velocity is the dominating effect as compared with the decrease of residence time. In both microchannels, by improving the volumetric
flow rate and forming the parallel flow (Qaq =
Qorg = 2.4 mL/min in the microchannel with
0.4 mm diameter and Qaq = Qorg = 4.5 mL/min
in the microchannel with 0.8 mm diameter), the extraction efficiency decreased, because although the surface-to-volume ratio in the parallel flow is higher than that in the slug flow, the residence time is lower. In addition, due to the absence of the internal circulation phenomenon in the parallel flow, molecular diffusion in this flow is slower than that in the slug flow. In the microchannel with 0.8 mm diameter, with the increase of the volumetric flow rate from 4.5 to 6 mL/min, the flow pattern is still parallel flow. Hence, the increase of the volumetric flow rate only leads to the decrease of residence time and results in the decrease of extraction efficiency. In the microchannel with 0.4 mm diameter, with the increase of the volumetric flow rate from 2.4 to 4.5 mL/min, the annular flow is formed. The surface-to-volume ratio in the annular flow is higher; however, the residence time is lower than that in the parallel flow. Thus, despite the high surface-to-volume ratio in the annular flow, there is not enough time for mass transfer between the two phases, and the extraction efficiency in the annular flow is less than that in the parallel flow.
In addition, Fig. 5 demonstrates that the
extraction efficiencies in the microchannel with 0.4 mm diameter at low volumetric flow
rates are higher than those in the
microchannel and are lower than those in the microchannel with 0.8 mm diameter at the high volumetric flow rates. In fact, at the volumetric flow rates of 0.6, 1, and 1.8 mL/min, whose flow pattern in both microchannels is slug flow, the extraction efficiency in the microchannel with 0.4 mm
diameter is more than that in the
Iranian Journal of Chemical Engineering, Vol. 15, No. 4 (Autumn 2018) 57
in the microchannel with 0.4 mm diameter, the extraction efficiency in this microchannel is lower than that in the microchannel with 0.8 mm diameter. At the volumetric flow rates of 4.5 and 6 mL/min, the flow pattern in the microchannel with 0.4 mm diameter is annular flow and is parallel flow in the microchannel with 0.8 mm diameter. Hence, the surface-to-volume ratio in the microchannel with 0.4 mm diameter is higher; however, the residence time is lower than that in the microchannel with 0.8 mm diameter. As shown in Fig. 5, at the mentioned volumetric flow rates, the extraction efficiency in the microchannel with 0.4 mm
diameter is lower than that in the
microchannel with 0.8 mm diameter. This indicates that, at these volumetric flow rates,
the high residence time in the microchannel with 0.8 mm diameter is the dominating influence as compared with the high surface-to-volume ratio in the microchannel with 0.4 mm diameter.
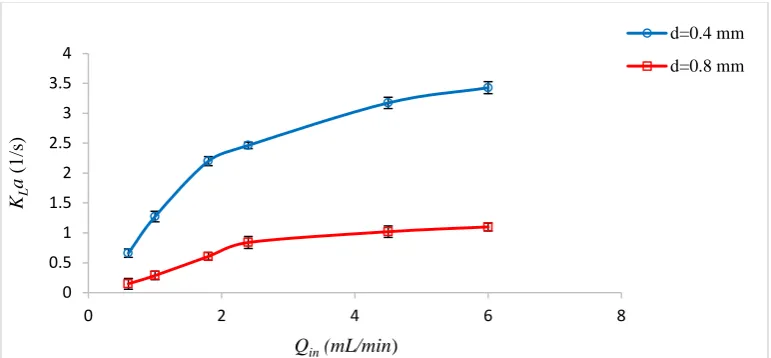
4.3.2. Volumetric mass transfer coefficient
The effects of the volumetric flow rate and the diameter of the microchannel on the volumetric mass transfer coefficient are presented in Fig. 6. According to Fig. 6, in both microchannels, the volumetric mass transfer coefficient increases with the increase of the volumetric flow rate. With the increase of the volumetric flow rate, the surface-to-volume ratio increases. Thus, a higher mass transfer rate of the aqueous phase to the organic phase can be expected.
Figure 6. Effects of the volumetric flow rate on the volumetric mass transfer coefficient.
In the range of slug flow, the increasing tendency of the volumetric mass transfer coefficient with the volumetric flow rate is steeper than other flow patterns. Because, at the slug flow, in addition to increasing the surface-to-volume ratio, the internal circulation within the slugs also increases with the increase of the volumetric flow rate. At the volumetric flow rates of 4.5 and 6 mL/min, flow patterns in the microchannel with 0.8 mm diameter are parallel flow and in
the microchannel with 0.4 mm diameter are annular flow. Therefore, in both microchannels, with the increase of the volumetric flow rate from 4.5 to 6 mL/min, the surface-to-volume ratio remains constant and only the residence time decreases, resulting in the increasing tendency of the volumetric mass transfer coefficient as the volumetric flow rate decreases.
The volumetric mass transfer coefficient in the microchannel with 0.4 mm diameter is
0 0.5 1 1.5 2 2.5 3 3.5 4
0 2 4 6 8
KL
a
(
1
/s)
Qin(mL/min)
d=0.4 mm
58 Iranian Journal of Chemical Engineering, Vol. 15, No. 4 (Autumn 2018)
higher than that in the microchannel with 0.8 mm diameter. This may be explained by the fact that with a decrease in the microchannel diameter, the surface-to-volume ratio and, consequently, the volumetric mass transfer coefficient increase. On the other hand, the decrease of the microchannel diameter also leads to a shorter mass transfer path as compared with the microchannel with 0.8 mm diameter.
4.4. Pressure drop
Generally, the pressure drop is a significant problem in the microchannels, leading to a high energy consumption. During the experiments, the pressure in microchannels’ outlet was kept fixed at the atmospheric pressure, and the pressure drop was measured
using the transducer pressure. The pressure drop data across the microchannels with 0.4
and 0.8 mm diameters for different
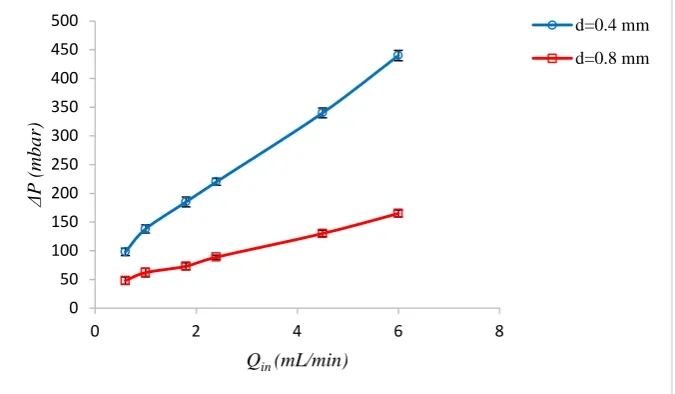
volumetric flow rates are illustrated in Fig. 7.
It can be observed that, in both
microchannels, the pressure drop increases as the volumetric flow rate increases. As mentioned before, an increase in the volumetric flow rate leads to an increase in the superficial velocity and, consequently, in pressure drop. As expected, the microchannels with 0.4 mm diameter produce more pressure drop than the microchannels with 0.8 mm diameter at the same volumetric flow rates. In fact, the fluid flows in the microchannel with 0.8 mm diameter easier than that in the microchannel with 0.4 mm diameter.
Figure 7. Pressure drop at various volumetric flow rates.
4.5. Energy dissipation
In order to overcome the created pressure drop, it is required to consume a remarkable amount of energy. The measured pressure drops across the studied microchannels correspond to the energy dissipation (ε) into the microchannel. The energy dissipation is an important parameter in microchannels, which can be calculated by the following
equation [28]:
m PU
L
ε = ∆ (8)
where∆P, Um, and L are the pressure drop
across the microchannel, the total superficial velocity of the aqueous and organic phases, and the length of the mixing channel,
respectively. Some researchers have
employed this correlation to estimate the
0 50 100 150 200 250 300 350 400 450 500
0 2 4 6 8
Δ
P
(
m
bar
)
Qin (mL/min)
d=0.4 mm
Iranian Journal of Chemical Engineering, Vol. 15, No. 4 (Autumn 2018) 59
required energy to pump the fluid by plotting the volumetric coefficient KLa as a function
of the energy dissipation in microchannels [28, 29]. In the present work, the volumetric
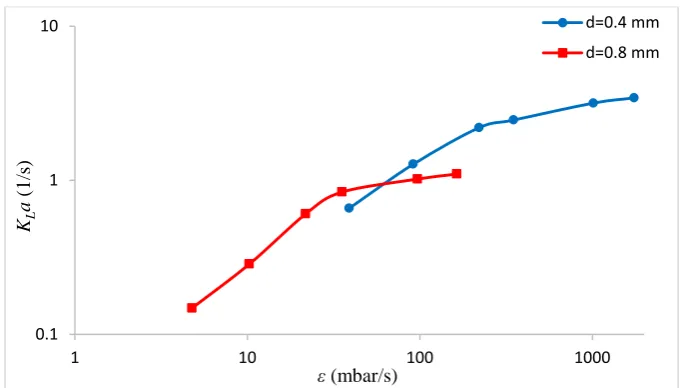
mass transfer coefficient has been plotted versus the energy dissipation for the studied microchannels at the same volumetric flow rates (Fig. 8).
Figure 8. Volumetric mass transfer coefficient as a function of dissipation energy for microchannels with 0.4 and 0.8 mm diameters.
Fig.8 reveals that, in both microchannels, the volumetric mass transfer coefficient has an ascending trend with the enhancement of energy dissipation. According to Eq. 8, the energy dissipation is proportional to the pressure drop and the total superficial
velocity. Therefore, the increase of
volumetric flow rate enhances the energy dissipation. In fact, with the increase of the volumetric flow rate, the volumetric mass transfer coefficient and the energy dissipation increase simultaneously. In the range of experiments, the lowest value of energy dissipation for the microchannel with 0.4 mm diameter was equal to 38.98 kPa/s. For this reason, the curve related to this microchannel in Fig.8 started at this value. In addition, Fig.8 illustrates that, at the same volumetric flow rates, the volumetric mass transfer coefficient and energy dissipation in the microchannels with 0.4 mm diameter are higher than those in the microchannels with 0.8 mm diameter. This means that to achieve a high volumetric
mass transfer coefficient, further energy needs to be consumed.
5. Conclusions
This study investigated the effect of the channel diameter and fluid flow rate on the mass transfer characteristics in two T-junction microchannels with 0.4 and 0.8 mm diameters. The effect of the volumetric flow rate on the flow patterns was studied at the same aqueous-to-organic volumetric flow rate for the studied microchannels. Depending on the volumetric flow rate of fluids and the channel diameter, different flow patterns, including slug, parallel, and annular flows, were observed. The results showed that with the increase of the volumetric flow rate and decrease of channel diameter, the surface-to-volume ratio, surface-to-volumetric mass transfer coefficient, pressure drop, and energy dissipation increased. The extraction efficiency is dependent on the superficial velocity and residence time in microchannels.
0.1 1 10
1 10 100 1000
KL
a
(
1
/s)
ε (mbar/s)
60 Iranian Journal of Chemical Engineering, Vol. 15, No. 4 (Autumn 2018)
In the range of slug flow in microchannels, the extraction efficiency has a direct relationship with the volumetric flow rate. With an increase in the volumetric flow rate and forming parallel and annular flows, the extraction efficiency decreased up to 11.8 and 25.1 %, respectively, as compared with slug flow. In addition, the extraction efficiency in the microchannel with 0.4 mm diameter, at low flow rates (0.6, 1, and 1.8 mL/min), increased up to 2.7-4.4 % at high flow rates (2.4, 4.5, and 6 mL/min) and decreased up to 7-14.9 % compared with that in the microchannel with 0.8 mm diameter.
Nomenclature
A cross-sectional area of
microchannel [m2].
C concentration of propionic acid [mol/L].
D diameter of microchannel [m]. E extraction efficiency.
KLa
volumetric mass transfer coefficient [1/s].
L length of mixing channel [m/s].
∆P pressure drop [mbar]. Q volumetric flow rate [m3/s].
TM
residence time of mixture two-phase [s].
U superficial velocity [m/s].
V total volume of mixing channel [m3].
We Weber number. Greek letters
ε energy dissipation [mbar/s]. ρ mass density [kg/m3]. σ interfacial tension [N/m]. Subscripts
aq aqueous phase. org organic phase.
in inlet.
m mixture of the liquid-liquid two phases.
out outlet.
References
[1] Yang, L., Zhao, Y., Su, Y. and Chen, G.,
“An experimental study of copper extraction characteristics in a T-junction
microchannel”, Chem. Eng. Technol., 36
(6), 985 (2013).
[2] Mahjoob, M., Etemad, S. G. and
Thibault, J., “Numerical study of non-Newtonian flow through rectangular
microchannels”, Iranian J. Chem. Eng., 6
(4), 45 (2009).
[3] Almasvandi, M. and Rahimi, M., “Waste
water ammonia stripping intensification
using microfluidic system”, Iranian J.
Chem. Eng., 14 (4), 17 (2017).
[4] Basiri, M., Rahimi, M. and Babaei, M.
H., “Ultrasound-assisted biodiesel
production in microreactors”, Iranian J.
Chem. Eng., 13 (2), 22 (2016).
[5] Tang, J., Zhang, X., Cai, W. and Wang,
F., “Liquid-liquid extraction based on droplet flow in a vertical microchannel”,
Exp. Therm. Fluid. Sci., 49, 185 (2013).
[6] Zhang, L., Xie, F., Li, S., Yin, S., Peng,
J. and Ju, S., “Solvent extraction of Nd(III) in a Y type microchannel with 2-ethylhexyl phosphoric acid-2-2-ethylhexyl
ester”, Green Process Synthesis, 4 (1),
(2015).
[7] Kashid, M. N., Gupta, A., Renken, A.
and Kiwi-Minsker, L., “Numbering-up and mass transfer studies of liquid-liquid two-phase microstructured reactors”,
Chem. Eng. J., 158 (2), 233 (2010).
[8] Dessimoz, A. -L., Cavin, L., Renken, A.
and Kiwi-Minsker, L., “Liquid-liquid two-phase flow patterns and mass transfer characteristics in rectangular
glass microreactors”, Chem. Eng. Sci., 63
(16), 4035 (2008).
Kiwi-Iranian Journal of Chemical Engineering, Vol. 15, No. 4 (Autumn 2018) 61
Minsker, L., “Influence of flow regime on mass transfer in different types of
microchannels”, Ind. Eng. Chem. Res.,
50 (11), 6906 (2011).
[10]Boogar, R. S., Gheshlaghi, R. and
Mahdavi, M. A., “The effects of viscosity, surface tension, and flow rate on gasoil-water flow pattern in
microchannels”, Korean J. Chem. Eng.,
30 (1), 45 (2013).
[11]Coleman, J. W. and Garimella, S.,
“Characterization of two-phase flow patterns in small diameter round and
rectangular tubes”, Int. J. Heat Mass
Transfer, 42 (15), 2869 (1999).
[12]Basiri, M., Rahimi, M. and Mohammadi,
F., “Investigation of liquid-liquid two-phase flow pattern in microreactors for
biodiesel production”, Iranian J. Chem.
Eng., 12 (3), 33 (2015).
[13]Plouffe, P., Roberge, D. M. and Macchi,
A., “Liquid-liquid flow regimes and mass transfer in various micro-reactors”,
Chem. Eng. J., 300, 9 (2016).
[14]Keshav, A., Wasewar, K. L. and Chand,
S., “Extraction of propionic acid using different extractants (tri-n-butylphosphate, tri-n-octylamine, and
Aliquat 336)”, Ind. Eng. Chem. Res., 47
(16), 6192 (2008).
[15]Aşçı, Y. S. and İnci, İ., “Extraction
equilibria of propionic acid from aqueous solutions by Amberlite LA-2 in diluent
solvents”, Chem. Eng. J., 155 (3), 784
(2009).
[16]Keshav, A., Wasewar, K. L. and Chand,
S., “Extraction of propionic acid with
tri-n-octyl amine in different diluents”, Sep.
Purif. Technol., 63 (1), 179 (2008).
[17]Uslu, H., “Reactive extraction of formic
acid by using Tri Octyl Amine (TOA) ”,
Sep. Sci. Technol., 44 (8), 1784 (2009).
[18]Ghalami-Choobar, B., Ghanadzadeh, A.
and Kousarimehr, S., “Salt effect on the liquid-liquid equilibrium of (water+ propionic acid+ cyclohexanol) system at
T=(298.2, 303.2, and 308.2) K”, Chin. J.
Chem. Eng., 19 (4), 565 (2011).
[19]Dan, W., Hao, C., Jiang, L., Jin, C.,
Zhinan, X. and Peilin, C., “Efficient separation of butyric acid by an aqueous two-phase system with calcium
chloride”, Chin. J. Chem. Eng., 18 (4),
533 (2010).
[20]İnce, E. and Aşçı, Y. S., “(Liquid+liquid)
equilibria of the (water+carboxylic acid+dibasic esters mixture (DBE-2))
ternary systems”, Fluid Phase Equilib.,
370, 19 (2014).
[21] Zhao, Y., Chen, G. and Yuan, Q.,
“Liquid-liquid two-phase mass transfer
in the T-junction microchannels”, AIChE
J., 53 (12), 3042 (2007).
[22]Kashid, M., Harshe, Y. and Agar, D.,
“Liquid-liquid slug flow in a capillary: An alternative to suspended drop or film
contactors”, Ind. Eng. Chem. Res., 46
(25), 8420 (2007).
[23]Zhao, Y., Chen, G. and Yuan, Q.,
“Liquid-liquid two-phase flow patterns in
a rectangular microchannel”, AIChE J.,
52 (12), 4052 (2006).
[24]Assmann, N. and von Rohr, P. R.,
“Extraction in microreactors: Intensification by adding an inert gas
phase”, Chem. Eng. Process., 50 (8), 822
(2011).
[25]Tsaoulidis, D., Dore, V., Angeli, P.,
Plechkova, N. V. and Seddon, K. R., “Dioxouranium(VI) extraction in microchannels using ionic liquids”,
Chem. Eng. J., 227, 151 (2013).
[26]Jovanović, J., Rebrov, E. V., Nijhuis, T.
62 Iranian Journal of Chemical Engineering, Vol. 15, No. 4 (Autumn 2018)
Schouten, J. C., “Liquid-liquid flow in a capillary microreactor: Hydrodynamic
flow patterns and extraction
performance”, Ind. Eng. Chem. Res., 51
(2), 1015 (2012).
[27]Azimi, N., Rahimi, M. and Abdollahi,
N., “Using magnetically excited
nanoparticles for liquid–liquid two-phase mass transfer enhancement in a Y-type
micromixer”, Chem. Eng. Process., 97,
12 (2015).
[28]Mondal, P., Ghosh, S., Das, G. and Ray,
S., “Phase inversion and mass transfer during liquid-liquid dispersed flow
through mini-channel”, Chem. Eng.
Process, 49 (10), 1051 (2010).
[29]Biswas, K. G., Das, G., Ray, S. and
Basu, J. K., “Mass transfer characteristics of liquid-liquid flow in
small diameter conduits”, Chem. Eng.