[Sulaiman* 6(8): August, 2019] ISSN 2349-4506
Impact Factor: 3.799
G
lobal
J
ournal of
E
ngineering
S
cience and
R
esearch
M
anagement
OPTIMAL FREQUENCY DESIGN OF EDDY CURRENT TESTING FOR COPPER,
BRASS AND MAGNESIUM ALLOY METAL WITH DIFFERENCE THICKNESS
Fauziah Sulaiman*, Elya Alias, Abu Bakar Abdul Rahman, Salmia Santa, Elnetthra Folly Eldy
*Physics with Electronics Program, Faculty Science and Natural Resources, Universiti Malaysia
Sabah,Jalan UMS, 88400 Kota Kinabalu
Preparatory of Science and Technology Centre Universiti Malaysia Sabah,Jalan UMS, 88400 Kota
Kinabalu
DOI: 10.5281/zenodo.3372507
KEYWORDS
:
Results for Nondestructive Test of Metal Imperfection of Copper (Cu) Metal, Results for Nondestructive Test of Metal Imperfection of Brass Metal.ABSTRACT
The main objective of this paper is to find the optimisation frequency for a designed non-destructive testing (NDT) metal instrument known as eddy current testing (ECT). The chosen materials were copper (Cu), brass and magnesium alloy (Mg) metals in 100 mm X 100 mm dimension, and with different type of thickness, i.e. 1.5 mm, 3 mm and 5 mm. All of the three (3) different kind of thicknesses in each metal were installed with artificial defect and were tested to identify the optimal frequency. A dual-sensors were designed and established to gather the voltage output with input frequencies were ranged between 250 kHz - 3.5 MHz. The output signals of the voltage of testing from the sensor circuit then compared to analyse the optimal of range frequency for the testing instrument. The result of this research showed that the non-destructive metal testing instrument of dual-sensors by using ECT method can be used to find different defect for these metals, i.e. copper (Cu), brass and magnesium alloy (Mg). The optimal frequencies for copper was 2.95 𝑀𝐻𝑧, brass was
2.90 𝑀𝐻𝑧 and magnesium was 2.89 𝑀𝐻𝑧. The categorisation of thickness on metal for the ECT instrument is suitable at 2.95 𝑀𝐻𝑧 for copper, 2.90 𝑀𝐻𝑧 for brass and 2.89 𝑀𝐻𝑧 for magnesium alloy, which also known as the optimal frequency.
INTRODUCTION
EDDY current technique is an important electromagnetic of non-destructive technique (NDT) evaluation that is widely used in many industries for detection of surface cracks and corrosion in components made of metallic materials.1 One reason for this is that general purposes, user-friendly eddy current instruments are a
relatively recent phenomenon.2 There are some advantages on using eddy currents for NDT purposes. It is
quick, simple, and reliable inspection technique to detect surface and near-surface defects. Besides, it is also can be used to perform several tasks like thickness measurements, electrical corrosion valuation, and magnetic permeability measurements.3 There is no need for consumables and the inspection surface preparation is
minimal and results are drawn immediately.
Eddy current could be made by high frequency magnetic field. The magnetic field happens when high frequency alternating current enters primary or transmitter coil.4 In case there is continuous space inside the
test material, the eddy current will be higher. The eddy current will be lower if there are no continuous space inside the test material.5 This different could be used to measure the continuity of the test material by using
eddy current.
In this method, the current in the coil that constitute the probe induces eddy currents in the test material based on the basic principle of electromagnetic induction.6 When a crack interrupts the eddy current flow, the result
is change of the coil impedance, by measuring these impedance changes or by measuring a resultant magnetic field using a coil sensor it is possible to detect the cracks in the test material.
[Sulaiman* 6(8): August, 2019] ISSN 2349-4506
Impact Factor: 3.799
G
lobal
J
ournal of
E
ngineering
S
cience and
R
esearch
M
anagement
adjust the frequency is proposed for this research. Finally, this paper will summarise the output in the last section.
PROPOSED DESIGN AND ANALYSIS
To obtain optimum frequency by testing artificial imperfections on some selected metals, i.e. copper, brass and magnesium alloy. In this research, the artificial imperfections of 7 𝑚𝑚, 14 𝑚𝑚 and 21 𝑚𝑚 that installed on the 1.5 𝑚𝑚, 3 𝑚𝑚, and 5 𝑚𝑚 metal thickness accordingly will be tested for each of the selected metals. In designing the metal testing instrument, the coil sensor needs to design first. In order to improve the sensitivity of the coil, it should have large number of turns (N) and large active area (A).7 In this research the
turn number of coil of the sensor and the diameter of the sensor is emphasized with the total of 100 𝑡𝑢𝑟𝑛𝑠 of excitation coils while receiver coil has 80 𝑡𝑢𝑟𝑛𝑠 and diameter in 2 𝑐𝑚 width. In this experiment two (2) sensors has been used which are called as excitation and receiver coil.8 The Figure 2.1 shows the sensor
design of excitation-receiver sensor.
Figure 2.1 The excitation-receiver sensor. Figure 2.2 The schematic circuit of instrument amplifier.
The induction coil sensor also known as coil sensor is one of the oldest and well-known magnetic sensors. Its transfer function V = f(B) results from the fundamental Faraday’s law of induction
(1)
where Φ is the magnetic flux passing through a coil with an area A and a number of turns n.9 Inductive coil
will use an electrical load. Electrical current which runs through coil would induct because magnetic lines of force took place inside inductive coil.10 Voltage drop for inductive coil from circuit could be calculated by
the following equation:
(2)
When sensor circuit is used to test imperfection of metal, sensor circuit will be brought closer to metal. The inductance value of the coil would change. This change is due to various reasons like metal type, size of imperfection, distance and oscillator frequency.11 Thus, inductance value of sensor changed differently. The
function generator is the most suitable for finding the optimisation frequency.12 The function generators are
very versatile instruments as they are capable of producing a wide variety of waveform and frequencies.13In
order to make the design more accurate the instrument amplifier was designed. Instrumentation amps excel at extracting very weak signals from noisy environments. Thus, they are often used in circuits that employ sensors that take measurements of physical parameters. It has high gain electronic voltage amplifier with differential input and, usually, a single-ended output. The output voltage is many times higher than the voltage difference between input terminals.14 It has a specific role in circuits needing the advantages of high input
impedance with good gain while providing common mode noise rejection and fully differential inputs. Figure 2.2 shows the schematic circuit of the instrument amplifier.
dt dH A n dt dB A n dt d n
V . . . 0. . .
[Sulaiman* 6(8): August, 2019] ISSN 2349-4506
Impact Factor: 3.799
G
lobal
J
ournal of
E
ngineering
S
cience and
R
esearch
M
anagement
EXPERIMENTAL SETUP
The purposes of this research were to find an optimal frequency for the metal testing instrument in imperfection metal testing and to categorise the thickness of metals by using eddy current method. The instrument consists of a function generator, sensor coil (100 turns; excitation and receiver coil), three different types of metal such brass, copper and magnesium alloy, multimeter, DC/AC power supply and the instrument amplifier.
In this research, copper (Cu), brass and magnesium alloy (Mg alloy) with the dimension of 100mm x 100mm will be tested for imperfections that cover three (3) various thickness, i.e., 1.5 𝑚𝑚, 3 𝑚𝑚, and 5 𝑚𝑚. Each metal was installed with the same diameter and depth of defect. The diameter of imperfection is 7 𝑚𝑚,
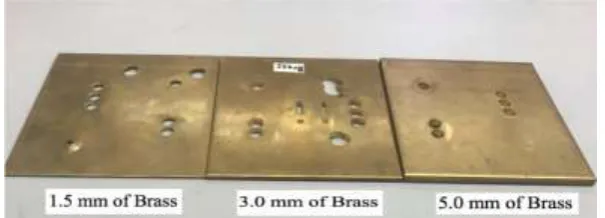
14 𝑚𝑚, and 21 𝑚𝑚 in each of metals. Figure 3.1 shows the artificial defect and different type of thickness on the Brass.
The function generator will be connected with the exciter coil with frequency signal range between 250 𝑘𝐻𝑧
to 3.5 𝑀𝐻𝑧. The pulsed excitation causes a rapid change in the surrounding magnetic field, this in turn induces eddy currents in the test piece being assessed. The block diagram of the testing instrument is shown in Figure 3.2.
. Figure 3.1 The artificial defect on metal (i.e. Brass) with different kind of thickness.
Figure 3.2 The block diagram of testing instrument.
EXPERIMENTAL RESULT
The result for this experiment in metal testing instrument for imperfection metal by using eddy current method. Sample of copper (Cu), Brass and magnesium alloy (Mg Alloy) with thickness of 1.5 𝑚𝑚, 3 𝑚𝑚, and 5 𝑚𝑚 was drilled with different of width on the surface (7 𝑚𝑚, 14 𝑚𝑚, 21 𝑚𝑚). The frequency used was between 250 𝑘𝐻𝑧 − 3.5 𝑀𝐻𝑧 and then the output signals were plotted in a graph to compare the differences of imperfection. Mengbao Fan proposed that the suitable frequency range about 50 𝑘𝐻𝑧 − 6𝑀𝐻𝑧.15
4.1 Results for Nondestructive Test of Metal Imperfection of Copper (Cu) Metal.
[Sulaiman* 6(8): August, 2019] ISSN 2349-4506
Impact Factor: 3.799
G
lobal
J
ournal of
E
ngineering
S
cience and
R
esearch
M
anagement
Figure 4.1 The output voltage imperfection of Copper (1.5 mm).
Figure 4.2 The output voltage imperfection of Copper (3.0 mm).
Figure 4.3 The output voltage imperfection of Copper (5.0 mm).
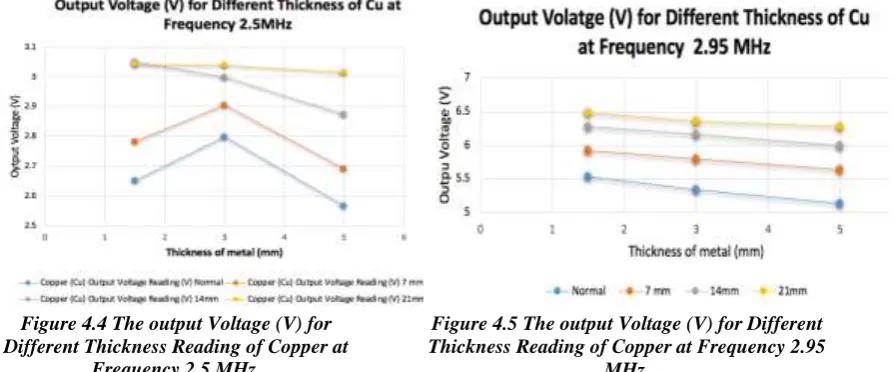
Next one was the non-destructive testing for categorising the thickness of the Cu metal by using eddy current method. From Figure 4.4 shows the output signal take on the frequency of 2.5 𝑀𝐻𝑧 2.5 MHz and Figure 4.5 shows the output signals take on the frequency of 2.95 𝑀𝐻𝑧 as known as the optimisation for the Cu metal for this metal instrument. As general knowledge known that the thicker the metal the less sensitivity can be reached from the reading output voltage.16
Figure 4.4 The output Voltage (V) for Different Thickness Reading of Copper at
Frequency 2.5 MHz.
Figure 4.5 The output Voltage (V) for Different Thickness Reading of Copper at Frequency 2.95
[Sulaiman* 6(8): August, 2019] ISSN 2349-4506
Impact Factor: 3.799
G
lobal
J
ournal of
E
ngineering
S
cience and
R
esearch
M
anagement
4.2 Results for Nondestructive Test of Metal Imperfection of Brass Metal.From Figure 4.6, 4.7 and 4.8 shows that the reading for the metal imperfection experiment with all the three different thickness shows that optimum frequency for the brass metal is at 2.75 𝑀𝐻𝑧.
Figure 4.6 The output voltage imperfection of Brass (1.5 mm)
Figure 4.7 The output voltage imperfection of Brass (3.0 mm).
Figure 4.3 The output voltage imperfection of Brass (5.0 mm).
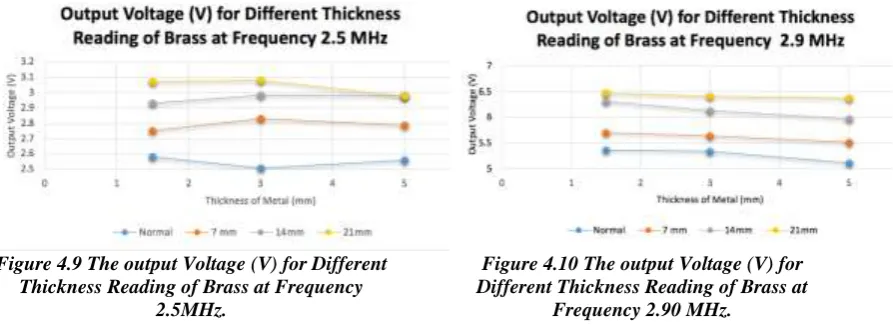
Next one was the non-destructive testing for categorising the thickness of the brass metal by using eddy current method. From Figure 4.9 shows the output signal take on the frequency of 2.5 𝑀𝐻𝑧 and Figure 4.10 shows the output signals take on the frequency of 2.90 𝑀𝐻𝑧 as known as the optimisation for the brass metal for this metal instrument. As general knowledge known that the thicker the metal the less sensitivity can be reached from the reading output voltage.16
Figure 4.9 The output Voltage (V) for Different Thickness Reading of Brass at Frequency
2.5MHz.
Figure 4.10 The output Voltage (V) for Different Thickness Reading of Brass at
[Sulaiman* 6(8): August, 2019] ISSN 2349-4506
Impact Factor: 3.799
G
lobal
J
ournal of
E
ngineering
S
cience and
R
esearch
M
anagement
4.3 Results for Nondestructive Test of Metal Imperfection of Magnesium Alloy (Mg Alloy) Metal.
From Figure 4.11, 4.12 and 4.13 shows that the reading for the metal imperfection experiment with all the three (3) different thickness shows that optimum frequency for the Mg Alloy metal is 2.89 𝑀𝐻𝑧.
Figure 4.11 The output voltage imperfection of Mg Alloy (1.5 mm).
Figure 4.12 The output voltage imperfection of Mg Alloy (3.0 mm).
Figure 4.13 The output voltage imperfection of Mg Alloy (5.0 mm).
Next one was the non-destructive testing for categorising the thickness of the Mg Alloy metal by using eddy current method. From Figure 4.14 shows the output signal take on the frequency of 2.5 𝑀𝐻𝑧 and 4.15 shows the output signals take on the frequency of 2.89 𝑀𝐻𝑧 as known as the optimisation for the Titanium (Ti) metal for this metal instrument. As general knowledge known that the thicker the metal the less sensitivity can be reached from the reading output voltage.16
Figure 4.14 The output Voltage (V) for Different Thickness Reading of Mg Alloy at Frequency 2.5MHz.
Figure 4.15 The output Voltage (V) for Different Thickness Reading of Mg Alloy at Frequency 2.89MHz.
Zhenguo Sun proposed that the optimal frequency is 0.9 𝑀𝐻𝑧 at which maximum probe signals are collected, should vary with the size of defects.17 From this research, it shows that the optimal frequency from 2.5 𝑀𝐻𝑧
[Sulaiman* 6(8): August, 2019] ISSN 2349-4506
Impact Factor: 3.799
G
lobal
J
ournal of
E
ngineering
S
cience and
R
esearch
M
anagement
This finding implies that we cannot simultaneously acquire all the types metal for different size defects at a single frequency. We also note that output voltage signals change significantly after reach of the peak, and decrease slightly afterwards also the reading became unstable.
CONCLUSION
As a conclusion, this research has developed and established an optimal frequency in strengthen the metal testing instrument that has been designed by using eddy current method. First is by test the imperfection of the defect on three (3) types of metal by using frequency around 250 𝑘𝐻𝑧 − 3.5 𝑀𝐻𝑧 which is copper (Cu), the optimal frequency is at 2.95 𝑀𝐻𝑧, brass the optimal frequency is at 2.90 𝑀𝐻𝑧, and magnesium alloy (Mg) is at 2.89 𝑀𝐻𝑧. Secondly, the test of three different types of thickness, i.e., 1.5 𝑚𝑚, 3 𝑚𝑚 and 5 𝑚𝑚
on the three materials, i.e., copper (Cu), brass and magnesium alloy (Mg) metals also by using frequency around 250 𝑘𝐻𝑧 − 3.5 𝑀𝐻𝑧. It was found that the optimal frequency for categorise thickness of the copper is at 2.95 𝑀𝐻𝑧, brass is at 2.90 𝑀𝐻𝑧 and Magnesium is at 2.89 𝑀𝐻𝑧 the most obvious output voltage that stated the more thicker the metal the less sensitive of the output voltage reading and it was suitable for this kind of test.
ACKNOWLEDGMENTS
This work was supported in part by
i. UMSGreat Grant: GUG0018-SG-M1/2016, and ii. SBK Grant: 0280-SG-2016.
REFERENCES
1. T. J. Rocha, H. G. Ramos, A. L. Ribeiro, D. J. Pasadas, C. S. Angani. Studies to Optimize the Probe Response for Velocity Induced Eddy Current Testing in Aluminium,Measurement 67, 108-115
(2015).
2. M. Fan, Q. Wang, B. Cao, B. Ye, A. I. Sunny and G. Tian. Frequency Optimization for Enhancement of Surface Defect Classification Using the Eddy Current Technique, 16, 649 (2016).
3. J.García-Martín, J. Gómez-Gil and E. Vázquez-Sánchez. review paper Non-Destructive Techniques Based on Eddy Current Testing, 11, 2525-2565 (2011).
4. G.Betta, L.Ferrigno, M.Laracca, P. Burrascano, M. Ricci and G. Silipigni. An experimental comparison of multi-frequency and chirp excitations for eddy current testing on thin defects, Vol 4, No1, 128–134 (2015).
5. H.T. Zhou, K. Hou, H.L. Pan, J.J. Chen, and Q.M. Wang. Study on the Optimization of Eddy Current Testing Coil and the Defect Detection Sensitivity, 130, 1649-1657(2015).
6. N.Dholu, J. R. Nagel, D. Cohrs and R. K. Rajamani. Eddy Current Separation of Nonferrous Metals Using a Variable-Frequency Electromagnet, 34, 241-247 (2017).
7. S.Tumanski. Induction Coil Sensors – a Review, Meas. Sci. Technol. 18 , R31–R46 (2007). 8. D. Pereira and T. G. R. Clarke. Modeling and Design Optimization of an Eddy Current Sensor for
Superficial and Subsuperficial Crack Detection in Inconel Claddings, IEEE Sensors Journal, Volume: 15, Issue: 2, 1287 - 1292 (2015).
9. S. Tumanski. Induction Coil Sensors – a Review, Meas. Sci. Technol. 18 , R31–R46 (2007). 10. N. Mungkung, K. Chomsuwan, N. Pimpru, and T.Yuji. Optimization Frequency Design of Eddy
Current Testing, ELECTROSCIENCE'07 Proceedings of the 5th conference on Applied electromagnetics, wireless and optical communications, 127-131 (2007).
11. L.Dziczkowski. Effect of Eddy Current Frequency on Measuring Properties of Devices used in Non-Destructive Measurement of Non-Ferromagnetic Metal Plates,Volume 32 Issue 2, 77-84 (2008). 12. R. S. Kushwah. Function Generator, http://ei-notes. blogspot.my/2012/03/function-generator.html,
(2012).
13. A. H. Tirmare, S. R. Mohite, P.S. Mali, Mrs V.A.Suryavanshi. FPGA Based Function Generator,
(2015).
[Sulaiman* 6(8): August, 2019] ISSN 2349-4506
Impact Factor: 3.799
G
lobal
J
ournal of
E
ngineering
S
cience and
R
esearch
M
anagement
15. M. Fan, Q. Wang, B. Cao, B.Ye, A. I. Sunny and G. Tian. Frequency Optimization for Enhancement of Surface Defect Classification Using the Eddy Current Technique, 16, 649 (2016).
16. N. Mungkung, K. Chomsuwan, N. Pimpru, and T.Yuji. Optimization Frequency Design of Eddy Current Testing, ELECTROSCIENCE'07 Proceedings of the 5th conference on Applied electromagnetics, wireless and optical communications, 127-131 (2007).
17. Z. Sun, D. Cai, C. Zou, W. Zhang and Q. Chen.A Flexible Arrayed Eddy Current Sensor for Inspection of Hollow Axle Inner Surfaces,16, 952 (2016).