International Journal of Advances in Engineering Research http://www.ijaer.com
(IJAER) 2017, Vol. No. 13, Issue No. I, January e-ISSN: 2231-5152, p-ISSN: 2454-1796
STUDY OF DIVERSITY SCHEMES FOR LEADLESS
PACEMAKER SYSTEM USING MOLECULAR
COMMUNICATION
1
Bhagyashree Swain
Guided by: Dr. Anand S
1
M-Tech, Dept. of Communication Engineering, VIT University,
Vellore, India
ABSTRACT
Intrabody communication is an emerging research area. One of the novel approaches for intrabody communication is Molecular communication. The communication system model being introduced in this paper is a leadless pacemaker system using the concepts of molecular communication for treating heart related diseases. A concentration model of the flow of molecules within the heart is develop considering the case of pheromone based communication. Diversity schemes such as SISO, SIMO, and MIMO are applied to study their effects and declare a suitable communication model for leadless pacemakers. Performance parameters such a effective signalling rate, the bit error rate, inter-symbol interference are considered to arrive at a conclusion.
Keywords:Molecular Communication, leadless pacemakers, diffusion, pheromone communication, diversity schemes
INTRODUCTION
International Journal of Advances in Engineering Research http://www.ijaer.com
(IJAER) 2017, Vol. No. 13, Issue No. I, January e-ISSN: 2231-5152, p-ISSN: 2454-1796
communication within the body in comparison to electromagnetic or RF communication due to its bio- compatibility [3]. Molecular communication also provides communication possibility in aqueous or fluidic medium like blood and water. The molecular movement amongst these nanomachines is defined using the Brownian motion model [6]. There are a few issues also which are being studied for molecular communication as well. Some of them include slow propagation speed and higher vulnerability to noise [6].
The human heart is divided into 4 parts, the right atrium, the right ventricle, the left ventricle and the left atrium. The natural pacing of the heart occurs when the electrical signals from the sinus node reach all the heart muscles, due to which the contraction of the heart occurs and the blood flow occurs. The blood flow within the heart is of turbulent diffusion type since blood flow within the heart is very quick. To consider the flow of molecules within the heart, the concept of pheromone communication used for communication among plants is considered. In pheromone communication, the alarm molecules or chemicals are bonded along with the carrier molecules which carry this information carrying molecules from the transmitter to the receiver.
The Fig.1. shows a molecular communication system model consisting of three parts i.e., the transmitter, the diffusion channel for the molecules to be transmitted in, and the receiver unit. The rest of the paper is divided as follows. In section 2 the system model of the proposed system is explained in detail, in section 3 the various diversity schemes are applied on the system to check for any improvement in functionality of the system, in section 4 the results are discussed and in section 5 the conclusion is arrived upon.
Figure 1. Molecular communication system illustration
EXPERIMENTAL DETAILS
A. System Model
International Journal of Advances in Engineering Research http://www.ijaer.com
(IJAER) 2017, Vol. No. 13, Issue No. I, January e-ISSN: 2231-5152, p-ISSN: 2454-1796
flow velocity in the right ventricle is taken as the blood flow velocity of the Inferior and Superior Vena Cava which has an average value of 15 cm/s. Here a constant blood flow velocity assumption is made. The pacemaker distance from the closest wall of the heart is set to 7.5mm. Also, the number of molecules emitted is set to an arbitrary value of 500.
B. Performance Analysis
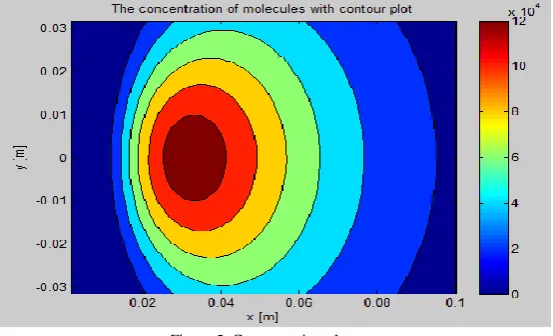
The performance analysis was carried out using the concentration model. Using the concept of diffusion, the concentration is dispersed over time and distance. To simplify the analysis, a reference direction for the blood flow is defined in the x-axis, a cylindrical region is defined for the blood flow from the transmitter and the receiver which are assumed to be placed one above the other as shown in Fig.3.
The plot of the molecular concentration is then plotted in terms of time and distance.
Fig.2. System Model of the proposed pacemaker
International Journal of Advances in Engineering Research http://www.ijaer.com
(IJAER) 2017, Vol. No. 13, Issue No. I, January e-ISSN: 2231-5152, p-ISSN: 2454-1796
In the next step, the stochastic SISO system is modelled by transmitting Qj number of molecules
which are random for every signaling interval. The encoder of the system is designed as On- Off keying type. The OOK Modulation is a very apt modulation technique for communication among nanodevices. Here, if the input signal is 1, then the molecules are transmitted and if the input signal is 0, then the molecules are transmitted, depicting silence. The binary hypothesis testing is applied to find the probability of detection and probability of false alarm. This is depicted in Fig.4.
Fig.4. The binary hypothesis testing channel
The detector is designed based on the lines of Information theory approach, using the maximum mutual information. Based on this a optimal detection threshold is decided regarding sending or not sending of molecules. The equation below defines the mutual information.
𝐼 𝑋𝑖, 𝑌𝑖 = 1𝑋𝑖 =0 1𝑌𝑖=0𝑃 𝑌𝑖 | 𝑋𝑖 𝑃(𝑋𝑖)log𝑃(𝑌𝑖,𝑋𝑖)
𝑃(𝑌𝑖) (1)
The probability 𝑃 𝑌𝑖 | 𝑋𝑖 is defined using the binary hypothesis testing.
𝑃 𝑌𝑖 = 1 𝑋𝑖 = 0) = 𝑃𝐹 (2)
𝑃 𝑌𝑖 = 1 𝑋𝑖 = 1) = 𝑃𝐷(3)
𝑃 𝑌𝑖 = 0 𝑋𝑖 = 0) = 1 − 𝑃𝐹(4)
𝑃 𝑌𝑖 = 0 𝑋𝑖 = 1) = 1 − 𝑃𝐷(5)
The molecules are sent with a priori probability of 𝑃 𝑋𝑖 = 𝑝1. Thus, the probability 𝑃 𝑌𝑖 is given
as,
𝑃 𝑌𝑖 = 1𝑋𝑖 =0𝑃 𝑌𝑖 | 𝑋𝑖 𝑃(𝑋𝑖) (6)
It has been proved that the mutual information I is a monotonically increasing function of 𝑃𝐷 for a given value of 𝑃𝐹. The Newman Pearson detector is used to calculate the optimal detection using the Maximum likelihood test. The expressions for false alarm probability and detection probability are derived as
𝑃𝐹 = 𝑝 𝑍𝑖; 𝐻𝑜 𝑑𝑧 = 𝑄
𝜂 − 𝜇𝑍𝑜 𝜎𝑍𝑜 ∞
𝜂 (7)
𝑃𝐷 = 𝑝 𝑍𝑖; 𝐻1 𝑑𝑧 = 𝑄
𝜂 − 𝜇𝑍1 𝜎𝑍1 ∞
𝜂 (8)
The maximum value of the threshold is found by taking the argument of the maximum mutual information
𝜂𝑜𝑝𝑡 𝑝1 = 𝑎𝑟𝑔max
International Journal of Advances in Engineering Research http://www.ijaer.com
(IJAER) 2017, Vol. No. 13, Issue No. I, January e-ISSN: 2231-5152, p-ISSN: 2454-1796
Also, the a priori probability can be controlled by receiver and its maximum value can be obtained.
𝑝1∗ 𝜂 = 𝑎𝑟𝑔max
𝑝1
𝐼(𝑃𝐹 𝜂𝑜𝑝𝑡(𝑝1) , 𝑃𝐷 𝜂𝑜𝑝𝑡(𝑝1) , 𝑝1) (10)
The performance parameters tested were the maximum mutual information, the optimal signaling interval, the bit error rate, and the inter-symbol interference. In case of SISO, the distance between the transmitter and receiver is set to 0.03m. In the case of SIMO system, one transmitter and two receiver units are considered, wherein, the second receiver is at a farther distance from the transmitter in comparison to the first receiver. The distances are set to values of 0.03m and 0.04m respectively. For the MIMO scheme, two transmitter units and receiver units are considered. The distance between the 1st transmitter and the 1st receiver, 2nd transmitter and 2nd receiver is 0.02. The distance between the 1st transmitter and 2nd receiver, and 2nd transmitter and 1st receiver is 0.03m.
RESULTS AND DISCUSSION
A. Deterministic SISO Scheme
MATLAB R2015 was used to simulate the model proposed. The concentration plot of the molecules spreading out in time and distance is first arrived at, shown in Fig.5. Here the darker shades at the center depict more molecule concentration near the transmitter unit and gradually the molecules spread out towards the receiver, and the concentration reduces due to noises and absorption that may occur in the channel path.
Figure 5. Concentration plot
International Journal of Advances in Engineering Research http://www.ijaer.com
(IJAER) 2017, Vol. No. 13, Issue No. I, January e-ISSN: 2231-5152, p-ISSN: 2454-1796
evens out; this is because diffusion reaches equilibrium when the dispersion of molecules is equally distributed at all distances.
Fig.6. Delay vs. distance for Deterministic SISO system
Fig.7. Gain Vs. Distance for Deterministic SISO System
Fig.8. Concentration Vs. Time for varying values of distances for Deterministic SISO system.
B. Stochastic Diversity Schemes
International Journal of Advances in Engineering Research http://www.ijaer.com
(IJAER) 2017, Vol. No. 13, Issue No. I, January e-ISSN: 2231-5152, p-ISSN: 2454-1796
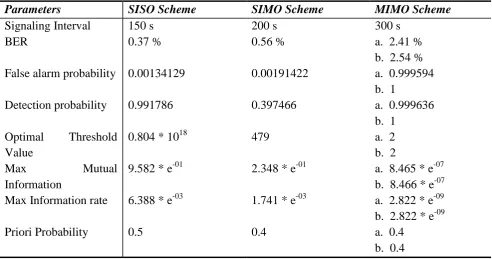
lowest value of 10s to highest of 500s, the most optimal signaling interval for the case is decided. For the SISO scheme, this value is decided to be 150 seconds, for SIMO it is 200 seconds, and for MIMO, this value is 300 seconds. As a general case, it was observed that the ISI and the bite error rate decreased as there was an increase in the signaling interval. The Table 1 consolidates all the results obtained for the signaling intervals.
It was observed that contrary to the general belief that increasing the diversity leads to an improvement in the system parameters, the proposed system saw a degradation in the performance parameters. Specially in the case of MIMO system, the inter-symbol interference was more in comparison to SISO and SIMO systems. The bit error rate was 2.41% in comparison to the 0.37% and 0.56% in case of SISO and SIMO respectively. The false alarm probability is the least in the case of SISO system, also the Detection probability is more. One of the reasons for the MIMO system with spatial diversity not being apt for this model is due to the channel which is of diffusion type, due to which the noise along the various paths increases.
Table I. Comparison of parameters for SISO, SIMO and MIMO Scheme
Parameters SISO Scheme SIMO Scheme MIMO Scheme
Signaling Interval 150 s 200 s 300 s
BER 0.37 % 0.56 % a. 2.41 %
b. 2.54 % False alarm probability 0.00134129 0.00191422 a. 0.999594
b. 1
Detection probability 0.991786 0.397466 a. 0.999636 b. 1
Optimal Threshold Value
0.804 * 1018 479 a. 2
b. 2
Max Mutual
Information
9.582 * e-01 2.348 * e-01 a. 8.465 * e-07 b. 8.466 * e-07 Max Information rate 6.388 * e-03 1.741 * e-03 a. 2.822 * e-09 b. 2.822 * e-09
Priori Probability 0.5 0.4 a. 0.4
b. 0.4
CONCLUSIONS
International Journal of Advances in Engineering Research http://www.ijaer.com
(IJAER) 2017, Vol. No. 13, Issue No. I, January e-ISSN: 2231-5152, p-ISSN: 2454-1796
ACKNOWLEDGMENT
I would like to acknowledge my guide Dr. Anand S, Associate Professor, VIT University, Vellore for his continuous guidance due to which this project was completed. I would also like to acknowledge the Department of Communication Engineering (SENSE), VIT University for providing the necessary resources for the fulfillment of this work.
REFERENCES
[1] I.F. Akyilidiz, J.M Jornet, “The internet of nanothings”, IEEE Wireless Communication
Magazine, 17(6), December 2016.
[2] T. Nakano, “Molecular Communiaction and networking: Opportunities and challenges”, IEEE
transaction on NanoBioscience, Vol11(2), pp 135- 148, June 2012.
[3] B. Atakan, O.B Akan, S. Balasubramaniam, “Body area nanonetworks with molecular
communications in nanomedicine, IEEE communications magazine, January 2012.
[4] S. Kadloor, R. Adve, A. Eckford, “Molecular Communication using brownian motion with
drift”, IEEE transaction on NanoBioscience, 11(2), pp 89- 99, June 2012.
[5] M. Pierobon, I.F. Akyilidiz, “Noise analysis in ligand binding reception for molecular
communication in nanonetworks” IEEE transaction on signal processing, 59(9), pp 4168-4182, September 2011.
[6] M. Pierobon, I.F. Akyilidiz, “Diffusion based noise analysis for molecular communication
networks”, IEEE transaction on signal processing, 59(6), pp 2532- 2547, June 2011.
[7] M. Pierobon, I.F. Akyilidiz, “Capacity of diffusion based molecular communication system with
channel memory and molecular noise”, IEEE transaction on information theory, 59(2), pp 942- 954, Feb 2013.
[8] J. Tan, A. Thomas, Y. Liu, “Influence of red blood cells on nanoparticle targeted delivery in
microcirculation”, Soft matter, pp 1934- 1946, Vol. 8, 2012.
[9] F. Gentile, M. Ferrari, P. Decuzzi, “The transport of nanoparticles in blood vessels: the effect of
vessel permeability and blood rheology”, Annals of Biomedical Engineering, 36(2), pp 254- 261, 2008
[10] D. Gidaspow, J. Huang, “kinetic theory based model for blood flow and its viscosity”, Annals of