IJPAR |Vol.6 | Issue 4 | Oct - Dec -2017
Journal Home page: www.ijpar.com
Research article Open Access
Method development and validation of simultaneous estimation of
miconazole and metronidazole in tablet dosage form RP-HPLC method
B.Jyothsna*
1, V. Swapna
1 1Chilkur Balaji College of Pharmacy, Aziz Nagar (V), HYD- 500075, Telangana, India.
*Corresponding Author: B.JyothsnaEmail: [email protected]
ABSTRACT
A new simple, accurate, precise isocratic high performance liquid chromatographic (HPLC) method was developed and validated for the determination of miconazole and metronidazole in tablet formulation. The optimized conditions comprise of column C18,150mmx4.6, 5 m particle size with a flow rate of 1.0 mL/min, Mobile Phase: 0.1%OPA: Methanol (75:25) mixture was used at a detection wavelength 268 nm. Retention times of miconazole and metronidazole were found to be 2.87min, and 3.75 min respectively. The method was validated in terms of linearity, accuracy, precision, specificity, LOD and LOQ. The LOD values of miconazole and metronidazole were found to be 0.01 and 0.014 µg/mL, LOQ’s were found to be 0.03 and 0.04µg/mL respectively. Method is linear in the range of 50 to 150%. This new method was successfully developed and validated as per ICH guidelines, can be utilized for the quantitative estimation of miconazole and metronidazole pharmaceutical dosage forms.
Keywords: Miconazole, Metronidazole, RP-HPLC, Validation, Simultaneous estimation.
INTRODUCTION
Methods are developed for new products when no official methods are available. Alternate methods for existing products are developed to reduce the cost and time for better precision and ruggedness. Trail runs are conducted, method is optimized and validated.
Existing literature reveals that Miconazole and Metronidazole can be analyzed by UV detection, HPTLC, HPLC individually and combination with
methods for analysis of combination of Miconazole and Metronidazole tablets validated.
The objective of the present work is to develop and validate a HPLC method for combination dosage of Miconazole and Metronidazole tablets. To be employed in routine analysis. In the method development of Miconazole and Metronidazole we have decided to carry out our project work by incorporating the Reverse phase High performance Liquid chromatography (HPLC).Then the developed method will be validated according to ICH guidelines for its various parameters.
DRUG PROFILE
Miconazole
Antifungal Agents
14-alpha Demethylase Inhibitors
Molecular formula : C18H14Cl4N2O
Molecular Weight : 416.129
Solubility: Freely soluble in methanol, slightly soluble in 95%ethonol, very slightly soluble in water
Pka: 6.77
Metronidazole
Antiprotozoal Agents
Anti-Infective Agents
Molecular formula : C6H9N3O3 Molecular Weight : 171.15
in ethyl alcohol, 0.5g/100mL; in chloroform, 0.4g/100mL; slightly soluble in ether and soluble in dilute acids.
Pka:15.4.
MATERIALS AND METHODS
Materials
Chemicals/standards and reagents Equipment’s
KH2PO4 Electronic Balance
Methanol Ultra-Sonicator
Water Heating Mantle
Dipotassium hydrogen phosphate Thermal oven
Miconazole pH Meter
Metronidazole Filter Paper 0.45 microns
METHODS
Preparation of mobile phase
Transfer 1000ml of HPLC water into 1000ml of beaker add 0.2%OPA. Transfer the above solution 750ml of0.1%OPA into 250ml of Methanol, used as mobile phase. After mixing they are sonicated for 20min.
Preparation
of
the
miconazole
and
metronidazole standard and sample solution
Preparation of Standard Solution
Accurately weigh and transfer 1%w/w of Miconazole and 2%w/w Metronidazole into 100ml of volumetric flask and add 10ml of Methanol and sonicate 10min (or) shake 5min and make with water.
Preparation of sample stock solution
Accurately weigh and transfer equivalent to the 15%w/w of Miconazole and Metronidazole of active ingredients were transfer into a 100ml of volumetric flask and add 10ml of Methanol and sonicate 20min (or) shake 10min and makeup with water.
Transfers above solution 6ml into 25ml of the volumetric flask dilute the volume with Methanol. And the solution was filtered through 0.45μm filter before injecting into HPLC system.
ASSAY PROCEDURE
Sample preparation
Accurately weighed about
15%w/w(2%Miconazoleand1%Metronidazole) into a 100 ml volumetric flask and 50 ml of mobile phase was added. The mixture was subjected to sonication for 20 min with intermediate shaking for complete extraction of drugs. Filtered and cooled to room temperature and solution was made
up to mark with mobile phase. From the above solution 6 mL is taken and further diluted in 25 ml volumetric flasks with mobile phase.
Standard preparation
Accurately weighed quantity of 1%w/w of Miconazole and 2%w/w Metronidazole was taken in a 100 ml volumetric flask and 50 ml of mobile phase was added. The mixture was subjected to sonication for 20 min with intermediate shaking for complete extraction of drugs. Filtered and cooled to room temperature and solution was made up to mark with mobile phase. From the above solution 6 ml is taken and further diluted in 25 mL volumetric flasks with mobile phase.
Procedure
Separately injected both the standard (2 injections) and sample preparations (2 injections) into the chromatographic system and recorded the peak area responses.
% percentage content =
Sample area × Sample dilution ×Average weight × standard weight x purity of working standard ×100
Standard area × standard dilution × label claim × sample weight
RESULTS AND DISCUSSION
Selection of wavelength
The UV spectrums of Miconazole and Metronidazole under these mobile phase conditions
Optimized chromatographic method
Mobile Phase: 0.1%POA: Methanol (75:25) Column: Phenomenex C18, 150X 4.6, 5µm Flow Rate: 1.0ml/Min
Temperature: 30˚C Volume: 10µl Detector: 268nm
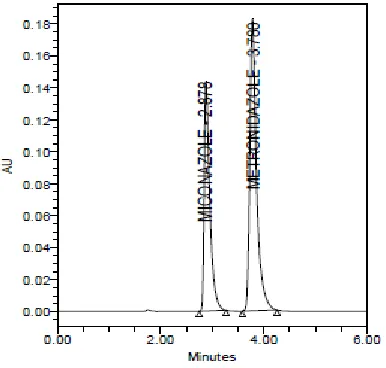
Figure: 3.1 chromatogram of miconazole and metronidazole
Name Retention Time Area USP Resolution USP Tailing USP Plate Count
1 Miconazole 2.876 647168 1.77 4048
2 Metronidazole 3.759 1231019 4.25 1.54 4779
Observation
RT was found to be good and the peak symmetry of both drugs were good. And the
resolution theoretical plate count and tailing were within the limits and it is used for validation of the method. 2 .8 7 6 3 .7 5 9 AU 0.00 0.02 0.04 0.06 0.08 0.10 0.12 0.14 Minutes
0.00 0.50 1.00 1.50 2.00 2.50 3.00 3.50 4.00 4.50 5.00 5.50 6.00 6.50 7.00 2.882 Peak 1
265.2 384.3 AU 0.00 0.02 0.04 0.06 0.08
3.780 Peak 2
243.9 AU 0.00 0.20 0.40 nm
Validation of hplc for method development system suitability
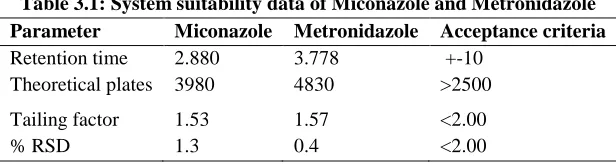
Table 3.1: System suitability data of Miconazole and Metronidazole
Parameter Miconazole Metronidazole Acceptance criteria
Retention time 2.880 3.778 +-10
Theoretical plates 3980 4830 >2500
Tailing factor 1.53 1.57 <2.00
% RSD 1.3 0.4 <2.00
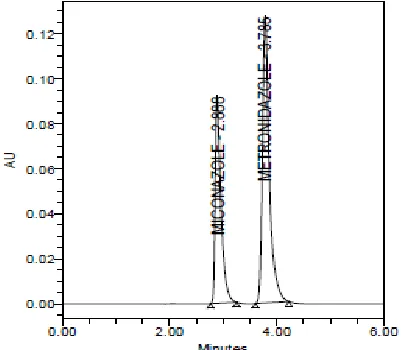
Specificity
Table 3.2: Specificity data for Miconazole and Metronidazole
S no Sample name Miconazole area Rt Metronidazole Area Rt
1 Standard 680522 2.880 1145269 3.778
2 Sample 687956 2.882 1144439 3.780
3 Blank - - - -
4 Placebo - - - -
Figure.3.2 chromatogram representing specificity of sample
Precision
Table3.3: Precision data for Miconazole
S.no RT Area %Assay
Injection1 2.882 687956 100 Injection2 2.882 686446 100
Injection3 2.879 683911 100 Injection4 2.885 685156 100 Injection5 2.882 689850 101 Injection6 2.883 688456 100
Mean 100
Std. Dev. 0.32
Table 3.4: Precision data for Metronidazole
S.no RT Area %Assay
Injection1 3.780 1144439 100 Injection 2 3.778 1149354 100 Injection 3 3.775 1146742 100 Injection 4 3.780 1150634 100 Injection 5 3.777 1149534 100 Injection 6 3.780 1151085 100
Mean 100
Std. Dev. 0.22
%RSD 0.22
Fig 3.3: Chromatogram for precision injection 1
RESULT
Results of variability were summarized in the above table. % RSD of peak areas was calculated
for various run. Percentage relative standard deviation (%RSD) was found to be less than 2% which proves that method is precise.
Accuracy
Table 3.4 Accuracy (%recovery) results of Miconazole S.NO Accuracy
level
Sample name
Sample weight
μg/ml added
μg/ml found
% Recovery % Mean
1 50%
1 7.50 1.200 1.20 100
100
2 7.50 1.200 1.20 100
3 7.50 1.200 1.21 101
2 100%
1 15.00 2.400 2.39 100
100
2 15.00 2.400 2.39 100
3 15.00 2.400 2.39 100
3 150%
1 22.50 3.600 3.59 100
100
2 22.50 3.600 3.57 99
Table 3.5 Accuracy (%recovery) results ofMetronidazole S.NO Accuracy
level
Sample name
Sample weight
μg/ml added
μg/ml found
% Recovery % Mean
1 50%
1 7.50 2.400 2.41 100
100
2 7.50 2.400 2.39 100
3 7.50 2.400 2.40 100
2 100%
1 15.00 4.800 4.81 100
100
2 15.00 4.800 4.79 100
3 15.00 4.800 4.79 100
3 150%
1 22.50 7.200 7.20 100
100
2 22.50 7.200 7.21 100
3 22.50 7.200 7.18 100
Fig 3.4: Typical chromatogram for Accuracy 100 %
Linearity
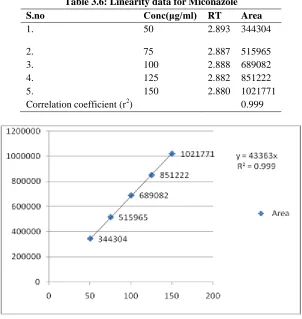
Table 3.6: Linearity data for Miconazole
S.no Conc(μg/ml) RT Area
1. 50 2.893 344304
2. 75 2.887 515965
3. 100 2.888 689082
4. 125 2.882 851222
5. 150 2.880 1021771
Correlation coefficient (r2) 0.999
Fig 3.6: Linearity plot of Miconazole
Linearity data for Metronidazole
S.no Conc(μg/ml) RT Area
1. 50 3.785 572341
2. 75 3.781 850562
3. 100 3.785 1141106
4. 125 3.783 1432105
5. 150 3.783 1728967
Fig 3.7: Linearity plot of Metronidazole
Fig 3.8: Chromatogram representing lineartity1 Fig 3.9:representing linearity 2
Fig 3.11: Chromatogram representing linearity 4 Fig 3.12: Representing linearity 5
RESULT
A linear relationship between peak areas versusconcentrations was observed for Miconazole and Metronidazole in the range of 50% to 150% of
nominal concentration. Correlation coefficient was 0.999 for both Miconazole and Metronidazole which prove that the method is linear in the range of 50% to 150%.
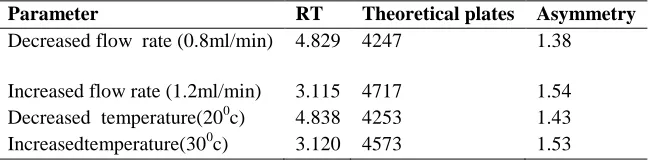
Robustness
Table 3.7: Robustness data for Miconazole
parameter RT Theoretical plates Asymmetry
Decreased flow rate(0.8ml/min) 3.702 3288 1.49
Increased flow rate(1.2ml/min) 2.373 4081 1.37
Decreased temperature(200c) 3.704 3187 1.53
Increased temperature(300c) 2.376 4044 1.48
Table 3.8: Robustness data for Metronidazole
Parameter RT Theoretical plates Asymmetry
Decreased flow rate (0.8ml/min) 4.829 4247 1.38
Increased flow rate (1.2ml/min) 3.115 4717 1.54 Decreased temperature(200c) 4.838 4253 1.43
Fig 3.13: Chromatogram for decreased flow rate Fig 3.14: for increased flow rate
Result
The results of Robustness of the present method had shown that changes made in the Flow and Temperature did not produce significant changes in analytical results which were presented in the above table. As the changes are not significant we can say that the method is Robust.
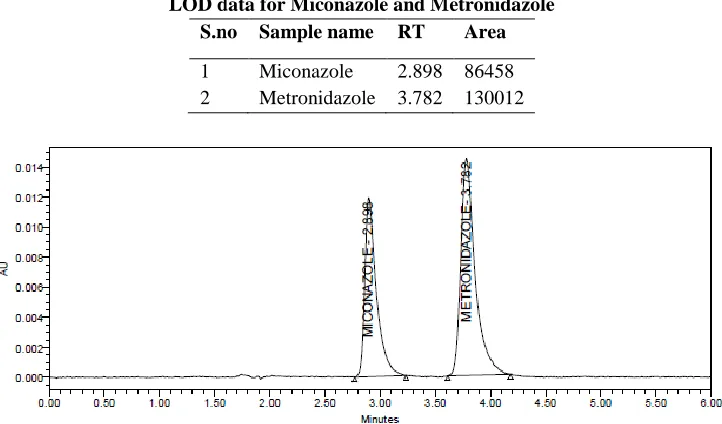
Limit of detection
Minimum concentration of standard component in which the peak of the standard gets merged with noise called the LOD
LOD = 3.3* σ/S
LOD for Miconazole = 0.010, LOD for Metronidazole =0.014
LOD data for Miconazole and Metronidazole
S.no Sample name RT Area
1 Miconazole 2.898 86458 2 Metronidazole 3.782 130012
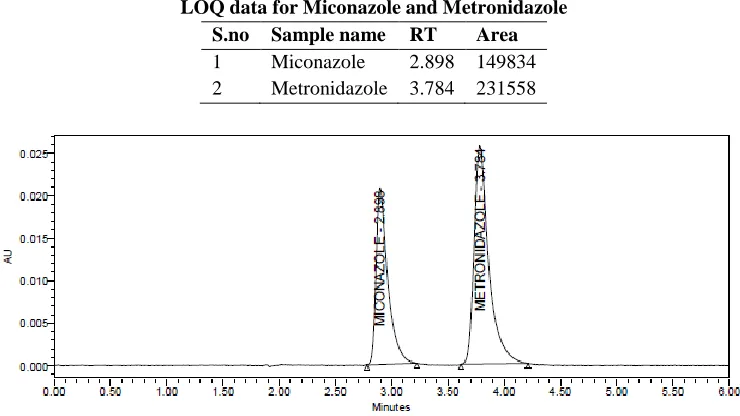
Limit of quantification
Minimum concentration of standard component in which the peak of the standard gets detected and quantification
LOQ = 10*σ/S
LOQ for Miconazole =0.034 LOQ for Metronidazole =0.0467
LOQ data for Miconazole and Metronidazole
S.no Sample name RT Area
1 Miconazole 2.898 149834 2 Metronidazole 3.784 231558
Fig 3.16: Chromatogram for LOQ
CONCLUSION
The study is focused to develop and validate HPLC methods for estimation of Miconazole and Metronidazole in tablet dosage form. For routine analytical purpose it is desirable to establish methods capable of analysing huge number of samples in a short time period with good robustness, accuracy and
precision without any prior separation steps. HPLC method generates large amount of quality data, which serve as highly powerful and convenient analytical tool. The method shows good reproducibility and good recovery. From the specificity studies, it was found that the developed methods were specific for Miconazole and Metronidazole.
BIBLIOGRAPHY
[1]. Sharma BK. Instrumental methods of chemical analysis, Introduction to Analytical chemistry, 23thed.Goel Publishing House Meerut, 2004, 12-23.
[2]. H.H. Willard, L.L. Merritt, J.A. Dean, F.A. Settle. Instrumental Methods of Analysis, CBS publishers and Distributors, New Delhi. 7, 1986, 518-521, 580-610.
[3]. John Adamovies. Chromatographic Analysis of Pharmaceutical, Marcel Dekker Inc. New York, 2, 74, 5-15. [4]. GurdeepChatwal, Sahm K. Anand. Instrumental methods of Chemical Analysis, Himalaya publishing house,
New Delhi, 5, 2002, 1.1-1.8, 2.566-2.570
[5]. D. A. Skoog. J. Holler, T.A. Nieman. Principle of Instrumental Analysis, Saunders College Publishing, 5, 1998, 778-787.
[6]. Skoog, Holler, Nieman. Principals of Instrumental Analysis, Harcourt Publishers International Company, 5, 2001, .543-554.
[9]. Metronidazole Drug profile.www.drugbank.ca/drugs/DB00916.
[10]. Dhananjay B. Meshramet al.; Simultaneous Determination Of Metronidazole And Miconazole Nitrate In Gel By HPLC. Pharm. Sci., 22(3), 2009, 323-328.
[11]. Minakshi V. Janjaleet al.; Application of Mixed Hydrotropic Solubilization Technique for Simultaneous Spectrophotometric Estimation of Metronidazole and Miconazole Nitrate from Different Pharmaceutical Dosage Forms. International Journal of Pharmaceutical & Biological Archives 3(2), 2012, 383-390.
[12]. CemalAkayet al.; Simultaneous Determination of Metronidazole And Miconazole In Pharmaceutical Dosage Forms By Rp-Hplc. World Journal Of Pharmacy And Pharmaceutical Sciences. 3(7), 1026-1033.