DEMOGRAPHIC RESEARCH
VOLUME 30, ARTICLE 21, PAGES 609640
PUBLISHED 5 MARCH 2014
http://www.demographic-research.org/Volumes/Vol30/21/ DOI: 10.4054/DemRes.2014.30.21
Research Article
Non-marital pregnancy and the second
demographic transition in Australia in historical
perspective
Gordon Carmichael
2014 Gordon Carmichael.
This open-access work is published under the terms of the Creative Commons Attribution NonCommercial License 2.0 Germany, which permits use, reproduction & distribution in any medium for non-commercial purposes, provided the original author(s) and source are given credit.
1 Introduction 610
2 Non-marital conception rates at ages 15−44 612
3 Age-specific non-marital conception rates 614
4 Other related trends 620
4.1 Percentage of births non-marital 621
4.2 Age-specific bridal pregnancy ratios 622
4.3 Age-specific legitimation ratios 623
4.4 Age distributions of non-marital conceptions 625 4.5 Age-specific distributions of premaritally conceived marital first
confinements by duration of marriage
627
5 Brides pregnant with second and subsequent children since 1976 631
6 Discussion 634
Non-marital pregnancy and the second demographic transition in
Australia in historical perspective
Gordon Carmichael1
BACKGROUND
Australia has remarkably detailed data on non-marital pregnancy dating from 1908. They both offer insight into long-term trends in childbearing resulting from non-marital sexual activity and reveal in historical context key features of the second demographic transition and its genesis.
OBJECTIVE
Trends are traced in rates of non-marital conception of children ultimately born both outside and within marriage. A range of related indices is also presented in examining how demographic behaviour surrounding non-marital pregnancy (i) helped generate the second demographic transition and (ii) unfolded as a component of it.
METHODS
Core indices are rates of non-marital conception partitioned into additive components associated with marital and non-marital confinement. Data on non-marital and early marital births (at marriage durations 07 months) are lagged back 38 weeks to a date of and age at conception basis to facilitate a common, unmarried, population at risk.
RESULTS
Post-war weakening of parental oversight of courtship was a fundamental trigger to the broader rejection of normative and institutional values that underpinned the second demographic transition. In tandem with denying the unmarried access to oral contraception it generated rampant youthful non-marital pregnancy, which undermined Judeo-Christian values, especially once abortion law reform occurred.
CONCLUSIONS
Childbearing following non-marital conception transitioned rapidly after the 1960s from primarily the unintended product of youthful intercourse in non-coresidential relationships to mainly intended behaviour at normative reproductive ages in consensual unions. Family formation increasingly mixed non-marital births and premaritally and/or maritally conceived marital births.
COMMENTS
An earlier analysis of non-marital pregnancy in Australia (Carmichael 1996) traversed the entire period of European settlement, commencing with the convict era (17881840). It did not focus on the second demographic transition, as this updated analysis does.
1. Introduction
In the first English language exposition of the second demographic transition, van de Kaa (1987: p. 7) highlighted an associated ―large change in norms and attitudes‖ in Western Europe between the mid-1960s and the mid-1980s. This signalled rapid adoption of a much more individualistic outlook on life, and was illustrated using survey data for the Netherlands. Among the attitude changes van de Kaa demonstrated were huge increases over periods of less than a decade to a decade and a half in acceptance of sexual relations between couples who intended to marry and between a girl and a boy she ―likes a lot‖, and in acceptance of voluntary childlessness, divorce with children still at home, mothers of school-age children working, homosexuality, cohabitation with no intent to marry, and living apart together. There had also been a marked decline in the belief that married people were generally happier than single people.
These sorts of attitude changes, variously also labelled ―reflexive modernization‖ (Beck, Giddens, and Lash 1994) and ―social liberalism‖ (McDonald 2006), were occurring simultaneously in numerous developed countries including Australia (Carmichael 1998), and found expression in a variety of demographic indices. In this paper the focus is on trends in a range of measures pertaining to non-marital pregnancy and childbearing. They derive from data available for Australia since 1908 that tabulate annually (i) non-marital confinements yielding live births by age of mother and (ii) marital first confinements yielding live births by duration of marriage and age of mother. The latter data break duration down in months for the first year of marriage, allowing marital confinements following non-marital conceptions to be estimated (as the number of confinements within eight months of marriage). Together, the two sets of data facilitate a focus not just on non-marital fertility but also on childbearing (non-marital or (non-marital) resulting from non-(non-marital sexual activity.
have been preceded by non-marital births to other men and/or, for women pregnant at remarriage, by marital births to a previous spouse. Despite pressure from the Australian Bureau of Statistics (ABS) for parity data to reflect all previous children of the mother, the second and third largest States, Victoria and Queensland, continue to resist. The key issue is sensitivity – whether a married woman should be expected to disclose a previous birth her husband may be unaware of. Changes in other States and Territories are reflected in published data only since 2007, so this issue affects almost all data used here. Setting it aside, however, as something that can be acknowledged but not resolved, as the data described are available from 1908, trends over slightly more than a century will be examined. Emphasis will be placed on the more recent ones that spectacularly exemplify Australia‘s second demographic transition.
Several scholars have previously examined non-marital fertility and/or pregnancy trends in Australia. The major stimulus to research was the post-war development of a sexual revolution that during the 1950s and 1960s pitched successive youth cohorts into ever earlier marriages and saw non-marital fertility rates among adolescents and young adults rise rapidly (Basavarajappa 1968; Spencer 1969; Ruzicka 1975, 1976, 1977; Refshauge 1982; Carmichael 1996). The latter trend, aided by practices now widely condemned and the subject, during 20102013, of a spate of formal apologies from State and Territory Governments, religious denominations, and the Federal Government (Graham 2012; Gillard 2013), provided a growing supply of children for adoption.
The second demographic transition in Australia largely postdates this sexual revolution, but attitude and value changes at its core owed much to dissatisfaction with Judeo-Christian society‘s response to the revolution. The analysis that follows updates to 2010 one that terminated in the early 1990s (Carmichael 1996), and utilizes among other measures marital conception rates. These are generated from the data on non-marital confinements and non-marital first confinements within 07 months of marriage, which obviously pertain to a mixture of unmarried and married women. They therefore do not have a common population at risk, but by lagging data back 38 weeks (an assumed average gestation period at confinement) to an age at and year of conception basis using lexis diagram principles (Carmichael 1985), both sets of data concern events (conceptions rather than confinements) occurring to unmarried women. This yields a common population at risk, and the capacity to calculate non-marital conception rates that are sums of component rates of conception resulting in non-marital and in marital confinement.
single-year ages of woman are available lexis diagram principles can again be applied, assuming an average gestation at termination of 8 weeks, to incorporate a third additive component into non-marital conception rates (Stloukal 1997). Such data are not, however, available for Australia, so changes in rates of induced abortion need to be taken account of as a potential factor explaining trends in non-marital conception rates resulting in non-marital and marital confinement. These may have declined, for example, because non-marital pregnancies were more often terminated by induced abortion.
2. Non-marital conception rates at ages 1544
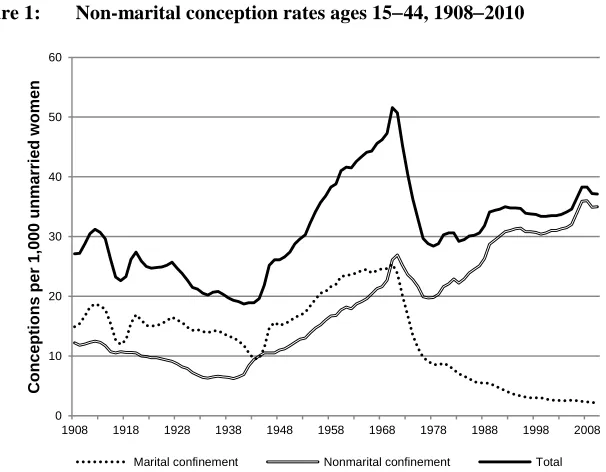
Trends between 1908 and 2010 in non-marital conception rates for women aged 1544 and in additive component rates associated with marital and non-marital confinement are shown in Figure 1. Until the end of the Second World War the overall rate declined from around 30 per 1,000 unmarried women to below 20. This decline was largely driven by the component rate associated with non-marital confinement, until war placed impediments in the way of ‗shotgun‘ marriages. The rate associated with non-marital confinement consequently turned upward, and that associated with marital confinement downward after 1939 as departing servicemen left pregnant girlfriends behind. Many courting couples did hurriedly marry before being separated at this time (McDonald 1974; Carmichael 1988), but if pregnancy was not apparent when a serviceman sailed or involved a visiting American serviceman on leave (Aitchison 1972; Moore 1981; McKernan 1983; Sturma 1989), marriage may not have been an option. There were 12,000 to 15,000 marriages between Australian women and American servicemen during the War (Sturma 1989), but not all Americans who impregnated Australians were willing or, if already married, able to marry them. And again, some will have departed Australia before pregnancies were confirmed.
1984). Road accident death rates at ages 1519 and 2024 were respectively 3.4 and 2.4 times higher for males and 5.1 and 3.4 times higher for females in 196971 than in 194547 (Zou 1998), the gender differential implying more frequent couple occupancy of cars. Cars offered both makeshift bedrooms and the mobility to seek private locations for intimacy, and declining ages at first marriage through the 1950s were above all a product of increasing rates of female marriage at ages 1621 where brides were pregnant (Carmichael 1988, Figure 7).
Figure 1: Non-marital conception rates ages 1544, 19082010
At that time ‗shotgun‘ marriage was the ‗honourable‘ response to unintended premarital pregnancy. Clearly, though, it did not eventuate in a significant proportion of such situations (Figure 1), and this rapid increase in the rate of non-marital conception leading to non-marital confinement was the basis of the wave of often ‗forced‘ adoptions, whose inappropriateness has only recently been officially acknowledged (Moor 2006; Australian Senate 2012; Kenny et al. 2012). National figures on adoptions by non-relatives are only available from 19681969 and show a peak of around 7,900 in 19711972, falling to below 3,000 in 19761977 and below 1,000 by the late 1980s. Trend data for New South Wales, responsible for 48% of national adoptions by
non-0 10 20 30 40 50 60
1908 1918 1928 1938 1948 1958 1968 1978 1988 1998 2008
C
once
pt
ions
per
1
,0
0
0
unm
a
rri
e
d
w
om
e
n
relatives in 19711972, extend over a longer period. They show non-relative adoptions processed by the Department of Child Welfare (others were processed by solicitors and, after 1965, accredited adoption agencies) increasing from an annual average of 681 between 19551956 and 19591960 to 2,121 between 19701971 and 19731974, with a peak of 3,176 in 19711972. By 19771978 the number had fallen again by more than three-quarters, to just 762 non-relative adoptions.
This rapid increase then decrease in adoptions by non-relatives coincided with the sharp peaks located in the early 1970s in Figure 1. They reflect a rapidly rising then precipitously declining supply of ‗illegitimate‘ babies for adoption. By one estimate for New South Wales, in 19651966 adoptions of babies born to unmarried mothers accounted for 45% of non-marital births (NSW Department of Child Welfare 1966). Having peaked above 50 per 1,000 unmarried women aged 1544 in 1970, the overall rate of non-marital conception plummeted to below 30 per 1,000 by 1976. Component rates associated with non-marital and marital confinement also dropped sharply, although while that associated with marital confinement would continue on a downward trajectory, that associated with non-marital confinement turned upward again. With the odd minor reversal it would surge past its 1971 peak of 26.9 conceptions per 1,000 unmarried women by 1989, and continue rising until late in the first decade of the new millennium.
3. Age-specific non-marital conception rates
Age-specific detail of the trends in component rates of non-marital conception is shown in Figure 2. The major decline in non-marital conceptions leading to marital confinement was driven by age groups 1519 and 2024. The conception rate for teenagers had climbed relentlessly following the Second World War, but fell by two-thirds in the six years after 1970, continuing to decline thereafter until, in 2010, it was barely above zero. The pregnant teenaged bride, frequently stigmatized and satirized during the 1950s and 1960s, is nowadays rare and a creature of history. The conception rate leading to marital confinement for 2024 year olds also declined precipitously after 1970, and with minor interruptions it, too, has continued to trend downward, although not quite to a near-zero level. But what is also of interest with this age group, and 2529 year olds, is evidence of decline through the 1960s as well. These slightly older unmarried women were at that time already beginning to query the ‗honourable‘ response to unintended pregnancy. Something then happened to blow that longstanding tenet of Judeo-Christian morality completely out of the water.
been uniformly low and tightly bunched through the 1930s, they increased at varying speeds during and after the Second World War and consequently dispersed. At ages 2529 through 4044 they rose rapidly through the 1950s, possibly reflecting post-war marriage breakdowns and the impediment to remarriage represented by current divorce laws, then flattened off in the 1960s. At ages 1519 and 2024, upward momentum continued throughout these two decades to peaks in 1971. The downturn through the first half of the 1970s, evident in Figure 1, affected all reproductive ages, and except for a delayed response at ages 4044 all rates turned upward again from the late 1970s. This reasserted upward momentum would be most persistent for the three oldest age groups in Figure 2. At younger ages there were further declines through the 1990s and beyond, reflecting a marked general shift to older ages at childbearing in Australia (Carmichael 2013a).
Figure 2: Age-specific rates of non-marital conception leading to marital and non-marital confinement, 19082010
0 10 20 30 40 50 60
1908 1918 1928 1938 1948 1958 1968 1978 1988 1998 2008
C
onc
e
pt
ions
pe
r
1
,0
0
0
unma
rr
ie
d
w
omen
Maritalconfinement
15-19 20-24 25-29
30-34 35-39 40-44
0 10 20 30 40 50 60
1908 1918 1928 1938 1948 1958 1968 1978 1988 1998 2008
C
once
pt
ions
per
1
,0
0
0
unm
a
rri
e
d
w
om
e
n
Non-marital confinement
15-19 20-24 25-29
The trend to consensual partnering and consequent greater coverage of non-marital sexual activity by the pill was undoubtedly a factor. Non-cohabiting unmarried women becoming emboldened to demand it and the development of post-coital forms of ‗emergency‘ contraception may also have contributed. However, the rapidity of the decline in non-marital conception rates through the early and mid-1970s and the date from which it commenced leave little doubt that the key occurrence was liberalization of abortion laws. A 1969 legal ruling clarified the law in Victoria, and South Australian law was liberalized with effect from early 1970 (Carmichael 1996, endnote 102). The key change, though, came in New South Wales in late 1971 when, in directing the jury
in R. v Wall et al., Mr Justice Levine explicitly admitted the ―effects of economic or
social stresses that may be pertaining at the time‖ as relevant to establishing danger to a woman‘s mental health sufficient to justify abortion. He also asserted that a second doctor‘s opinion was unnecessary, and that abortions need not take place in public hospitals. This reinterpretation of state law gave private practitioners and specialist clinics the green light to openly provide services for the first time anywhere in Australia.
Accurate national abortion data do not exist, especially for the 1970s and early 1980s when the major downturns in non-marital conception rates occurred. Abortion became notifiable in South Australia in 1970, but that is the only jurisdiction with comprehensive statistics from that date (Chan and Taylor 1991). It later also became notifiable in the Northern Territory and Western Australia, but has never been made so in the three eastern mainland states in which most Australians (currently 77%) live. Efforts to measure abortion in Australia (Chan and Sage 2005; Grayson, Hargreaves, and Sullivan 2005) have used Medicare claims data and National Hospital Morbidity (NHM) data, available since 1985 and 1994 respectively. The former cover services provided by private abortion clinics and private hospitals for which Medicare claims are presented. NHM data cover both public and private hospital procedures, and through comparison with Medicare data facilitate checking on potential private hospital Medicare claimants who for reasons of privacy etc. elect not to file claims. The prevalence of this sort of behaviour has also been estimated for abortion clinic patients via surveys in New South Wales (Adelson, Frommer, and Weisburg 1995) and Victoria (Nickson, Smith, and Shelley 2004).
(28.7 per 1,000 in 1971), and was thereafter consistently in the high 20s or low 30s. Interpreting these data is hampered by not knowing how many notified abortions in 1970 would have been clandestine without the law change, but clearly the take-up of abortion by unmarried women in South Australia through the early 1970s was rapid. If, as seems likely, teenage abortion prior to 1970 was near zero, and a rise to some 18 per 1,000 unmarried 1519 year olds in 1976 bears some resemblance to the scale of change nationally once abortion virtually on request became available in New South Wales, clearly abortion was the major factor in the national rate of non-marital conception at ages 15-19 (sum of both components in Figure 2) falling by 24 per 1,000 during 19711976. South Australia Health regularly publishes a graph of teenage birth, abortion, and pregnancy rates since 1970 (e.g., Chan et al. 2011, Figure 8b), and this shows rapid convergence of abortion and birth rates during the 1970s, both levelling out at around 20 per 1,000 after 1980. The trends are clearly linked, and national abortion rates for 19852003 that Chan and Sage (2005, Figure 3) plot alongside South Australian rates hint, because they are distinctly higher, that if available back to 1970 they would show an even sharper response to 19691971 changes to abortion laws. This is only to be expected given that South Australia still requires abortions to take place in hospitals, whereas New South Wales, Victoria, Tasmania, and the Australian Capital Territory have long also permitted them in other facilities. This wider range of termination options attracts interstate patients, particularly to Sydney and Melbourne (Nickson, Shelley, and Smith 2002), quite apart from any innate tendency to higher demand for abortion in larger metropolitan centres.
leading to non-marital confinement. A particular inducement to such behaviour was the Whitlam Labor Government‘s introduction in 1973 of a Supporting Mother‘s (later Supporting Parent‘s) Benefit. This offered a more realistic economic base for choosing sole parenthood over other resolution options for unintended pregnancy.
Upturns in rates of non-marital conception leading to non-marital confinement following the declines of the 1970s (Figure 2) reflect the rise in consensual partnering that began in the late 1960s, and the increasing acceptance of childbearing within consensual unions that emerged through the 1980s and 1990s – in Australia as in other developed countries (Kiernan 2001). This force would quickly counteract and overwhelm those that had seen non-marital confinement rates fall. McDonald and Reimondos (2013) present survey data for Australia showing how relationship pathways to first birth changed between female cohorts born in the 1940s, 1950s, 1960s, 1970s, and 1980s. Across these cohorts, in conjunction with a major delay by the two youngest of them in entering any type of co-resident relationship, there occurred a marked decline in direct entry to marriage and a correspondingly sharp increase in marriages preceded by cohabitation, usually with the spouse but sometimes with others as well. The increased complexity of relationship histories McDonald and Reimondos demonstrate was a product of (2013, p. 70) the ―wave of social liberalism‖ that emerged in reaction to ―the rigid social regime of the male breadwinner model of the family that held sway in the 1950s and 1960s‖, leading individuals to ―construct their own identities rather than having [them] defined for them by societal norms and institutions.‖
Figure 2 shows renewed declines in marital conception rates leading to non-marital confinement at ages 1519 through 2529 during the 1990s and early 2000s, but not at older ages. These almost certainly reflect the delayed entry into any form of co-resident relationship demonstrated for female birth cohorts of the 1970s and 1980s by McDonald and Reimondos (2013), and the general shift to later childbearing in which that trend was embedded (Carmichael 2013a). Renewed upturns from 2005 could be attributable, in part at least, to the introduction from July 1, 2004 of what was officially the Maternity Payment, but was quickly dubbed the Baby Bonus by the media. This was a universal payment of $A3,000 on the birth of a child, which was scheduled to increase to $A4,000 from July 1, 2006 and $A5,000 from July 1, 2008. In 2008, however, it was discontinued for families earning over $A75,000 in the six months following a birth and converted for others from a lump sum entitlement to one paid in 13 fortnightly instalments by the incoming Labor Government (Parr and Guest 2011). The 2004 scheme replaced a less lucrative tax offset scheme focused solely on first births (also, to the media, the Baby Bonus) introduced three years earlier, and was accompanied by several other family-friendly welfare initiatives. Assessments of the impact of these measures on Australian fertility have generally used words like ―modest‖ and ―slight‖ (Lattimore and Pobke 2008; Drago et al. 2011; Parr and Guest 2011), but Risse (2010, p. 231) did report an associated ―highly significant increase in the childbearing intentions of women from lower-income households‖. This may have manifested itself in increased rates of non-marital conception leading to non-marital confinement at ages 15-24. The amounts of money involved were trivial viewed alongside the lifetime cost of raising a child, but to women/couples on low incomes they may have been attractive incentives to initiate childbearing, or to have another child, sooner than otherwise planned.
4. Other related trends
4.1 Percentage of births non-marital
adoption market, but thereafter chiefly by the proliferation of cohabitation and childbearing within it.
Figure 3: Age-specific percentages of births non-marital, 1908-2010
4.2 Age-specific bridal pregnancy ratios
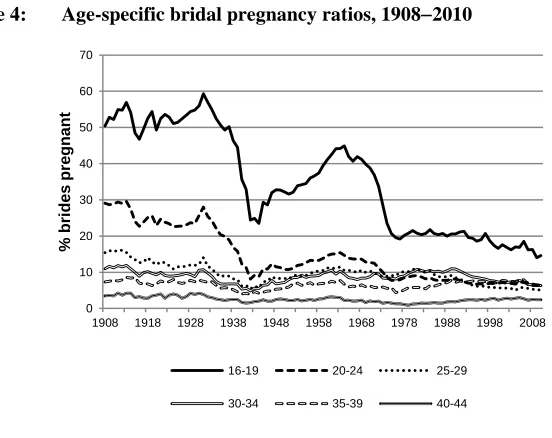
Bridal pregnancy ratios (Figure 4), generated using lexis diagram principles from data on early marital confinements and annual marriage statistics, express the percentages of brides of given ages who were pregnant (i.e., who gave birth within eight months of their wedding dates). Teenage bridal pregnancy was generally in the 50%60% range prior to the Great Depression of the 1930s. These were years when, to a considerable extent, women did not marry in their teens unless pregnant. It fell 15 percentage points during the Depression, then by a further 20 points under wartime conditions. While it recovered following the War, as teenage premarital pregnancies substantially drove the marriage boom that underpinned the baby boom, it only ever reached the immediate pre-war level again, not the pre-depression level. It did this in 1964, then began to fall again as the wisdom of ‗shotgun‘ marriage began to be questioned, before dropping steeply once the abortion revolution occurred. By the late 1970s it had reached around 20%, where it stabilized for about a decade before beginning another slow decline that still continues. Age group 2024 followed a similar path but at a much lower level – it
0 10 20 30 40 50 60 70 80 90 100
1908 1918 1928 1938 1948 1958 1968 1978 1988 1998 2008
%
bi
rt
hs
non
-m
a
ri
ta
l
16-19 20-24 25-29
declined sharply during the Depression and Second World War; recovered up to the early 1960s without regaining its pre-war level; dropped again during the 1960s and more steeply during the early 1970s; and has wobbled around in the 6%9% range ever since. Older age groups exhibit shallower trends associated with the Depression, the War, then the post-war sexual revolution, before converging (except age group 4044) with age group 2024 beyond the mid-1970s.
Figure 4: Age-specific bridal pregnancy ratios, 19082010
4.3 Age-specific legitimation ratios
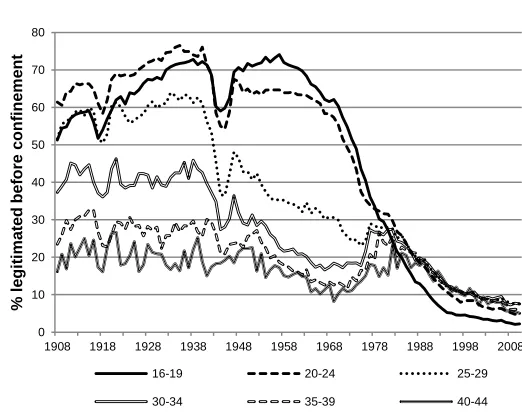
Figure 5 plots age-specific trends since 1908 in the legitimation ratio, the percentage of non-maritally conceived births that occur within marriage (i.e., that are ‗legitimated‘ by marriage prior to confinement). For most of the twentieth century there was a wide disparity in legitimation levels by age of mother. Prior to the Second World War the highest level was at ages 2024. For teenagers it was slightly lower, the relatively late normative age for marriage and family formation at that time meaning there were comparatively few teenage non-marital pregnancies, and that those that did occur quite often did so in circumstances not conducive to marriage before confinement. Legitimation levels did, however, rise at these younger ages before 1939, probably as a function of decline in the aforementioned normative age for marriage and family
0 10 20 30 40 50 60 70
1908 1918 1928 1938 1948 1958 1968 1978 1988 1998 2008
%
bri
des
pre
gnant
16-19 20-24 25-29
formation (Carmichael 1988). Levels at most ages dipped sharply during the world wars – another manifestation of the impediment troop departures were to ‗shotgun‘ marriage – then after the Second World War an unambiguous negative relationship between legitimation and maternal age developed.
Legitimation for teenagers recovered to pre-war levels during the 1950s, while that for age group 2024 only partly recovered, as did ratios for 2529 and 3034 year olds. In particular, a huge post-war gap opened between age groups 2024 and 2529 as ages at first marriage fell and non-marital pregnancies in the latter age group increasingly involved couples awaiting final divorces before marriage was legally possible. Teenage and early adult legitimation dropped through the 1960s as the wisdom of ‗shotgun‘ marriage was queried. They then plummeted through the 1970s as the idea of marrying because one was pregnant lost all credibility in the face of sweeping attitude/value changes and the emergence of abortion and welfare-assisted sole parenthood as alternative pregnancy resolution options. The outcome was rapid convergence of legitimation ratios at all reproductive ages to levels between 20% and 30%. Subsequently these have continued to fall to well below 10%, teenagers nowadays notably being the least likely to marry between conception and confinement, completely reversing the situation during the baby boom years. Clearly, by 2010, marriage due to pregnancy had been emphatically rejected at all reproductive ages.
Figure 5: Age-specific legitimation ratios, 19082010
0 10 20 30 40 50 60 70 80
1908 1918 1928 1938 1948 1958 1968 1978 1988 1998 2008
%
l
e
gi
ti
m
a
te
d
bef
ore
c
onfin
e
m
e
nt
16-19 20-24 25-29
4.4 Age distributions of non-marital conceptions
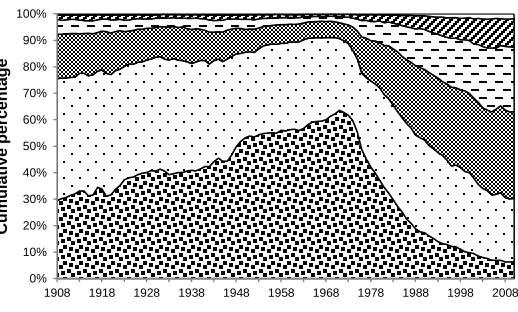
Age distributions of non-marital conceptions leading to marital and non-marital confinement are shown in Figure 6. They are standardized to the age distribution of the female population of reproductive age in 1990 to eliminate distortion due to changes in age composition. Between 1908 and the early 1970s the teenage share of non-marital conceptions resulting in marital confinement doubled more or less linearly, from 30% to 60%. The shares of age groups 2024 and 2529 contracted to accommodate this growth, which until the Second World War was largely due to declining rates of non-marital conception at older reproductive ages, but thereafter reflected the rapidly rising rates of teenage conception (Figure 2). The period following the early 1970s, as the second demographic transition took hold, then saw the teenage share of these conceptions fall continuously, to well under 10% by 2010. The slack was taken up by older reproductive ages (principally 2529, 3034, and 3539), at which cohabiting women, who were probably mostly intentionally pregnant, increasingly dominated the diminished corpus of pregnant brides. These older women, in the main, were probably not marrying to satisfy social convention, but because, being pregnant, it was as good a time as any to do something they and their partners intended doing at some point anyway. Decisions to have children and to marry during pregnancy may often even have been consciously linked.
between its share rose to 33.4% in 1987, before subsiding again as the early twenties became too young for many to seriously contemplate parenthood.
Figure 6: Standardized age distributions of non-marital conceptions leading to marital and non-marital confinement, 19082010
0% 10% 20% 30% 40% 50% 60% 70% 80% 90% 100%
1908 1918 1928 1938 1948 1958 1968 1978 1988 1998 2008
C
um
ul
a
ti
v
e
per
c
e
nt
a
ge
Marital confinement
15-19 20-24 25-29 30-34 35-39 40-44
0% 10% 20% 30% 40% 50% 60% 70% 80% 90% 100%
1908 1918 1928 1938 1948 1958 1968 1978 1988 1998 2008
C
um
ul
a
ti
v
e
per
c
e
nt
a
ge
Non-marital confinement
4.5 Age-specific distributions of premaritally conceived marital first confinements by duration of marriage
The distribution of marital first confinements following non-marital conception by duration of marriage within durations 07 months has been examined in previous Australian studies of non-marital pregnancy. The belief has been that it aids understanding of the contexts in which pregnancies followed by marriage before confinement occurred, and points to broad changes in their relative importance over time (Spencer 1969; Ruzicka 1977; Carmichael 1996). Spencer (1969) divided ―premarital‖ pregnancies into ―shotgun‖ and ―anticipatory‖ subgroups based on their having led to confinement at marriage durations 03 and 47 months respectively. However, given that the term ‗shotgun‘ is (inappropriately) widely used to refer to any marriage in which the bride is pregnant, Ruzicka‘s (1977) terminology when making the same distinction is arguably preferable. He differentiated between ―forced‖ and ―advanced‖ marriages.
The theory behind this differentiation is that the longer the delay from conception to marriage (and hence the shorter the interval from there to confinement) the greater the likelihood that pregnancy actually precipitated marriage, as distinct from having occurred in the lead-up to an already planned wedding. Where marriage was a response to pregnancy, time would be taken for pregnancy to be confirmed, agreement to marry to be reached, and wedding arrangements to be made, shortening the interval from marriage to confinement. In his later analysis Carmichael (1996) further divided Ruzicka‘s ―advanced‖ subgroup into confinements at marriage durations 45, 6, and 7 months, for two reasons. First, the label ―advanced‖ was a misnomer if conception had occurred shortly before an already arranged wedding. Second, there was interest in what impact marketing of the pill from the early 1960s and the practice of prescribing it from several weeks before a young woman‘s wedding day had had on pregnancy at marriage. This would be more clearly reflected in the relative importance of confinements at marriage duration 7 months, and possibly also 6 months, than of those at durations 47 months.
Depression (Carmichael 1988). This progressively rendered younger women more likely to become premaritally pregnant in relationships in which marriage was imminent if not already planned, and less likely to do so in more casual, even exploitative, relationships in a climate where youthful marriage was uncommon unless
one was pregnant. The main counterpoints to these downward trends at durations 03 months were upward trends at duration 6 months and, for part of the time, 7 months, implying proportionately more conceptions within sight of marriages that were perhaps mostly already scheduled. The declining trends in confinement after 03 months at ages 1619 and 2024 reversed emphatically from the early 1960s, the shares of these ‗forced‘ marriages rising for about two decades, declining then levelling off through the 1980s and 1990s, then rising again from the late 1990s to highest-ever recorded levels.
Figure 7: Percentages of marital first confinements within eight months of marriage occurring at marriage durations 03, 45, 6 and 7 months by age 0 10 20 30 40 50 60 % c o n fin e m e n ts w it h in 8 m o n th s
1619
0-3 months 4-5 months
6 months 7 months
0 10 20 30 40 50 60 % co n fin em en ts wit h in 8 m o n th s
2024
0-3 months 4-5 months
Figure 7: (Continued)
The upturns through the 1960s and 1970s were repeated at ages 2529, but thereafter this age group saw decline through the 1980s and 1990s followed by recovery through the early years of the new millennium, a pattern also evident for age groups 3034 and 3539.
The 1960s and 1970s, of course, embraced both the height of the increase in the teenage rate of non-marital conception leading to marital confinement and the dramatic decline in that rate and the equivalent rate for 2024 year olds that followed through the 1970s (Figure 2). There is, however, no discernible imprint of that sharp turning point
0 10 20 30 40 50 60 % c o n fin e m e n ts w it h in 8 m o n th s
2529
0-3 months 4-5 months
6 months 7 months
0 10 20 30 40 50 60 % c o n fin e m e n ts w it h in 8 m o n th s
3034
0-3 months 4-5 months
6 months 7 months
0 10 20 30 40 50 60 % c o n fin e m e n ts w it h in 8 m o n th s
3539
0-3 months 4-5 months
6 months 7 months
0 10 20 30 40 50 60 % c o n fin e m e n ts w it h in 8 m o n th s
4044
0-3 months 4-5 months
in the 03 months trend lines at ages 1619 and 2024 in Figure 7. This implies that as induced abortion suddenly eliminated many ‗shotgun‘ marriages it did so either without being selective by gestational age at marriage or by being selective in a way that perpetuated a trend already under way. It is likely that the driving force here through the 1960s was late premarital prescription of the pill to intending brides, and its promotion of simultaneous sharp declines in the shares of confinements at marriage durations 6 and 7 months. Because these shares fell, those at durations 03 and 45 months had to rise to compensate. This ‗driving force‘ may have continued to operate through the 1970s, but abortion selective of premarital pregnancies that if carried to term would have resulted in marital confinements after 6 or 7 months is also a possibility. These would be pregnancies where marriage would have occurred quickly following conception. The tendency has been to assume such pregnancies were products of intercourse within sight of already scheduled weddings. However, perhaps some were cases where parents would have been anxious to arrange weddings extremely quickly to minimize social embarrassment, such parents then becoming equally anxious to encourage abortions to eliminate embarrassment altogether.
It is, though, interesting to note that, unlike those at duration 6 months, downturns in the shares of confinements at marriage duration 7 months at ages 1619 and 2024 in Figure 7 began well before oral contraception arrived in 1961. They date from shortly after the Second World War, and the reason for their progress through the late 1940s and 1950s may be that as the post-war marriage boom unfolded it was ‗going steady‘ relationships that could produce moderately rapid responses to unintended pregnancy (ones leading to confinement at marriage durations 46 months) that increasingly contributed ‗shotgun‘ marriages, not those in which the wedding date was set and imminent.
experimental intercourse between non-co-resident engaged couples in the shadow of their wedding days is far rarer than it once was. Over the last decade or so, moreover, the importance of confinement at marriage duration 6 months has also dropped to levels similar to those for duration 7 months (Figure 7). This is further evidence that these days couples that marry with the bride pregnant are mostly cohabiters who are little concerned with doing so quickly to conceal physical disclosure of their condition. They have no reason to conceal it, their open cohabitation, not a ‗baby bump‘, the evidence of sexual intimacy that is no longer frowned upon by most members of society anyway.
5. Brides pregnant with second and subsequent children since 1976
Data analysed above have pertained to non-marital confinements and marital first confinements within eight months of marriage. This reflects the reality that with social convention in Australia for much of the twentieth century strongly encouraging ‗legitimation‘ of children conceived outside marriage before birth, pregnant brides were highly likely to be pregnant with first children, not second or subsequent children. While other possibilities are conceivable, situations in which this was not the case were probably most likely to arise (i) where there had been a previous non-marital birth by another man or (ii) where a woman was remarrying after having one or more children by a previous husband. And, as noted earlier, in both these circumstances the child is likely to have been treated statistically as a first child anyway, because of the convention of birth registration forms seeking details only of previous children ―of this marriage‖ or ―of this relationship‖. With the far more relaxed attitude to consensual partnering and childbearing that has evolved during the second demographic transition, however, it stands to reason that births that occur within marriage following premarital conception are nowadays less often first births. The scenario in which a couple has one or more children before marriage and is pregnant with a second or subsequent child on their wedding day seems likely to have become more common, so efforts were made to secure data that would allow this hunch to be investigated.
several States and Territories having responded over time to ABS urging, ongoing since publication of Carmichael‘s (1986) paper on flaws in Australian parity data, to move away in their birth registration practices from collecting data only on previous issue of the current relationship and ask for details of all previous children of the mother. By 2007 Queensland and Victoria were still not compliant and Tasmania‘s compliance was incomplete, but the ABS decided to begin basing previous issue in its data on all previous children born to the mother where such information was available.
Data beyond 2006 in Figure 8 (and indeed in several earlier graphs) are thus hybrid, in that two definitions of a woman‘s parity are in play, the old one for about 45% of the population and the new one for the other 55%. But the big 2007 increase for all ages under 45 is probably entirely due to women‘s parities, other than in Queensland and Victoria, suddenly taking into account births by men other than the current husband or partner. We therefore seem to have in Figure 8 two things. First, evidence that more complicated family formation profiles involving one or more non-marital births followed by a premaritally conceived marital birth became more common as consensual partnering became established between the mid-1970s and the early 1990s (other couples may, of course, have had non-marital births followed by maritally conceived marital births). Second, a suggestion, based on the 2007 increment in Figure 8 and the realization that it reflects a redefinition of parity for only 55% of Australia‘s population, that something in excess of 30% of premaritally conceived marital confinements these days are not first confinements. In perhaps half of those cases the father of previous children is not the current spouse.
ages (2534) and older who have led the charge in commencing their family formation outside marriage and completing it within marriage.
Figure 8: Percentages of premaritally conceived marital confinements parity two or higher by age, 19762011
Figure 9: Cumulative age distributions of women experiencing premaritally conceived marital births that were second or higher parity, 19762011
0 5 10 15 20 25 30 35
1976 1981 1986 1991 1996 2001 2006 2011
%
par
it
y
2
or
hi
gher
<20 20-24 25-29
30-34 35-39 All ages <45
0% 20% 40% 60% 80% 100%
1976 1981 1986 1991 1996 2001 2006 2011
C
um
ul
a
ti
v
e
per
c
e
nt
a
ge
20 25 30
6. Discussion
This paper has traced trends over more than a century in several indices pertaining to non-marital pregnancy in Australia, placing those associated with the second demographic transition in historical context. It is arguable that developments in this area following the Second World War, with parental oversight of courtship greatly weakening as it became ever easier for the young to be intimate in total privacy, were a fundamental trigger to the broader rejection of normatively and institutionally prescribed values widely held to underpin the second demographic transition. Initially, in the 1950s, ages at marriage fell, as many, though by no means all, unintended pregnancies were resolved in societally (and religiously) approved fashion – through ‗legitimation‘ of the unborn children prior to delivery. What was happening was to a degree kept under control by the fact that small 1930s birth cohorts were affected.
However, as baby boomers entered their middle and later teens through the 1960s and numbers of non-marital births and hence — given prevailing views as to the best interests of those children — adoptions increased rapidly, the seeds of a concerted challenge to life prescriptions centred on the breadwinner model of the family were sown. The advent of oral contraception and the denial of access to it to the unmarried until shortly before they did marry were important catalysts for revolution. The capacity the pill conferred to control fertility was soon widely appreciated, and indignation that preventable pregnancies were being allowed to dictate the courses of young women‘s lives became increasingly shrill. Not only was access to this new technology demanded; so, too, was access to the ultimate safety net, induced abortion. Control over unwanted reproductive consequences of sexual engagement was key to being able to control one‘s life.
Through the second half of the 1960s there was, in Australia, a brief resurgence of the trend to earlier marriage among couples who recognized that the pill, in allowing them to defer parenthood indefinitely, enabled them to respond to peer pressure to be sexually active without compromising their parents‘ values. But it was inevitable once first birth intervals began to lengthen (Carmichael 1988, Table 6) that the need to marry to enjoy childless co-residence with an intimate partner would be challenged, and living together, at least as a precursor to marriage, would become commonplace. Rising divorce rates only enhanced this inevitability as it was appreciated that many of the youthful, often pregnancy-precipitated marriages of the 50s and 60s were foundering.
honourable response to unintended non-marital pregnancy was quickly massive, and ultimately almost total. Abortion and welfare-supported sole parenthood were preferable alternatives. The temporary nature of the simultaneous decline in rates of non-marital conception leading to non-marital confinement simply reinforces how rapidly consensual partnering and family formation were embraced by young Australians once confident enough to jettison elements of Judeo-Christian morality that no longer made sense in an age of unprecedented capacity to control fertility. Having children without committing to marriage became ever more normal and accepted, and while having them at all at younger reproductive ages was increasingly viewed as not the most sensible way to arrange one‘s life, marrying to have them at those ages was even less attractive. Teenagers today, if they give birth at all, overwhelmingly do so unmarried (Figure 3). Teenage brides remain the most likely to be pregnant, but the probability of their being pregnant is one-third of what it was in the mid-1960s (Figure 4) and they are now so few in number that pregnant teenaged brides are a seriously threatened species bordering on extinction. Legitimation of non-maritally conceived children, well above a majority occurrence at ages 1619 and 2024 in the early 1970s, is today a well below 10% minority occurrence at all reproductive ages, and almost unheard of among teenagers carrying non-marital pregnancies to term (Figure 5). This is another index that dramatically captures the extent of change in societal values.
The changing age compositions of both marital and non-marital confinements following non-marital conception provide further powerful images of social change under the second demographic transition. Teenagers, formerly major players through their vulnerability to unintended pregnancy in typically non-co-residential relationships poorly protected by contraception, are now minor contributors to a scene dominated by planned conceptions at normative reproductive ages within consensual unions (Figure 6). As far as the greatly diminished pool of marital compared to non-marital confinements following non-marital conception (Figure 5) is concerned, instances, once common, where pregnancy followed tentative first attempts at coital intimacy with weddings imminent appear to have been rare for some time (Figure 7). Premarital cohabitation is now the norm, and concern that marriages involving pregnancy be as little delayed as possible has largely dissipated now that it rather than a ‗baby bump‘ implies sexual intimacy. Indeed the latter may nowadays often be a cause for celebration rather than a symbol of social impropriety to be hidden. Recent steeply rising duration 03 months shares of premaritally conceived marital confinements, at younger reproductive ages to highest recorded levels (Figure 7), certainly suggest a rather carefree contemporary attitude to pregnant brides‘ physical appearance.
References
Adelson, P.L., Frommer, M.S., and Weisburg, E. (1995). A survey of women seeking termination of pregnancy in New South Wales. Medical Journal of Australia
163(8): 419422.
Aitchison, R. (1972). Thanks to the Yanks? The Americans and Australia. Melbourne: Sun Books.
Australian Senate. (2012). Commonwealth contribution to former forced adoption policies and practices. Australian Journal of Adoption 5(1).
Basavarajappa, K.G. (1968). Pre-marital pregnancies and ex-nuptial births in Australia,
191166. Australian and New Zealand Journal of Sociology 4(2): 126145.
doi:10.1177/144078336800400205.
Beck, U., Giddens, A., and Lash, S. (1994). Reflexive modernization: Politics, tradition
and aesthetics in the modern social order. Cambridge: Polity Press.
Carmichael, G.A. (1985). Non-marital pregnancies in New Zealand since the second world war. Journal of Biosocial Science 17(2): 167183. doi:10.1017/ S0021932000015625.
Carmichael, G.A. (1986). Birth order in Australian vital statistics. Journal of the
Australian Population Association 3(1): 2739.
Carmichael, G.A. (1988). With this ring: First marriage patterns, trends and prospects
in Australia. Canberra: Department of Demography, Australian National
University and Australian Institute of Family Studies.
Carmichael, G.A. (1996). From floating brothels to suburban semirespectability: Two centuries of nonmarital pregnancy in Australia. Journal of Family History 21(3): 281315. doi:10.1177/036319909602100303.
Carmichael, G.A. (1998). Things ain‘t what they used to be! Demography, mental cohorts, morality and values in post-war Australia. Journal of the Australian
Population Association 15(2): 91113.
Carmichael, G.A. (2013a). Decisions to have children in late 20th and early 21st century
Australia: A qualitative analysis. Dordrecht: Springer.
doi:10.1007/978-94-007-6079-0.
Carmichael, G.A. (2013b). Estimating paternity in Australia, 1976-2010. Fathering
Carmichael, G.A., Webster, A., and McDonald, P. (1997). Divorce Australian style: A demographic analysis. Journal of Divorce and Remarriage 26(3/4): 337. doi:10.1300/J087v26n03_02.
Chan, A. and Sage, L.C. (2005). Estimating Australia‘s abortion rates 19852003.
Medical Journal of Australia 182(9): 447452.
Chan, A. and Taylor, A. (1991). Medical termination of pregnancy in South Australia:
The first 20 years 19701989. Adelaide: South Australian Health Commission.
Chan, A., Scheil, W., Scott, J., Nguyen, A-M., and Sage, L. (2011). Pregnancy outcome
in South Australia 2009. Adelaide: Pregnancy Outcome Unit, South Australia
Health.
Corr, P. and Kippen, R. (2006). The case for parity and birth-order statistics. Australian
and New Zealand Journal of Statistics 48(2): 171200. doi:10.1111/
j.1467-842X.2006.00433.x.
Drago, R., Sawyer, K., Shreffler, K.M., Warren, D., and Wooden, M. (2011). Did Australia‘s baby bonus increase fertility intentions and births? Population
Research and Policy Review 30(3): 381397. doi:10.1007/s11113-010-9193-y.
Gillard, J. (2013). National apology for forced adoptions. Australian Journal of
Adoption 7(1).
Graham, T. (2012). Apology season. Australian Journal of Adoption 4(1).
Grayson, N., Hargreaves, J., and Sullivan, E.A. (2005). Use of routinely collected
national data sets for reporting on induced abortion in Australia. Sydney:
Australian Institute of Health and Welfare National Perinatal Statistics Unit. Kenny, P., Higgins, D., Soloff, C., and Sweid, R. (2012). Past adoption experiences –
National research study on the service response to past adoption practices.
Melbourne: Australian Institute of Family Studies.
Kiernan, K. (2001). The rise of cohabitation and childbearing outside marriage in Western Europe. International Journal of Law, Policy and the Family 15(1): 121. doi:10.1093/lawfam/15.1.1.
Lattimore, R. and Pobke, C. (2008). Recent trends in Australian fertility. Canberra: Australian Government Productivity Commission.
McDonald, P. (1974). Marriage in Australia: Ages at first marriage and proportions
marrying, 18601970. Canberra: Australian National University.
McDonald, P. (2006). Low fertility and the state: The efficacy of policy. Population
and Development Review 32(3): 485510. doi:10.1111/j.1728-4457.2006.
00134.x.
McDonald, P. and Reimondos, A. (2013). Relationship pathways and first birth in Australia. In: Evans, A. and Baxter, J. (eds) Negotiating the life course: Stability
and change in life pathways. Dordrecht: Springer: 6998. doi:10.1007/
978-90-481-8912-0_5.
McKernan, M. (1983). All in! Australia during the second world war. Melbourne: Nelson.
Moor, M. (2006). Silent violence: Australia‘s white stolen children. [PhD thesis]. Brisbane: Griffith University, School of Arts, Media and Culture.
Moore, J.H. (1981). Over-sexed, over-paid and over here: Americans in Australia 19411945. St Lucia, Brisbane: University of Queensland Press.
Nickson, C., Shelley, J., and Smith, A. (2002). Use of interstate services for the termination of pregnancy in Australia. Australian and New Zealand Journal of
Public Health 26(5): 421425. doi:10.1111/j.1467-842X.2002.tb00341.x.
Nickson, C., Smith, A.M.A., and Shelley, J.M. (2004). Intention to claim a medicare rebate among women receiving private Victorian pregnancy termination services. Australian and New Zealand Journal of Public Health 28(2): 120123. doi:10.1111/j.1467-842X.2004.tb00923.x.
NSW Department of Child Welfare. (1966). Annual report: Child welfare department
of New South Wales, 1965-66. Sydney: Government Printer.
Office of Road Safety. (1984). Road traffic accident data and rates: Australia, states
and territories 1925 to 1981. Canberra: Office of Road Safety.
Parr, N. and Guest, R. (2011). The contribution of increases in family benefits to Australia‘s early 21st
-century fertility increase: An empirical analysis.
Demographic Research 25(6): 215244. doi:10.4054/DemRes.2011.25.6.
Risse, L. (2010). ‗… And one for the country‘. The effect of the baby bonus on Australian women‘s childbearing intentions. Journal of Population Research
27(3): 213240. doi:10.1007/s12546-011-9055-4.
Ruzicka, L.T. (1975). Non-marital pregnancies in Australia since 1947. Journal of
Biosocial Science 7(2): 113132. doi.10.1017/S0021932000000286.
Ruzicka, L.T. (1976). Age at marriage and timing of the first birth. Population Studies
30(3): 527538.doi:10.2307/2173749.
Ruzicka, L.T. (1977). Premarital pregnancies in Australia. Journal of Marriage and the
Family 39(2): 387395. doi:10.2307/351133.
Santow, G. (1991). Trends in contraception and sterilization in Australia. Australian
and New Zealand Journal of Obstetrics and Gynaecology 31(3): 201208.
doi:10.1111/j.1479-828X.1991.tb02781.x.
Spencer, G. (1969). Pre-marital pregnancies and ex-nuptial births in Australia, 191166 – a comment. Australian and New Zealand Journal of Sociology 5(2): 121127. doi:10.1177/144078336900500204.
Stloukal, L. (1997). Changing patterns of extramarital conceptions in the Czech Republic, 196093. Journal of Biosocial Science 29(4): 471489. doi:10.1017/ S0021932097004719.
Sturma, M. (1989). Loving the alien: The underside of relations between American servicemen and Australian women in Queensland, 1942-1945. Journal of
Australian Studies 13(24): 317. doi:10.1080/14443058909386990.
van de Kaa, D.J. (1987). Europe‘s second demographic transition. Population Bulletin
42(1): 157.