University of New Orleans University of New Orleans
ScholarWorks@UNO
ScholarWorks@UNO
University of New Orleans Theses and
Dissertations Dissertations and Theses
Fall 12-15-2012
Application of Web Mashup Technology to Oyster Information
Application of Web Mashup Technology to Oyster Information
Services
Services
Christian Chuindja Ngniah
University of New Orleans, [email protected]
Follow this and additional works at: https://scholarworks.uno.edu/td
Part of the Aquaculture and Fisheries Commons, Databases and Information Systems Commons, and the Other Computer Sciences Commons
Recommended Citation Recommended Citation
Chuindja Ngniah, Christian, "Application of Web Mashup Technology to Oyster Information Services" (2012). University of New Orleans Theses and Dissertations. 1568.
https://scholarworks.uno.edu/td/1568
This Thesis is protected by copyright and/or related rights. It has been brought to you by ScholarWorks@UNO with permission from the rights-holder(s). You are free to use this Thesis in any way that is permitted by the copyright and related rights legislation that applies to your use. For other uses you need to obtain permission from the rights-holder(s) directly, unless additional rights are indicated by a Creative Commons license in the record and/or on the work itself.
Application of Web Mashup Technology to Oyster Information Services
A Thesis
Submitted to the Graduate Faculty of the University of New Orleans in partial fulfillment of the requirements for the degree of
Master of Science in
Computer Science
Database Systems and Distributed Applications
by
Christian Chuindja Ngniah
B.S. University of New Orleans, 2010
Acknowledgment
Foremost, I would like to express my sincere gratitude to my advisor Professor Shengru Tu for
the continuous support of my Masters Study and research, for his patience, motivation, and
enthusiasm.
I would also like to thank my thesis committee: Dr. Mahdi Abdelguerfi and Dr. Thomas Soniat
for their encouragement and guidance, and Ms. Susan Colley Theodosiou.
I thank my fellow lab mates working with me on the Oyster Sentinel project: Nathan Cooper and
Janak Dahal for the stimulating discussions and for all the fun we have had in the last eighteen
months. Also I thank my friends: Siegfried Kamga, Herbert and Arlene Twase, and Claire
McDaniels for their support.
I would like to specially thank Mr. Stephen Sontiag at Applied Sciences Associates for his
assistance.
Last but not the least, I would like to thank my family: my parents Michel and Ruth Ngniah, for
giving birth to me at the first place and supporting me spiritually throughout my life. Much
consideration also goes to my siblings: Jean-Claude, Bertrand, Guy, Melanie, and Valery for
Table of Contents
List of Figures ...v
Abstract ... vii
Chapter 1: Introduction ...1
Chapter 2: Background ...2
2.1 Web application ...2
2.2 Web services ...2
2.3 Web mashup...2
2.4 Drupal ...3
2.5 Google Maps ...4
2.6 OceansMap ...5
2.7 jQuery ...6
Chapter 3: Design ...7
3.1 System Structure ...7
3.1.1 Web applications in content management systems ...7
3.1.2 A design following MVC ...9
3.2 Perkinsus marinus Model ...10
3.3 Oil Spill Model ...12
3.4 Fisheries Web-based Service ...14
Chapter 4: Implementation ...15
4.1 System Structure ...15
4.2 Perkinsus marinus Model ...16
4.2.1 Areas selection ...19
4.2.2 Stations selection ...23
4.2.3 Data page ...25
4.3.1 Mapping service ...28
4.3.2 Stations ...29
4.3.3 Oil spills manager ...29
4.3.4 Prediction tool ...35
4.3.5 Query tool ...41
4.4 Fisheries Web-based Services...45
4.4.1 Query functions ...47
4.4.2 fisheries.php ...48
4.4.3 fisheries.js ...49
4.4.4 Examples of Web mashups using the Fisheries API ...50
Chapter 5: Conclusion...57
References/Bibliography...58
List of Figures
Figure 1 – Drupal Communication Diagram ...3
Figure 2 – Web Applications in Drupal using an extra server and database ...8
Figure 3 – Communication Diagram: Drupal & MVC ...9
Figure 4 – Perkinsus marinus Model Communication Diagram ...11
Figure 5 – Oil Spill model Communication Diagram ...13
Figure 6 – Fisheries API Abstract Communication diagram ...14
Figure 7 – Entity-Relationship Diagram- Perkinsus marinus model...17
Figure 8 – Schema Diagram - Perkinsus marinus model ...18
Figure 9 – Areas Class Diagram ...19
Figure 10 – Areas page ...22
Figure 11 – Stations Class Diagram...23
Figure 12 – Stations page (Barataria Bay stations) ...24
Figure 13 – Add Data form ...25
Figure 14 – Calculating the percent infection, infection intensity, weighted prevalence ..26
Figure 15 – Data for Stations ...26
Figure 16 – Areas Class Diagram ...27
Figure 17 – Components of Oil Spill Model ...29
Figure 18 – Entity-Relationship Diagram- Oil Spill model ...30
Figure 19 – Schema Diagram - Oil Spill model ...30
Figure 20 – Oil Spills manager ...31
Figure 21 – Oil Spills manager Class Diagram ...31
Figure 22 – Oil Spill profile page ...32
Figure 23 – Oil Spill Viewer ...35
Figure 24 – OceansMap: Creating an Oil Spill scenario ...36
Figure 26 – OceansMap: Other GIS functions available ...37
Figure 27 – OceansMap - Oil Spill Model Communication Diagram ...38
Figure 28 – Oil Spill Prediction tool ...40
Figure 29 – Stations currently overlaid by the oil spill ...42
Figure 30 – Stations within twenty-five miles of oil spill projection ...44
Figure 31 – Fisheries API Abstract Communication diagram ...46
Figure 32 – Fisheries API Communication Diagram ...46
Figure 33 – Web mashup Example #1 ...51
Figure 34 – Web Mashup Example #2 ...55
Figure 35 – User selects an area (circle) and gets data on closest stations ...55
Abstract
Web mashup is a lightweight technology used to integrate data from remote sources
without direct access to their databases. As a data consumer, a Web mashup application creates
new contents by retrieving data through the Web application programming interface (API)
provided by the external sources. As a data provider, the service program publishes its Web API
and implements the specified functions.
In the project reported by this thesis, we have implemented two Web mashup applications
to enhance the Web site oystersentinel.org: the Perkinsus marinus model and the Oil Spill
model. Each model overlay geospatial data from a local database on top of a coastal map from
Google Maps. In addition, we have designed a Web-based data publishing service. In this
experimental system, we illustrated a successful Web mashup interface that allows outside
developers to access the data about the local oyster stock assessment.
Chapter 1:
Introduction
In 2009, Florida, Alabama, Mississippi, Louisiana, and Texas produced 61% of oysters
for our entire nation’s annual consumption [LWF, 2009]. Oyster Sentinel (oystersentinel.org) is
a Web-based community monitoring the environmental health of estuaries along the Gulf of
Mexico. The main purpose of this Web site is to evaluate the freshwater resources needed to
sustain oysters, control parasites and predators, and support other estuarine-dependent
organisms. Modeling tools are provided to assess the condition of oysters in stations along the
Gulf coast. The following features are included among the collection of modeling tools: the
Habitat and Restoration Suitability Indices that assess the impact of salinity alterations on oyster
habitat and on reef restoration and the Oyster Sustainability Model that simulates effects of
fishing on oyster habitat.
In the efforts to enhance oystersentinel.org, we have designed and implemented two
models: the Perkinsus marinus model that assesses the extent of oyster infection by the parasite
Perkinsus marinus and the Oil Spill model that assesses the impact of oil spills on oyster habitat.
In building these two capabilities, we have applied Web Mashup techniques and used large
portions of data that are provided by external resources such as Google Maps, the Louisiana Oil
Spill Coordinator's Office (LOSCO), the Environmental Response Management Application
(ERMA), and the National Oceanic and Atmospheric Administration (NOAA). The Web
Mashup technology gives developers tools to consume external resources, as well as tools to
create interfaces to internal data. To investigate the latter capability, we have constructed a Web
interface that will allow the programs developed by third party developers to use
Chapter 2:
Background
2.1 Web application
A Web application is an application that is accessedover a network and that is essentially
a user-to-machine communication. It is stored and used from a server and users can access it via
a Web site. Web applications on oystersentinel.org are implemented using PHP and run on an
Apache server.
2.2 Web services
Contrary to a Web application, in which humans interact with a remote program across
the Internet, a Web service is a machine-to-machine communication. The World Wide Web
Consortium (W3C) describes a Web service as a software system designed to support
interoperable machine-to-machine interaction over a network. It allows two remote machines to
exchange XML formatted messages via HTTP.
2.3 Web mashup
A Web mashup is a hybrid Web application that fetches data from two or more sources
and displays it with an entire new intent. IBM describes Web mashups as a genre of interactive
Web applications that draw upon content retrieved from external data sources to create new and
innovative services [Merrill, 2006].
- WeatherBonk.com, which combines Google Maps, WeatherBug, and National
Weather Service to provide a weather forecaster and traffic reporter.
- HousingMaps.com, which combines Google Maps and housing posts on Craigslist
to provide listing of houses for sale or for rent on a detailed map.
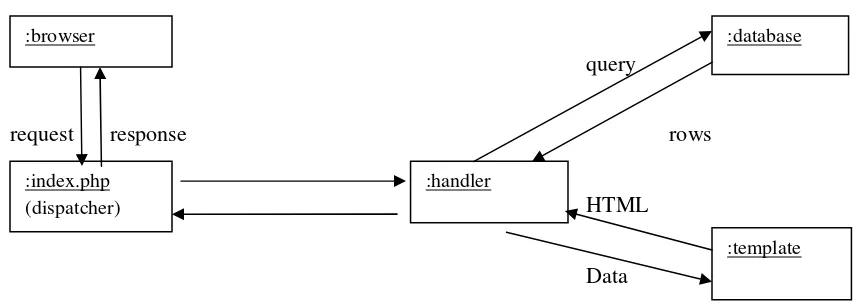
2.4 Drupal
Drupal is open source content management system (CMS). It is Web-based and requires
an Apache or Microsoft IIS server, PHP (version 5.2 or higher), and a MySQL or PostgreSQL
database engine to deploy a Web site [Drupal, 2012]. It is mainly used to allow non-Web
developers to manage Web sites. In its core, Drupal is backed by a database where content,
metadata, and configuration details are stored. When a request for a Web page is made, Drupal
fetches the content from the database and builds the page using a template. Figure 1 illustrates
the main components of a Drupal installation and the interactions between a Web page request
and a response.
query
request response rows
HTML
Data
Figure 1 - Drupal Communication Diagram :browser
:index.php (dispatcher)
:handler
:database
In a CMS, users’ management, user interface enhancement, and security are elements that
improve the quality of a Web site. In Drupal, these capabilities are encapsulated in modules. A
module is an extension or plug-in that adds functionality to a Web site. A collection of modules
provides additional features to a Drupal installation.
From an end-user's perspective, Drupal provides an intuitive interface to search for
modules and install them in one click. From a developer's perspective, Drupal allows
programmers to create modules in four main steps: create the module folder (path:
sites/all/modules), create the module file (.module extension), create a <modulename>.info file
to tell Drupal about the module, and implement hooks, which are PHP functions to facilitate the
integration of the module into the actions of Drupal core. A module is automatically bound to
Drupal's database. Many built-in functions are available to configure the module, validate data,
or query the database.
2.5 Google Maps
Google Maps is a Web service from Google that allows Web developers to easily add
maps functionality to a Web site [Google, 2012]. The service can be consumed through its Maps
JavaScript interface version 3.9, which is the latest version released. With its rich collection of
classes to manipulate geographic data, Google Maps is a common data source for Web mashups.
The models on oystersentinel.org primarily use classes from the main library:
- google.maps.Marker to place stations on the map (Perkinsus marinus & Oil Spill
models).
- google.maps.InfoWindow to display additional information about a station.
- google.maps.Polygon to display oil spills on the map (Oil Spill model).
Google Maps also provides libraries to compute distances and draw shapes on a map:
- Geometry library: google.maps.geometry.spherical to compute geodesic distances (Oil
Spill model), google.maps.geometry.poly to check if a polygon contains a marker (Oil
Spill model).
- Drawing library: google.maps.drawing.DrawingManager, google.maps.Circle &
google.maps.Rectangle to allow users to draw shapes on a map (Fisheries Web-based
service).
- Visualization library: google.maps.visualization.HeatmapLayer to show weighted
markers on a map (Fisheries Web-based service).
2.6 OceansMap
Developed by RPS - Applied Sciences Associates, OceansMap is an online interactive
Web-based oil spill simulation and spill response system, which consists of a GIS-based
graphical user interface, a spatial database and Web services from MapSERVER and the
Environmental Data Server (EDS) [ASA, 2012]. This service is primarily used to predict the path
of an oil spill. It can also be used to improve the response to a disaster and minimize the
interface for users to enter data and run the prediction model. The Web mapping service presents
the output as a series of projected snapshots of the oil spill. It provides tools to predict and
analyze an oil spill and is a key component of the Oil Spill model.
2.7 JQuery
JQuery is a fast and concise JavaScript Library that simplifies HTML document
traversing, event handling, animating, and Ajax interactions for rapid Web development [The
jQuery Foundation, 2012]. It is cross-browser, meaning that it abstracts the JavaScript
interpreters found in the main browsers. Mozilla, Google, Opera, Internet Explorer and Safari
have a different JavaScript interpreter on their respective browser and using JQuery in our
project helps create reliable scripts that will run smoothly on any browser. The Web site
oystersentinel.org mainly uses handler functions because it allows programmers to implement
specific behaviors when an action is triggered on a Web page. The main handlers used are:
- jQuery(<button>).click( function( ){ } ) when a user clicks on a button
- jQuery(<dropdown>).change( function( ){ } ) when a user selects an option in a
dropdown list
- jQuery(<button>).submit( function( ){ } ) when a user submits a form
- jQuery.ajax( function( ) { } ) when making Ajax calls. An Ajax call is an asynchronous
Chapter 3:
Design
Designing a model involves understanding the components interacting in the system and
the data passed and returned by each of them. The design also involves the structure of the
platform, the database schema, and external resources.
3.1
System Structure
3.1.1 Web applications in Content Management System
The Web site oystersentinel.org is a platform to inform marine biologists, fishermen, or
any concerned parties in the states of the Gulf of Mexico about the oysters in the area. In
addition to periodically updating the content of Web pages, the Web site manager also needs to
manage news and alerts. However, scientific data and information are often managed by a
scientist rather than a software engineer. In these cases, using a content management system
(CMS) provides a solution. A CMS is a system used to manage the content of the Web site
oystersentinel.org. It allows the content manager to create, edit, and remove content from a Web
site without needing a technician such as a Web master. The chosen CMS is Drupal. It provides
management tools and an intuitive user interface for content managers.
The Web applications implemented in oystersentinel.org need internal data to be stored
in a more secure and performing database, and require external data sources to be integrated.
There are at least two methods to meet this need. One method is to create a Drupal module that
server to provide that connection. Figure 2 is the communication diagram of a Drupal installation
using an extra server to connect to a second database.
request request
response response
request query
external data rows
Figure 2 - Web Applications in Drupal using an extra server and database
Another method is to use a controller following the MVC design pattern. When a user
sends a request, Drupal processes it (Figure 1) and creates the HTML page with a template. We
created a bridge between Drupal and our MVC-designed application by including the controller
when our modeling tool is requested (see code snippet below). When included, the controller
builds the view and appends it to Drupal's template. This is a more flexible design approach that
can facilitate the interaction between the second database and the applications on
oystersentinel.org.
<?php
if(strpos($_SERVER['REQUEST_URI'], '/?q=areas') !== false){ include 'mvc/controllers/areas_controller.php';
}elseif(strpos($_SERVER['REQUEST_URI'], '/?q=map_stations') !== false){
include 'mvc/controllers/stations_controller.php';
} elseif(strpos($_SERVER['REQUEST_URI'], '/?q=stations_data') !== false){
include 'mvc/controllers/data_controller.php'; }
?>
:external data sources
:database 2 :server 2 :drupal(figure 1)
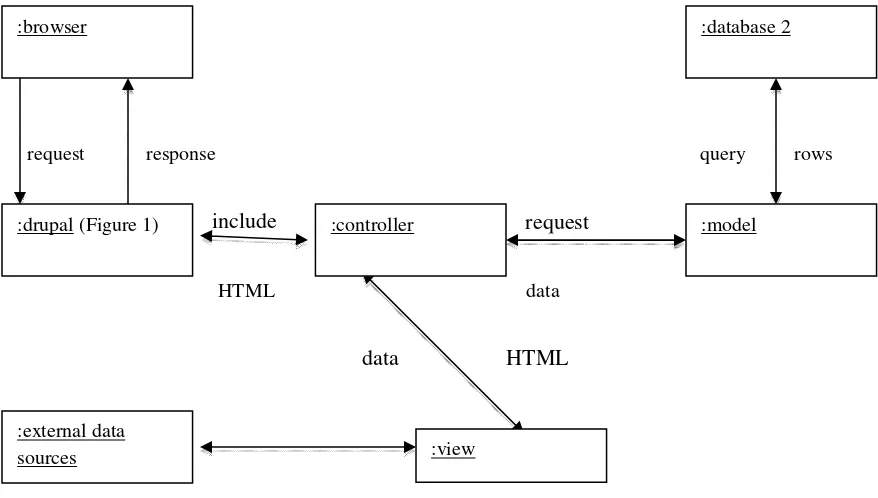
3.1.2 A Design following MVC
MVC stands for Model – View – Controller and it is a design pattern that aims to
separate the data, its manipulation, and its presentation. The model is in charge of saving and
fetching data. The controller manipulates the data fetched by the model and the view presents
them to the user. Regardless of the type of data storage and the programming language, MVC
patterns promote code reusability and isolation of business logic from user interface.
request response query rows
include request
HTML data
data HTML
Figure 3 - Communication Diagram: Drupal & MVC
The controller is the main component of a MVC structure. It retrieves data via the model
and uses views to create the Web pages. It fits well with the capabilities we are developing on
oystersentinel.org. The controller contains the code necessary to interact with the model and the
:browser
:external data sources
:controller
:database 2
:drupal (Figure 1)
:view
view, and run the model. To apply this design to the Drupal CMS system, it needs to be invoked
by client’s request through Drupal’s template (Figure 1).
3.2
Perkinsus marinus
Model
Perkinsus marinus is a bio-indicator of mesohaline salinity regimes and is the principal
parasite of Crassostrea virginica, also called eastern oyster, a species of oyster native to the Gulf
of Mexico. The primary goal of this model is to help assess the level of infection of oysters along
the Gulf coast. For data collection, the Gulf of Mexico is divided into eighteen areas in which
there are more than seventy stations. Each area has at least one station and each station has an
owner who is a biologist in charge of collecting data. The periodically collected data includes the
quantity of sampled oysters, their size, and the quantity of sampled oysters infected by Perkinsus
marinus. Monitoring the health of oysters with this model is vital in order to preserve and
maintain a sustainable quantity of oysters because a high level of infection could be an indicator
of oyster mortality.
The Perkinsus marinus model can be accessed by different type of users: Website
administrators, station owners, and general users. In order to maintain a reliable dataset and
provide proper privileges to each user, it is important to set up an assets manager. This manager
grants features to users according to their privileges. For example, an owner can add a station,
edit or delete owned stations, and manage the data. A general user can only view areas, stations,
:map
Figure 3
Communication Diagram: Drupal & MVC
Administrator Owner General User
Area A, E, D, V V V
Station A, E, D, V A, E*, D*, V V
Data A, E, D, V A*, E*, D*, V V
Legend: A - Add, E - Edit, D - Delete, V - View; * only owned station
The assets manager follows the MVC design pattern and each component (Areas,
Stations, and Data) has a controller that manages a part of the application. Owners are the
primary source of information in this model. They collect data at their stations and enter them
into the system. They can also run the model and get a result that is descriptive of the health of
oysters at their stations. It is imperative to build a user interface that allows them to easily select
any owned stations and enter the data with a minimum risk of errors. For cases in which areas
and stations have location coordinates, using a map will enrich the interface and provide a visual
representation of the managed assets.
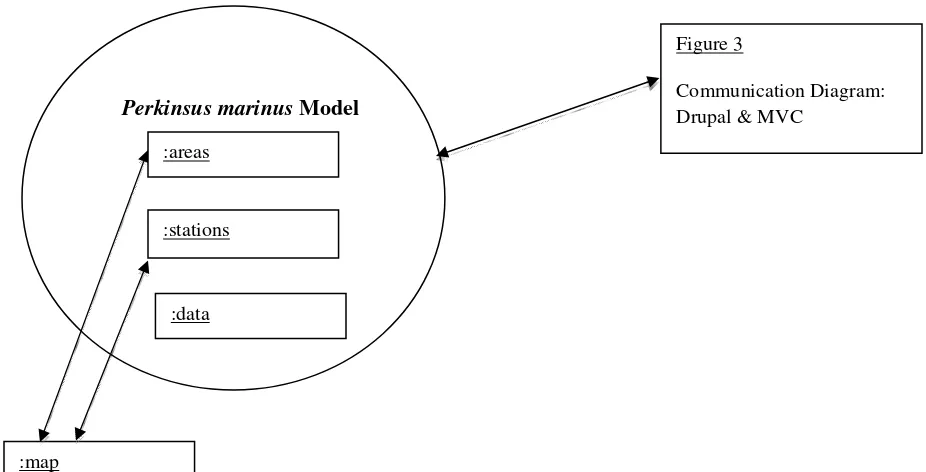
Perkinsus marinus Model
Figure 4 - Perkinsus marinus Model Communication Diagram :areas
:stations
Figure 4 illustrates the components that are active in the Perkinsus marinus model. The
system follows the MVC pattern and allows us to implement the Web application without using
Drupal modules. It also gives us a quicker way to integrate a map from an external data source.
3.3
Oil Spill Model
The Oil Spill model is a geospatial model that provides a comprehensive set of
capabilities in data retrieval and is implemented with a focus set on information and
decision-making about oyster habitat environments. After the explosion of Deepwater Horizon in April
2010, authorities and experts have been trying to implement solutions that will effectively reduce
the impact of similar disasters in the future. The Deepwater Horizon oil spill released about 5
million barrels of crude oil in the Gulf of Mexico between April and July of 2010 [Soniat, 2011].
It is considered the largest environmental disaster in U.S. history, with extensive damage to
marine and wildlife habitats in the Gulf of Mexico. The Oil Spill model is to help decision
makers and domain experts to evaluate impact of oil spills to oyster resources, predict time and
place of impact, decrease response time, prioritize efforts, and even assist in the determination of
monetary damages.
The first step in designing this model is to select the resources. In the event of an oil spill,
oyster reefs are the assets being monitored. In the design of the Perkinsus marinus model, we
introduced a second database that is used to store data on oysters and their stations. It is a natural
choice to get station data from the same database.
The second step consists of finding reliable data sources about oil spills. When an oil spill
informing the general public. The Louisiana Oil Spill Coordinator's Office (LOSCO), the
Environmental Response Management Application (ERMA), and the National Oceanic and
Atmospheric Administration (NOAA) are well known for their efforts in 2010 in the Deepwater
Horizon oil spill. The Oil Spill model can use them to gather information on an oil spill and its
progression. With these external data in the model, experts would have access to a more
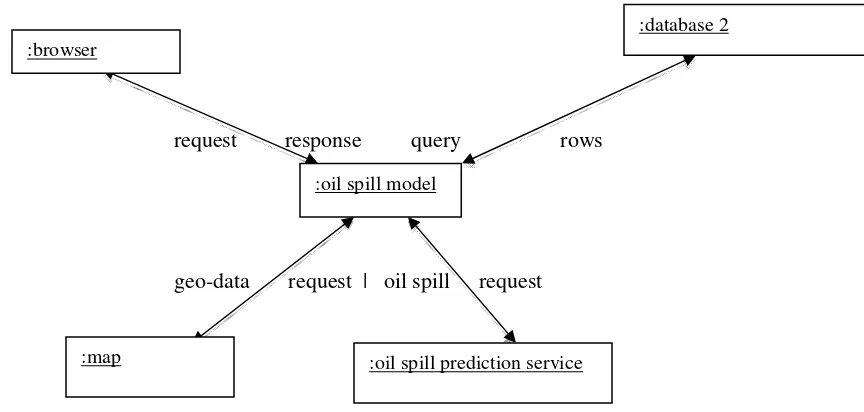
comprehensive analysis. The particularity about the Oil Spill model is its prediction feature.
Domain experts can use this feature to analyze the course of an oil spill and detect the resources
(oyster reefs) that need to be prioritized. This will reduce response time and help in protecting
oysters in danger. The prediction tool requires access to weather data such as currents, winds,
and temperature. It also requires the use of a reliable mathematical equation that will produce the
path of the oil spill at a specific time. However, developing it in-house would demand extensive
hours of programming and the outcome might not be efficient. Instead, the Oil Spill model
would consume a proven and reliable Web service to complement the prediction tool.
request response query rows
geo-data request | oil spill request
Figure 5 – Oil Spill model Communication Diagram :browser
:database 2
:oil spill model
:developer :Fisheries Web-based service
:database 2
3.4
Fisheries Web-based Service
Web mashup techniques promote data reusability by allowing developers to consume
external data into their Web application. However, a large percentage of Web sites provide data
on their platform but do not implement interfaces for developers to access those data. This
limitation negatively affects the development of rich and reliable Web applications. The
Fisheries Web-based service is designed solely for the purpose of understanding programming
interfaces and the methods to access them externally. It is not a live interface.
The interface will allow outside programmers to use internal data in external applications
without compromising the reliability and the validity of those data. For security reasons, it is
imperative to hide the structure of the database. Outside developers do not need to know the type
of database, the tables, nor the query language used internally. The primary objective of the
interface is to abstract this information. Its second objective is to grant read-only access to a
specific set of data. Figure 6 describes how the Fisheries API interacts with the other components
of the system.
request query
response data
Chapter 4:
Implementation
Using the design described in chapter 3, we now are to implement each application. It
involves primarily configuring the system structure and the database, and then writing code for
each component in the design.
4.1
System Structure
In section 3.1, we described the system structure of oystersentinel.org, the framework
used, and the solution to deploy our Web applications. For security and performance reasons, the
Web applications implemented on the Web site are backed by a Microsoft SQL Server (MSSQL)
database instead of the Drupal's MySQL content database. MSSQL is commonly used for Web
applications on a Windows platform. It also provides buffer management, transparent data
encryption, and enterprise-level management tools for developers. With the Web site hosted on a
Windows server machine, it is a natural choice to use a MSSQL database to store sensitive data
on oysters.
As described in section 3.1.3, the MVC model component handles access to the database.
It encapsulates the most commonly needed functions such as connecting to the database, running
a query, getting a specific row, or getting all the rows. Thus, we have implemented a "generic"
component, model.php, located in the /mvc/models folder.Any PHP function can use this
component by including this file in it. It contains the following functions:
- runSQL($sql, $params, $id) : takes a SQL query and its parameters and runs it on the
database. It will return the corresponding rows or a boolean.
- get($table, $id): fetches a row in a table with the specified id.
<?php
function get($table, $id){ if($id == 0){
$query = "SELECT TOP 1 * FROM ".$table; $params = array();
} else {
$query = "SELECT * FROM ".$table." WHERE id = ?";
$params = array(0 => array('value' => $id, 'type' => PDO::PARAM_INT)); }
return runSQL($query, $params); }
?>
- getAll($table, $order_by): returns all the rows of a table, and order it if specified.
<?php
function getAll($table, $order_by = ''){ $query = "SELECT * FROM ".$table; if(!empty($order_by)){
$query .= " ORDER BY ".$order_by; }
return runSQL($query); }
?>
4.2
Perkinsus marinus
Model
The Perkinsus marinus model is built around two major pieces: the assets manager and
the mapping service. The assets manager provides the forms to manage oysters and handles user
privileges. Using Drupal's global variable $user, the assets manager can determine the role of a
areas
stations data
contain many
in the visual aspect of the application. Google provides maps and directions on their Web site
maps.google.com and has developed an API that allows developers to use their maps on any
Web sites. Built with JavaScript, Google Maps API is a client-side service running on the user's
browser. Any browser with a JavaScript interpreter can run Google Maps. Google Maps has also
a wide array of classes and functions that developers can use to overlay their data on top of a
map.
The Perkinsus marinus model's main functionalities are for an owner to: add data about
sampled oysters in a station, run the model, and analyze the level of infection. Figures 7 & 8
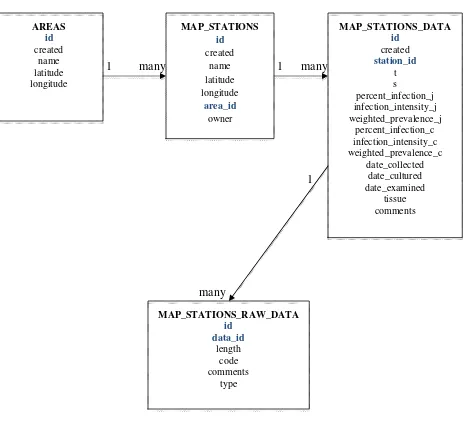
show the complete database structure of this model.
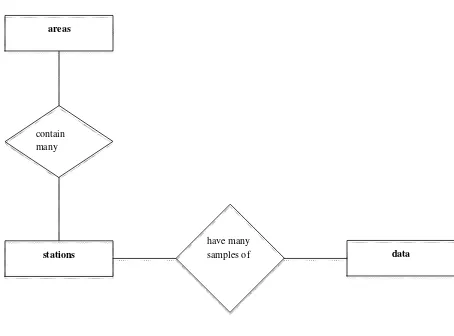
Figure 7 - Entity-Relationship Diagram- Perkinsus marinus model have many
AREAS id created name latitude longitude MAP_STATIONS id created name latitude longitude area_id owner MAP_STATIONS_DATA id created station_id t s percent_infection_j infection_intensity_j weighted_prevalence_j percent_infection_c infection_intensity_c weighted_prevalence_c date_collected date_cultured date_examined tissue comments MAP_STATIONS_RAW_DATA id data_id length code comments type
1 many 1 many
1
many
Figure 8 - Schema Diagram - Perkinsus marinus model
The user interface for this model is made up of three pages that will guide the user and minimize
controller
File: controllers/ area_controller. php
model
File: models/area. php Functions: add(data), edit(data), delete(data), validate(data) view
File: views/areas. php
Forms: add, edit, delete, view stations
4.2.1 Areas Selection
Before selecting a station, a user first selects its area. To implement the areas page, we
created a controller, a model, and a view. The interface of the areas page is composed of a map
from Google Maps showing all the areas currently in the system and all the forms accessible by
the current user. The following class diagram shows the different components and their actions.
Figure 9 - Areas Class Diagram
The controller in this application is invoked from Drupal's template page (Figure 1) and
its role is to fetch all the areas from the database and handle any form submission (see code
snippet below).
<?php
// Include areas model which contains functions to interact with the 'areas' table
include dirname(__FILE__).'/../models/area.php';
$areas = getAll('AREAS', 'name'); // Retrieving all the areas
// Add an area
if(isset($_POST['add_area'])){
$data['name'] = $_POST['add_area_name']; $data['latitude'] = $_POST['add_area_lat']; $data['longitude'] = $_POST['add_area_long'];
$valid = validate($data); // Validate Data submitted $err = "";
if($valid) add($data); // Save data in database else $err = "&error=true";
By including the model, the controller can use the functions getAll(), validate(), and add()
to fetch and save data in the database. It also uses the edit function when an administrator edits
an area, or the delete function when an administrator deletes an area.
The area model includes the "generic" model as described in section 4.1 and implements
the functions add() (see code snippet below), edit(), delete(), and validate().
<?php
include 'model.php';
function add($data){
$query = "INSERT INTO AREAS (created, name, latitude, longitude) VALUES (?, ?, ?, ?)";
$now = date('Y-m-d G:h:s'); $params = array(
0 => array('value' => $now, 'type' => PDO::PARAM_STR),
1 => array('value' => $data['name'], 'type' => PDO::PARAM_STR), 2 => array('value' => $data['latitude'], 'type' => PDO::PARAM_STR), 3 => array('value' => $data['longitude'], 'type' => PDO::PARAM_STR) );
$result = runSQL($query, $params);
if(isset($result['error'])) $return = 0; else $return = 1;
return $return; }
?>
The areas controller only uses one view and all the forms (add, edit, delete, view) are
appended according to the user's privileges by using Drupal's global variable $user (see code
snippet below). When a user is registered in the Web site, he/she is assigned a role (poweruser,
owner, or authenticated user). Drupal stores this information as an array 'roles' in the global
<div class="titles">
<div class="titles_item"><p class="expand" id="view"></p><h3>View Area</h3></div>
<?php if(in_array('poweruser', $user->roles)){ ?>
<div class="titles_item"><p class="expand" id="add"></p><h3>Add Area</h3></div>
<div class="titles_item"><p class="expand" id="edit"></p><h3>Edit Area</h3></div>
<div class="titles_item last"><p class="expand" id="del"></p><h3>Delete Area</h3></div>
<?php } ?> </div>
It is in the view that the external service and data from Google Maps is consumed and
integrated with the data from the database (see code snippet below).
<script type="text/javascript" src="http://maps.googleapis.com/maps/api/js? sensor=false"></script>
<script type="text/javascript">
jQuery(document).ready(function(){ var neworleansLat = 29.951066; var neworleansLong = -90.071532;
var myLatlng = new google.maps.LatLng(neworleansLat, neworleansLong); var myOptions = {
zoom: 6,
center: myLatlng,
mapTypeId: google.maps.MapTypeId.HYBRID };
var map = new google.maps.Map(
document.getElementById("areas_map"), myOptions
);
By using a JavaScript API, we can easily mix data from our MSSQL database and
Google Maps, even though they belong to two different contexts. Data from the database is
accessible via a PHP array and before the areas page is sent to the client as a HTML file, the
<?php foreach($areas as $area){ ?>
var marker = new google.maps.Marker({ position: new google.maps.LatLng(
<?php echo $area['latitude']; ?>,
<?php echo $area['longitude']; ?> ),
map: map,
title:"<?php echo $area['name']; ?>",
icon: "<?php echo variable_get('file_public_path', conf_path() . '/files'); ?>/images/circles_30x30.png"
});
marker.setMap(map);
google.maps.event.addListener( marker,
'click', function() {
location.href = "/?q=map_stations&area=<?php echo $area['id']; ?>"; });
<?php } ?>
controller
File: controllers/ stations_controller. php
model
File: models/ station.php
Functions: add(data), edit(data),
delete(data),
getStationsbyArea(are a_id), validate(data)
view
File:
views/stations.php
Forms: add, edit, delete, view data
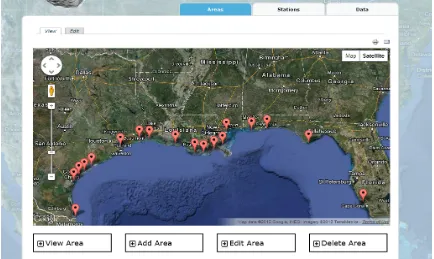
Figure 10 is a snapshot of the Areas page when visited by an administrator. The map
shows markers representing the center of each station and the administrator can use the different
tabs to view, add, edit, or delete any area.
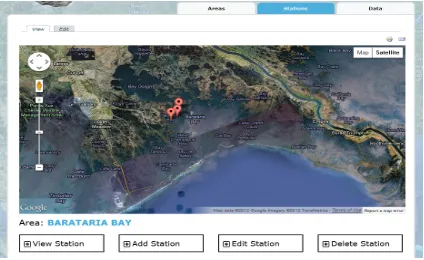
4.2.2 Stations Selection
After selecting an area in the areas page, the user is taken to the stations page. The
implementation of the stations page follows the same pattern as the areas page. We created a
controller, a model, and a view. The class diagram in Figure 11 shows the components and their
actions.
Figure 11 - Stations Class Diagram
The stations controller is similar to the areas controller. It also uses one view to display
the forms (add, edit, delete, view) and checks the global variable $user (see code snippet below).
<div class="titles">
<div class="titles_item">
<p class="expand" id="view"></p><h3>View Station</h3> </div>
<?php if(in_array('poweruser', >roles) || in_array('owner', $user->roles)){ ?>
<div class="titles_item">
<p class="expand" id="add"></p><h3>Add Station</h3> </div>
<div class="titles_item">
<p class="expand" id="edit"></p><h3>Edit Station</h3> </div>
<div class="titles_item last">
<p class="expand" id="del"></p><h3>Delete Station</h3> </div>
<?php } ?> </div>
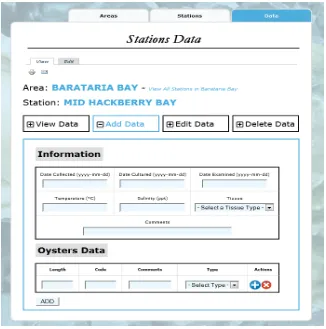
4.2.3 Data Page
The data page follows the same design pattern as the areas and stations pages but some
database tables and functions were added. After selecting the area and the station, the user is
taken to the data page, which is where an owner can enter the number of oysters, their size, and
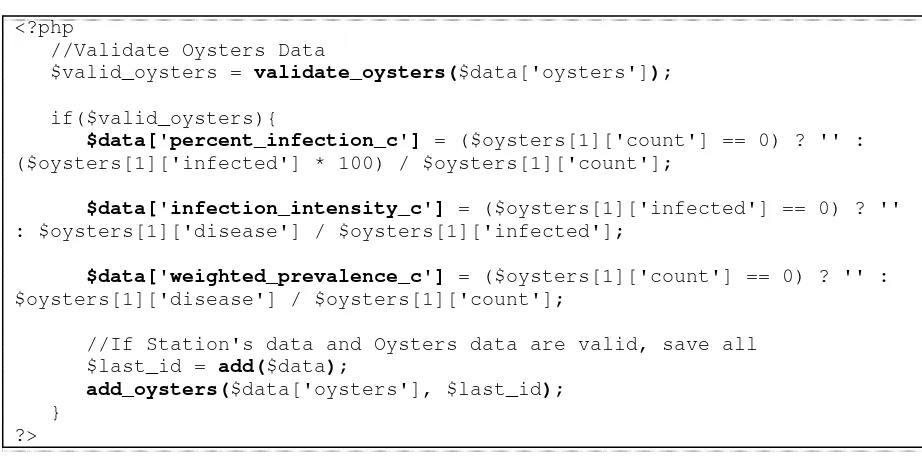
disease code. After submitting the form (Figure 13), the controller formats the data and computes
three critical values: the percent infection, the infection intensity, and the weighted prevalence
(Figure 14). These values are stored in the database and represent the level of infection in that
station at the time of sampling (Figure 15).
<?php
//Validate Oysters Data
$valid_oysters = validate_oysters($data['oysters']);
if($valid_oysters){
$data['percent_infection_c'] = ($oysters[1]['count'] == 0) ? '' : ($oysters[1]['infected'] * 100) / $oysters[1]['count'];
$data['infection_intensity_c'] = ($oysters[1]['infected'] == 0) ? '' : $oysters[1]['disease'] / $oysters[1]['infected'];
$data['weighted_prevalence_c'] = ($oysters[1]['count'] == 0) ? '' : $oysters[1]['disease'] / $oysters[1]['count'];
//If Station's data and Oysters data are valid, save all $last_id = add($data);
add_oysters($data['oysters'], $last_id); }
?>
Figure 14 - Calculating the percent infection, infection intensity, and weighted prevalence
controller
File: controllers/ data_controller. php
model
File: models/data. php
Functions: add(data), edit(data),
delete(data), validate(data)
view
File: views/ stations_data.php
Forms: add, edit, delete, view
Figure 16 shows the tables and views involve in this piece of the application. Data unique
to each sample such <station_id> are stored in the table "map_stations_data" in one row.
However, the number of sampled oysters varies and to normalize the database, oyster data are
stored in a separate table "map_stations_raw_data". The table "map_stations_data" has a primary
key <id> that is used as a foreign key <data_id> in the table "map_stations_raw_data". Setting
up these relational tables helps maintain a consistent dataset and obtain an efficient retrieval of
data when viewing or editing a row.
Figure 16 - Data Class Diagram
The data controller uses one view to display the forms (add, edit, delete, view) and
checks the global variable $user (see code snippet below) to grant access to each form.
<div class="titles data"> <div class="titles_item">
<p class="expand" id="view"></p><h3>View Data</h3> </div>
<?php if(in_array('poweruser', >roles) || (in_array('owner', $user->roles) && $user->name == $station[0]['owner'])){ ?>
<div class="titles_item">
<p class="expand" id="add"></p><h3>Add Data</h3> </div>
<div class="titles_item">
<p class="expand" id="edit"></p><h3>Edit Data</h3> </div>
<div class="titles_item last">
<p class="expand" id="del"></p><h3>Delete Data</h3> </div>
The Perkinsus marinus model is a 3-step Web application that uses Web mashup
technology to enrich the user interface. It helps administrators, owners, and general users, in
understanding the spatio-temporal distribution of the parasite across the Gulf of Mexico.
4.3
Oil Spill Model
The Oil Spill model is an application that has been designed but not implemented. For the
purpose of demonstrating and experimenting Web Mashup technology, we implemented a
simpler version of the originally designed Oil Spill model. This version of the Oil Spill model is
built around five main components: the mapping service, the oyster stations, the oil spills
manager, the prediction tool, and the query tool.
4.3.1 Mapping service
As used throughout the Web site, Google Maps is the mapping service used in the user
interface of this model. The map helps position stations and place markers for oil spills. It also
facilitates the representation of the oil spill as it progresses and the different classes provided by
Google Maps API helps implement the geospatial queries. The following graph shows the role of
Google Maps API
Stations
Query tool
Oil Spills Manager
UI MVC
Database 2
Prediction Web service
JavaScript environment
Figure 17 - Components of Oil Spill Model
4.3.2 Stations
As identified in the design section 3.3, oyster stations are the resources that are being
monitored by the model. They are the same resources that are being managed in the Perkinsus
marinus model. In consequence, it is a natural choice to use the MVC model 'station.php'
described in section 4.2.2. It provides a function that fetches the list of all stations and their
coordinates. The stations will be placed on the map.
4.3.3 Oil Spills Manager
When an oil spill occurs, it is monitored by various official agencies. Administrators of
oilspills oilspills_prog
OILSPILLS id
created name latitude longitude start_date start_time water_temp
OILSPILLS_PROG id
osid
created date time coord
The basic Information includes name, coordinates, starting date and time, and water temperature.
Entering this information in the Oil Spills manager helps keep a local record of the oil spill and
enrich our model. Figures 18 & 19 describe the database structure used.
Figure 18 - Entity-Relationship Diagram- Oil Spill model
1 many
Figure 19 - Schema Diagram - Oil Spill model
The oil spills manager (Figure 20) is a simple Web application that follows the same
MVC design pattern used in the Perkinsus marinus model.
controller
File: controllers/ oilspill_controller. php
model
File: models/ oilspill.php
Functions: add(data), addProg(data), edit(data), delete(data), validate(data), getProgressions(id)
view
File:
views/oil_spills.php Forms: add, edit, delete, view data Figure 20 - Oil Spills manager
Web site administrators can add, edit, or delete any entry in the system. The Oil Spills
manager also provides an interface to update oil spills. After the start of an oil spill, it is
imperative to track it, record its progression, and know its latest status. After selecting an oil spill
on the map, the administrator is taken to the profile page of that oil spill (Figure 22). The profile
page gives users tools to update the status of an oil spill and visualize the spill. Each update is
represented in the system as a snapshot. After manually getting data from an official agency, the
administrator can enter the date and time the snapshot was taken, as well as the polygon
coordinates forming the updated shape of the oil spill.
Figure 22 - Oil Spill profile page
Each snapshot is stored in the table <oilspills_prog> (Figure 19) by using the MVC
function addProg($data){
$query = "INSERT INTO OILSPILLS_PROG (created, date, time, coord, osid) VALUES (?, ?, ?, ?, ?)";
$now = date('Y-m-d G:h:s'); $params = array(
0 => array('value' => $now, 'type' => PDO::PARAM_STR), 1 => array('value' => $data['date'], 'type' =>
PDO::PARAM_STR),
2 => array('value' => $data['time'], 'type' => PDO::PARAM_STR),
3 => array('value' => $data['coord'], 'type' => PDO::PARAM_STR),
4 => array('value' => $data['osid'], 'type' => PDO::PARAM_INT)
);
$result = runSQL($query, $params);
return (isset($result['error'])) ? 0 : 1; }
After one or more snapshots are recorded, any user can use the Oil Spill viewer. The
viewer is a piece of the oil spill manager and its role is to provide a visual representation of the
oil spill from the start to the latest update. The viewer consists of two operations:
- View the snapshots chronologically: user can view the evolution of the oil spill.
- View the snapshots one at the time: user can view the oil spill at a specific time.
The list of stations and the oil spill location are shown on the map via JavaScript Google
Maps API. Google Maps also provides the class "google.maps.Polygon" that handles the
drawing and manipulation of polygon objects on a map. With oil spills' polygons saved as
strings, we use a JavaScript function (see code snippet below) to parse the coordinates and create
function setUpPolygon(count, colors, z, paths, stcol, fOpac){ var pathArray = new Array();
// Parsing coordinates
var p = paths.toString().split(';'); for(var i=0; i<p.length; i++){
var c = p[i].toString().split(','); if(c[1] != '' && c[0] != ''){
// Building an array of coordinates
pathArray[i] = new google.maps.LatLng(c[1], c[0]); }
}
return new google.maps.Polygon({ clickable:false, geodesic: true, strokeColor: stcol, strokeOpacity:1.0, strokeWeight:1, fillColor: "#"+colors[count], fillOpacity: fOpac, visible:false, zIndex: z,
paths: pathArray }); }
In its two operations, the Oil Spill viewer uses JQuery and the polygon method
"setVisible(boolean)" to change the value of the attribute 'visible' and show or hide any polygons
(see code snippet below).
/* Handles viewing Oil spill progression */ jQuery('#os_progressions').change(function(){ for(i=0; i< stations_markers.length; i++){
stations_markers[i].setVisible(true); }
index = jQuery(this).val(); if(index == -1)
for(i=0; i< polygons.length; i++){ polygons[i].setVisible(true); }
else {
for(i=0; i< polygons.length; i++){ polygons[i].setVisible(false); }
polygons[index].setVisible(true); }
Figure 23 - Oil Spill Viewer
4.3.4 Prediction Tool
The prediction tool is the centerpiece of the Oil Spill model. However, developing it
in-house requires the use of external services to provide weather data (currents, winds, and
temperature), and a reliable mathematical function to compute the area covered by the oil spill at
any future time. After extended weeks of research, one existing tool satisfied the criteria set for
our model: OceansMap. Developed by RPS - Applied Science Associates (ASA), a science and
technology solutions company with headquarters in Rhode Island, OceansMap is an online
service that allows registered users to analyze an oil spill and predict its path over the course of a
OceansMap is described as an online interactive Web-based oil spill simulation and spill
response system, which consists of a GIS-based graphical user interface, a spatial database, and
Web services from MapSERVER and the Environmental Data Server (EDS). OceansMap
provides a rich interface that allows users to set up oil spill scenarios, run a trajectory and
weathering model, and visualize the results of the model. The system also includes interactive
GIS functions and tools to manage spill planning activities. Figures 24, 25, and 26 are
screenshots of OceansMap and they are used here to show the different features provided by the
service.
Figure 25 - OceansMap: Viewing an Oil Spill scenario (1) (2)
Figure 26 – OceansMap: Other GIS functions available (1) (2)
(1)
OceansMap Application
OceansMap API
- setOilSpill( data ) - runSimulation( params)
Oil Spill Model
Prediction Tool OceansMap is a standalone application stored on a Web server. Registered users can
access it through the Web site oilmapweb.com and as of today, there is no interface available for
developers to remotely consume it. A direct and full collaboration between RPS - ASA and
oystersentinel.org is necessary in order to design an interface and implement the services
available. Even though a full integration of OceansMap with oystersentinel.org is not possible at
this time, it is important to describe and understand the ideal interface that the Oil Spill model
would require.
Figure 27 - OceansMap - Oil Spill Model Communication Diagram
The interface for OceansMap needs to run as a Web service and the authentication
protocol is omitted for the purpose of this thesis. Using a Web service has many advantages:
- Technical specifications such as the platform, the programming languages, and the
database design are all abstracted.
- Web service standards are well established. This guarantees the reliability and
compatibility of the service with remote platforms.
- Web services are accessed via HTTP requests. This aspect allows developers to
consume the services in any context whether it is using PHP, Java, or JavaScript. It
From the Oil Spill model's perspective, the interface for OceansMap needs two main
functions:
- setOilSpill( name, longitude, latitude, start ) : When using OceansMap, the user first
enters basic information about an oil spill (Figure 24) or retrieves an oil spill already
saved in the system. The method "setOilSpill( )" serves that purpose. As parameters,
it takes the oil spill's name, coordinates, and start date. It then returns an ID.
- runSimulation( ID, volume, length ): On OceansMap, after entering information on
the oil spill, the user can run a simulation by providing the volume of oil to be
released and the desired length of the simulation. OceansMap will run its model and
show the oil spill and its shape in interval of one and six hours (Figure 25). The
method "runSimulation( )" has a similar behavior. By supplying the oil spill's id, the
volume, and the length of the simulation as parameters, the function returns the
polygons representing the shapes of the oil spill over time.
The return object of the function "runSimulation( )" should be formatted as a GML. GML
is a Geography Markup Language that is similar to XML and tailored specifically for geographic
data such as polygons. The following sample code illustrates a simple example of a GML
Polygon element.
<gml:Polygon> <gml:exterior>
<gml:LinearRing> <gml:posList>
-89.692383 30.015836 -88.703613 29.539053 -89.450684 28.269553 -90.74707 29.271066 -90.461426 30.03486 -90.109863 30.129925 -89.692383
30.015836
</gml:posList> </gml:LinearRing> </gml:exterior>
The prediction tool will use URLs with GET parameters to access each of these
methods. Here are examples of URLs to consume OceansMap Web service:
- http://www.oilmapweb.com
:8080/func=setOilSpill&name=oil_spill&long=-90.0&lat=30.0&start=2012-11-2
- http://www.oilmapweb.com:8080/func=runSimulation&vol=1000&length=24
With the model's components used in the JavaScript environment (Figure 17), it is a
natural choice to consume OceansMap in JavaScript. To query the service using URLs, the
Prediction tool can make Ajax calls to oilmapweb.com and retrieve the data in the specified
format. Ajax calls are asynchronous requests sent to a server using JavaScript. The GML data
received from running the simulation will be parsed and added to the map via Google Maps
Polygon class.
Figure 28 illustrates a demonstration of the Prediction tool. After running the
simulation, the Oil Spill model shows projected paths with orange and red colors, in contrast to
the white and grey colors used for actual paths. Another feature available in the Prediction tool is
the projection viewer, similar to the Oil Spill viewer described in section 4.3.3. The viewer helps
users visualize oil spill projections in chronological order or visualize each projection at the time.
4.3.5 Query Tool
The Query tool is another important component of the Oil Spill model. After
implementing the Oil Spill manager and the Prediction tool, administrators can manage oil spills
while users can view them. The Query tool is what makes this model valuable. It is a collection
of queries that users can use to check the stations that are covered by the oil spill or the ones that
are within a certain radius from the oil spill. Domain experts and marine biologists can use this
Query tool to prioritize their efforts in the event of an oil spill. With the Prediction tool in place,
the Query tool can also estimate, for example, the stations that might be covered by an oil spill
within ten hours or the stations that will be within a one-mile radius from an oil spill in ten hours.
These queries add more weight in reducing response time and allowing marine wildlife and
resources to be better protected.
The Query tool is implemented in JavaScript. Using data from any component in the
model is done with fewer overheads and it reduces the server's processing power by running all
the queries on the users's computer.
With the stations and oil spills loaded from our internal database, we can find the
stations that are overlaid by the oil spill. Google Maps provides the method
coordinates of a marker/point and a polygon. It returns true if the marker/point is within the
surface of the polygon. Using an iterative loop, we can enumerate all the stations and retrieve the
ones that are located within the surface of an oil spill (see code snippet below).
<?php foreach($stations as $j => $station){ ?>
coord = new google.maps.LatLng(<?php echo $station['latitude']; ?>, <?php echo $station['longitude']; ?>);
var overlaid = new Array(); var d = 0;
for(var i=0; i<polygones.length; i++){
if(google.maps.geometry.poly.containsLocation(coord, polygones[i])){ overlaid[i][d] = <?php echo $station['id']; ?>;
d++; }
} <?php } ?>
After running the simulation, the same Google Maps method is used to find the stations
that might be overlaid by a projection. Figure 29 is a screenshot demonstrating the query and
showing the stations that are currently overlaid by an oil spill.
To filter the stations that are within a certain distance from the oil spill, we used the
Google Maps method 'google.maps.geometry.spherical.computeDistanceBetween (coord1,
coord2)'. Taking in count the rounded shape of Earth, this method takes the coordinates of two
shapes as parameters and returns the distance between them. Using a loop, we can enumerate all
the stations and calculate the distance between them and the oil spill. If the difference is within
the radius entered in the query, then the station is added to the list (see code snippet below).
jQuery('#q1_run').click(function(){ // Latest shape of oil spill var last = polygones.length - 1; // Distance specified in the query
var distance = jQuery('#q1_distance').val() * 1609.344;
// Stations within distance are added to dropdown list
var closest = '<option value="-1">- Closest Stations -</option>'; polygones[last].setVisible(true);
// Get center of latest oil spill coordinates
var polyCenter = getBounds(polygones[last]).getCenter();
// Loop through each station
for(var i = 0; i < stations.length; i++){
if(google.maps.geometry.poly.containsLocation(stations[i][3], polygones[last]) ||
google.maps.geometry.spherical.computeDistanceBetween(polyCenter, stations[i][3]) <= distance){
// Show station that is within distance stations_markers[i].setVisible(true); // Append station to dropdown list
Figure 30 is a screenshot demonstrating the query and showing the stations that will be
within twenty-five miles from the oil spill.
Figure 30 – Stations within twenty-five miles of oil spill projection
The Oil Spill model is a more complex Web mashup than the Perkinsus marinus
model. In addition to using a rich map from Google Maps, it fetches data from a local database
and uses a prediction service (i.e. OceansMap) to create a comprehensive application that can
Disclaimer
: Figures 20, 22, 23, 28, 29, and 30 and the information associated do not representactual oil spills. Data used in the Oil Spill model were made up to test and demonstrate its
capabilities.
4.4
Fisheries Web-based service
Data reusability is the primary goal of Web mashups. It gives developers the ability to
reuse existing data from external resources. However, a large percentage of Web sites provide
data on their platform but do not implement interfaces for developers to access those data. One
example of this limitation is the Oil Spill model currently unable to use the service OceansMap
as described in section 4.3.4. The Fisheries Web-based service is designed solely for the purpose
of demonstrating programmatic interfaces and the methods to access them externally. It is not a
live interface.
In addition to monitoring the health of oysters in the Gulf coast, oystersentinel.org also
monitors the quantity of oysters by type at stock assessment stations in Louisiana. These data are
collected in stock assessments by Coastal Study Area (CSA) managers and stored in a database.
Managing these data helps visualize the increase or decrease of a type of oysters in any given
station. Outside developers will use the Fisheries API to query our database and extract
information on oysters and stations.
From its design, the Fisheries Web-based service will serve as a bridge between outside
developers and our internal database. Developers will have two functions available to retrieve the
list of stations in the Gulf of Mexico and the quantity of sack oysters in each station. Figure 31
:developer :API
- get_stations() - get_stations_ sack_qty()
:database
request query
response data
Figure 31 - Fisheries API Abstract Communication diagram
The database used to store oyster data is the MSSQL database used in the previous
models. CSA managers collect samples from stations and separate seed, sack, and spat oysters.
From the samples, they store the average quantity of each type of oyster in the given sample
area.
include
Ajax calls
formatted data ajax call
strings
invoke data
SQL query rows
Figure 32 – Fisheries API Communication Diagram
:fisheries.php
:MSSQL database :fisheries.js
getStations()
getOystersSackQty(stat ionID)
:web mashup
:query functions
4.4.1 Query functions
Data are stored in relational tables and to query the database. We implemented two query
functions:
- getStationsByArea(areaID): It is implemented in the Perkinsus marinus model (Figure 9)
for the MVC model for stations (section 4.2, figure 11). The function takes an area ID as
the parameter and returns the stations located in that area. When passed 0 as the area ID,
the function returns all the stations in the table (see code snippet below).
function getStationsByArea($area_id = 0){ if($area_id == 0){
$query = "SELECT * FROM MAP_STATIONS ORDER BY name"; $params = array();
} else {
$query = "SELECT * FROM MAP_STATIONS WHERE area_id = ? ORDER BY name"; $params = array(0 => array('value' => $area_id, 'type' =>
PDO::PARAM_INT)); }
$result = runSQL($query, $params);
if(isset($result['error'])) $return = array(); else $return = $result;
return $return; }
- db_model_get_sack_by_station(): Originally implemented for the Oyster Sustainability
model, this function fetches the average of sack oysters in an area during a certain year. It
takes as parameters a station ID and a year, and returns an associative array of station ID
and average quantity.
The query functions form the first layer of abstraction needed to hide our database
4.4.2 fisheries.php
This file, located in the /webservices folder, handles API requests on the server side. It
checks the GET variables passed with the request, invokes the two query functions implemented
in section 4.4.1, and returns data as a string (see code snippet below).
<?php
date_default_timezone_set('America/Chicago');
// Query 1 - Getting list of stations
if(isset($_GET['query']) && $_GET['query'] == 'stations'){ //Get lists of stations
include '../models/station.php'; $stations = getStationsByArea(0);
foreach($stations as $i => $s){ $response[] =
$s['id'].','.$s['name'].','.$s['latitude'].','.$s['longitude']; }
print_r(implode(';', $response));
// Query 2 - Getting sack oysters average quantity by station } elseif(isset($_GET['query']) && $_GET['query'] == 'qty') {
include '../models/station.php';
//Get sack oysters qty of a station
$tmp = db_model_get_sack_by_station(2, 2012); foreach($tmp as $t){
$oysters[] = $t; }
$stations = getStationsByArea(0); foreach($stations as $i => $s){
if($s['id'] == $_GET['stationID']){
$response = (isset($oysters[$i])) ? $oysters[$i] + 15 : 25; break; } } print_r($response); } ?>
This PHP function is not directly available to outside developers. We implemented a third
4.4.3 fisheries.js
Following Google Maps API design, the Fisheries API will be accessible via the file
'fisheries.js' located in the /webservices folder. When included, two operations are made
available for use (see code snippet below): get the list of stations and fetch the average quantity
of sack oysters given a station.
function getStations(){
var stations = new Array(); jQuery.ajax({
type: 'GET',
url: 'http://www.oystersentinel.org/webservices/fisheries.php', data: { query: 'stations'},
dataType: "text", async: false,
success: function(data){
var temp = data.toString().split(";"); for(var i=0; i<temp.length; i++){
stations[i] = temp[i].toString().split(","); } } }); return stations; } function getOystersQty(stationID){ var density = -1;
jQuery.ajax({ type: 'GET',
url: 'http://www.oystersentinel.org/webservices/fisheries.php', data: { query: 'qty', stationID: stationID},
dataType: "text", async: false,
success: function(data){ density = data; }
});
return density; }
Each JavaScript function makes Ajax calls to the file 'fisheries.php'. However, the call is
asynchronous, meaning that the function will not wait for a response before continuing. To work