Harpenden, Herts, AL5 2JQ
Telephone: +44 (0)1582 763133 Web: http://www.rothamsted.ac.uk/
Rothamsted Research is a Company Limited by Guarantee Registered Office: as above. Registered in England No. 2393175. Registered Charity No. 802038. VAT No. 197 4201 51. Founded in 1843 by John Bennet Lawes.
Rothamsted Repository Download
A - Papers appearing in refereed journals
Church, B. M. and Lipton, S. 1956. The use of an electronic computer in
the estimation of sampling errors in a nutritional survey. British Journal Of
Nutrition. 10 (1), pp. 27-32.
The publisher's version can be accessed at:
•
https://dx.doi.org/10.1079/BJN19560007
The output can be accessed at:
https://repository.rothamsted.ac.uk/item/96y2y/the-use-of-an-electronic-computer-in-the-estimation-of-sampling-errors-in-a-nutritional-survey.
© Please contact [email protected] for copyright queries.
VOl.
I 0Penicillin, and thiamine requirement
of
rats
Lih, H. & Baumann, C. A. (1951). J. Nutr. 45, 143.Sauberlich, H. E. (1952). J. Nutr. 46, 99.
Schendel, H. E. &Johnson, B. C. ( 1 9 5 4 ~ ) . Fed. Proc. 13, 623. Schendel, H. E. &Johnson, B. C. (19543). J. Nutr. 54, 461.
Waibel, P. E., Bird, H . R. & Baumann, C. A. (1954). J. Nutr. 52, 273.
27
The use of an electronic computer in the estimation of
sampling errors in a nutritional survey
BY B. M. CHURCH AND
S.
LIPTONRothamsted Experimental Station, Harpenden, Herts
(Received 3 October 1955)
If observations covering the whole of a body of material are available, the errors which are to be expected when sampling further material of the same type can be estimated and the relative accuracy of different sampling methods determined. Unfortunately, however, the numerical work required for investigations of this kind is very consider- able, and in consequence when only desk machines are available statisticians are often reluctant to undertake this type of investigation with sufficient thoroughness to build up an adequate body of knowledge on sampling errors.
The advent of electronic computers has completely changed the situation, for it is now possible to carry out the required numerical calculations without difficulty. Since work of this kind is essentially repetitive it is eminently suitable for electronic com- puters, for once a set of instructions (technically known as a programme) appropriate to a particular problem has been written for a machine, further data of the same type can be analysed with little effort.
The present paper deals with the relatively simple but important problem of sampling numerical sequences. The investigation was made in order to determine the number and length of the periods over which an individual’s food intake should be observed in order to give sufficiently accurate assessment of the intake of the various dietary components. The nutritional aspects of the investigation and the results are reported by Chappell(1955). Since sampling problems of this type frequently arise in nutritional work and in other fields, it is considered that a brief description of the procedure adopted will be of value. Now that electronic methods of computation are available this type of calculation should become a standard routine when thorough knowledge of sampling errors is required for planning further work.
The problem
In sampling a numerical sequence we can vary both the size of the sampling unit (here defined as the length of sequence, or number of terms r, included in each unit) and the number of such units sampled. Thus in the nutritional problem periods of, for
https://www.cambridge.org/core
. BBSRC
, on
05 Nov 2019 at 10:42:28
, subject to the Cambridge Core terms of use, available at
https://www.cambridge.org/core/terms
.
28
B. M.
CHURCH
ANDS.
LIPTON
I956
example, a week, z weeks, a month may be taken as sampling units, and varying numbers of these units selected.Three methods of selecting the required units are of interest:
( a ) Two units may be selected at random from ‘blocks’ (or strata) of the appro- priate size.
(b) One unit may be selected at random from blocks of half the size of those required for method ( a ) . (Blocks of this size are here defined as containing t terms or t / r sampling units.)
(c) Units may be selected at regular intervals of t terms or tjr sampling units. Methods ( a ) and ( b ) are known as stratified random sampling with two and one units per block respectively. Method (c) is known as systematic sampling. Method ( a )
has the advantage that sampling errors can be determined from the data of the sample only. Method ( b ) also has a well-defined sampling error which will almost always be less than that of method (a), but this cannot be simply or accurately determined from the data provided by a particular sample. I n method ( c ) the sampling errors are uncertain since the necessary random components of selection are lacking. I n particular, the errors will clearly be large if any periodicities or quasi-periodicities of the same period as the sampling interval are present. Nevertheless, systematic samples are frequently used because of their practical convenience and, if no periodicities are present, they are likely to be somewhat more accurate than the samples of method (b)
(Yates, 1948). I n general, it will be adequate to take the sampling errors of method ( c )
as equivalent to those of method (b).
T o evaluate the sampling error of method ( b ) for sampling units of I week and blocks
of 8 weeks given, say, data for 64 weeks, the data may be divided into 8 blocks of
8 weeks; the sum of the squares of deviations of the individual weekly values from the block means can then be calculated. Although this calculation is not difficult, the labour rapidly mounts up when different block sizes and different unit sizes require investigation.
Moreover, there is a further difficulty, concealed in the above example but very evident if, say, data for only 63 weeks are available: there will then be room for only
7 blocks of 8 and the exact location of these blocks is clearly arbitrary. I n general, for a sequence with arbitrary starting and end-points, no particular location is to be preferred and logically all possible locations have an equal right to inclusion, though the additional information thereby obtained on the sampling errors is of course by no means proportional to the number of locations included.
These difficulties can all be resolved, however, by taking the smallest sampling units which require consideration (here I week), evaluating the differences of units one
apart, two apart, and so on, and calculating the mean squares of these differences. T h e sampling errors appropriate to different sizes of unit and sizes of block can then be calculated from the formulas given in the next section. This method has incidentally the important additional advantage that proper account can be taken of missing values without undue labour.
https://www.cambridge.org/core
. BBSRC
, on
05 Nov 2019 at 10:42:28
, subject to the Cambridge Core terms of use, available at
https://www.cambridge.org/core/terms
.
VOl.
I 0Electronic computing
for a
nutritional survey
29
Variance estimates
T h e variance between the terms, xi, of a sequence within a group of t consecutive
terms is given by I
t - I
which may alternatively be written
t ( t -
I)
( ( ~ 1 - ~ 2 ) 2+
( X I - ~ 3 ) 2+
.
.
.
+
( 2 2 - ~ 3 ) 2+
.
.
.
+
( x t - 1 - ~ ~ 2 } - ( 2 )T h e average variance within all such groups of t terms can therefore be estimated as
( 3 )
I
( ( t - I ) d ? + ( t - 2 ) d l +
...+
i ( T q
where d: is the mean value of the square of the difference between values i apart in the sequence, given by the equation
2 1
d i = -.{(XI - ~ l + i ) ~
+
( ~ 2 - x2+J2+
( ~ 3 - ~ 3 + i ) ~+
.
.
.
+
( ~ t - i - ~ t ) ’ } . t - aVariance estimates derived from equation ( 2 ) using all possible groups of t consecutive
terms, and those from equation ( 3 ) , are not identical for finite sequences since terms at the end of the sequence occur in a smaller number of groups. However, equation ( 3 ) is equally appropriate if the observed sequence is an arbitrary section of a longer sequence, and if there is no reason to expect different variability at the ends of the observed sequence. Under these conditions, it follows from equation (3) that the variance between groups of Y consecutive terms within groups of t terms p: (on a per term basis) can be estimated as
t r
[ ( t - I) d?+ ( t - 2 ) d i + .
..
+
d!-l] - - [ ( r - I) d:+ ( r - 2 ) dl+
.
. .
+
d L ] ] .(4)
T h e behaviour of equation
(4)
when these conditions are not satisfied has not been considered and might merit further investigation; the equation appears to be satis- factory for the present data and has been used in the programme below. If variance estimates were calculated from expressions in the form of equation ( 2 ) the arithmetic would be complicated if occasional terms were missing from the sequence ; however, working from equation(4),
it is only necessary to note the numbers of differences which are known and to use these as divisors when calculating d : .For long sequences, use of equation
(4)
is equivalent to estimating the variance between groups of r terms within all possible overlapping groups o f t terms and, when the xi are independently and normally distributed, provides 3r2/(2r2+
I)
times asmuch information as the estimate from a single set of non-overlapping groups of t terms.
Method of calculation
T h e electronic computer used for these calculations was the
‘401
’
prototype model built by Elliott Brothers under contract from the National Research Development Corporation (Lipton,1955).
This computer operates with numbers of 32 binary digitshttps://www.cambridge.org/core
. BBSRC
, on
05 Nov 2019 at 10:42:28
, subject to the Cambridge Core terms of use, available at
https://www.cambridge.org/core/terms
.
30
B. M.
CHURCH
ANDS.
LIPTON
I956
(one of which is a sign digit), corresponding to about 94 decimal digits. The informa- tion is fed into the machine by means of five-hole punched tape and the output is by electric typewriter or teleprinter punch. As the various types of electronic computers have different order codes (i.e. methods of instructing the machine what to do) as well as different characteristics, a detailed description of the programme would only have a very limited interest. Consequently, an outline of the general method of work is given below, and details of actual coding and of points peculiar to the ‘401’
are omitted. The data from the dietary survey consisted of sixty-one observations on weekly intakes of each of thirteen dietary constituents relating to a total period of 63 weeks-in every instance the records for the 10th and 40th weeks were missing.Th e data for each of the constituents were punched on a separate tape; every con- stituent had a code number and it, too, was punched on the tape and preceded the data proper. The code number was printed out by the machine at the head of the corresponding results and so prevented the possibility of identifying a set of results with the incorrect constituent. The punching of the data tapes was straightforward, the numbers being punched successively in order from the 1st week up to the 63rd week. When a week for which the observation was missing was reached, a large number (10’)
was punched-it was much greater than any actual observation and served as a signal to the machine that there was no record for that week.
The programme consisted of two stages. The machine was instructed to calculate and print out
(I) the d; for terms I , 2,
...,
m- I apart;(2) the sums Ti=(i-1)d,2+(i-2)d;+ ...+d:--l for i = 2 , 3,
...,
m.It is worth noting that although the
Ti’s
could be computed on a desk machine by using the values of the d?, this work would be time-consuming as well as boring. This illustrates an important advantage of electronic computers; as far as is required, subsequent minor calculations can be carried out by the machine in addition to the main calculations so that the results are obtained in the most convenient form.The programme was written so that it could be used for any similar problem with an arbitrary number of observations limited only by the storage capacity of the machine. When the general programme tape is prepared, all that is required are the data tapes and a small tape for setting n, the total number of observations, and m
-
I , the maximumdistance apart of the terms used in the d:. There is no need to set parameters to indicate the number or positions of the missing values: as the machine forms each difference
(xj
-
x ~ + ~ ) , xj andxi+i
are tested to see if they represent genuine observations or missing values. If either represents a missing value, the machine passes on to the next difference and the divisor to be used in calculating d i is reduced by one.In the dietary problem n = 63 and m = 52 ; thus 102 results had to be printed out for each variate. Subsequently p: was estimated as
which was computed on a desk calculator.
https://www.cambridge.org/core
. BBSRC
, on
05 Nov 2019 at 10:42:28
, subject to the Cambridge Core terms of use, available at
https://www.cambridge.org/core/terms
.
VOl.
I 0Electronic computing for
a nutritional survey
31Computing time
The entire procedure from the time the data tape was fed in until the printing of the final value for i = 5 2 was carried out without the intervention of the operator. Th e machine took
4
min for each tape, composed as follows:10 sec
reading in data tape
computing 29 min
printing out results I+ min.
Punching of each data tape, including duplication and checking, took about 10 min.
In the general instance the computing time would be roughly proportional to m ( 2 n - m - I).
The whole programme, including routines for taking in the data and printing the results, occupied some 300 locations of the store out of a total of nearly 3000 in the
computer; thus there was ample room for further programmes that could operate on the results.
Example
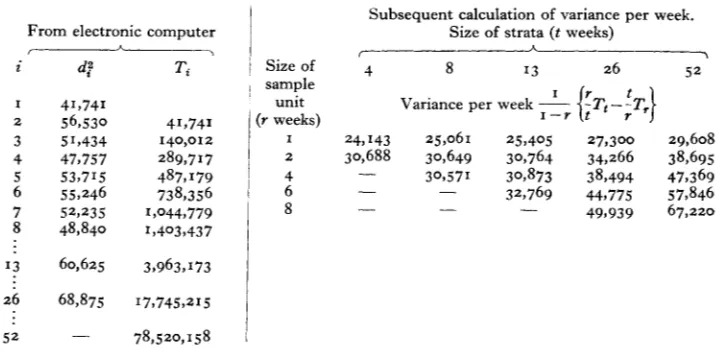
An extract from the figures printed by the electronic computer for one of the thirteen dietary constituents (total calories) is given in the second and third columns of Table I. At the right of the table the variance estimates subsequently calculated are
shown. The use of such variance estimates may be illustrated as follows. If the
Table I . Sampling variance of calorie intake (on a per week basis) calculated for various sixes of unit and of strata
From electronic computer ,
d:
41,741 56,530 51,434 47,757 53,715 55,246 52,235 48,840
Subsequent calculation of variance per week. Size of strata (t weeks)
41,741 140,012 289,717 487,179 738,356 1,044,779 1,4039437
sample unit
(Y weeks)
13
60,625 3,963,17326 68,875 I7,745,215
78,520, I 58 -
5 2
average weekly calorie intake over a period of z months is to be determined, a single random sample of I fortnight would provide an estimate with standard error
f
124 (=2/[30,649/2]),
whereas 2 weeks sampled independently at random withinconsecutive months would give an estimate with standard error
k
I 10(=2/[24,143/2]),
30,649
providing --=
1.27
times as much information as the single sample of the same24,143
total duration.
https://www.cambridge.org/core
. BBSRC
, on
05 Nov 2019 at 10:42:28
, subject to the Cambridge Core terms of use, available at
https://www.cambridge.org/core/terms
.
32
B. M.
CHURCH
ANDS.
LIPTON
I956
SUMMARY
I . The empirical evaluation of sampling errors of all kinds has in the past been
greatly neglected owing to the laborious calculations required on desk machines. With the development of electronic methods these computations can now be readily undertaken.
2. The paper describes a method of evaluating the sampling errors of a numerical
sequence using the electronic computer installed at Rothamsted Experimental Station. The method was developed to deal with the data of a dietary survey, but the programme has been written in general form and can take account of missing values.
The authors are indebted to Dr F. Yates, F.R.S., whose interest stimulated the investigation, for advice in the preparation of this paper.
REFERENCES
Chappell, G. M. (1955). Brit. J. Nutr. 9, 323.
Lipton, S. (1955). Mathematical Tables and Other Aids to Computation, 9, 69. Yates, F. (1948). Phil. Trans. A, 241, 345.
The role of fat in the diet of rats
8. Influence on growth of shortening products, ‘emulsifier PT 006’ and polymerized linseed oil
BY E. AAES-JBRGENSEN, J. P. FUNCH, P. F. ENGEL AND
H.
DAMDepartment of Biochemistry and Nutrition, Polytechnic Institute, Copenhagen
(Received 5 October 1955)
In a previous study (Aaes-Jorgensen,
1954)
polymerized herring oil given as the sole fat in the diet of newly weaned male rats was found to be toxic. At the level of7%
it depressed growth. At a 28yo
level the animals were dying after14
weeks of feeding. Diarrhoea was not a striking sign. In a subsequent experiment a partial polyglycerol ester of in vacuo polymerized soya-bean oil, P T 006 ( I and3.5
yo
of the diets) was mixedwith lard and fed to newly weaned rats in synthetic diets containing 28% lard plus
emulsifier. The growth of these animals was almost the same as that of the controls given 28% lard throughout an experimental period of
15
weeks. At the end of thisperiod the animals were killed. At autopsy no signs of carcinomatous tissue were found in the digestive tract.
The present experiments were carried out to study the effect on young rats of diets containing polymerized oils, in particular the effect of a polymerized oil used as an emulsifier in a shortening*, and of the emulsifier itself as the predominant dietary fat component.
*
Shortenings (or compounds) are fats used to make pastry, cakes and such-like short, i.e. breaking or crumbling readily.https://www.cambridge.org/core
. BBSRC
, on
05 Nov 2019 at 10:42:28
, subject to the Cambridge Core terms of use, available at
https://www.cambridge.org/core/terms
.