Linear
Functions
Linear
Functions
Many real-world
situations such as
Olympic race times
can be represented
using functions.
In this unit, you will
learn about linear
functions and
equations.
Chapter 4
Graphing Relations and Functions
Chapter 5
Analyzing Linear Equations
Chapter 6
Solving Linear Inequalities
Chapter 7
Solving Systems of Linear Equations and Inequalities
Chapter 4
Graphing Relations and Functions
Chapter 5
Analyzing Linear Equations
Chapter 6
Solving Linear Inequalities
Chapter 7
The first Olympic Games featured only one event— a
foot race. The 2004 Games will include thousands of
competitors in about 300 events. In this project, you
will explore how linear functions can be illustrated by
the Olympics.
Then continue working on your WebQuest as you study Unit 2.
Log on to www.algebra1.com/webquest. Begin your WebQuest by reading the Task.
The Spirit of the Games
Unit 2 Linear Functions 189 4-6 5-7 6-6 7-1
230 304 357 373
Lesson Page
By Scott Boeck and Julie Stacey, USA TODAY Source: U.S. Olympic Committee
11
10
9
8
America’s top medalists
Americans with most Summer Games medals: Mark Spitz, Matt Biondi (swimming),
Carl Osburn (shooting)
Ray Ewry (track and field)
Carl Lewis, Martin Sheridan (track and field)
Graphing Relations
and Functions
• coordinate plane (p. 192)
• transformation (p. 197)
• inverse (p. 206)
• function (p. 226)
• arithmetic sequence (p. 233)
Key Vocabulary
• Lessons 4-1, 4-4, and 4-5 Graph ordered pairs, relations, and equations.
• Lesson 4-2 Transform figures on a coordinate plane.
• Lesson 4-3 Find the inverse of a relation.
• Lesson 4-6 Determine whether a relation is a function.
• Lessons 4-7 and 4-8 Look for patterns and write formulas for sequences.
The concept of a function is used throughout higher mathematics, from algebra to calculus. A function is a rule or a formula. You can use a function to describe real-world situations like converting between currencies. For example, if you are in Mexico, you can calculate that an item that costs 100 pesos is equivalent to about 11 U.S. dollars. You will learn how to convert different currencies in Lesson 4-4.
Prerequisite Skills
To be successful in this chapter, you’ll need to master these skills and be able to apply them in problem-solving situations. Review these skills before beginning Chapter 4.For Lesson 4-1 Graph Real Numbers
Graph each set of numbers. (For review, see Lesson 2-1.)
1. {1, 3, 5, 7} 2. {3, 0, 1, 4} 3. {8, 5, 2, 1} 4.
12, 1, 1 1 2, 2
For Lesson 4-2 Distributive Property
Rewrite each expression using the Distributive Property. (For review, see Lesson 1-5.)
5. 3(7t) 6. 4(w2) 7. 5(3b2) 8. 1
2(2z4)
For Lessons 4-4 and 4-5 Solve Equations for a Specific Variable Solve each equation for y. (For review, see Lesson 3-8.)
9. 2xy1 10. x8y 11. 6x3y12
12. 2x3y9 13. 912y4x 14. y
3 5
x2
For Lesson 4-6 Evaluate Expressions
Evaluate each expression if a 1, b4, and c 3. (For review, see Lesson 2-3.)
15. abc 16. 2cb 17. c3a
18. 3a6b2c 19. 8a1
2b3c 20. 6a8b
2 3c
Chapter 4 Graphing Relations and Functions 191
Make this Foldable to help you organize your notes about graphing relations and functions. Begin with four sheets of grid paper.
4–2
4–1
The Coordinate
Plane tabs with a lesson Label each of the
number. The top tab is
4 lines wide, the next tab is 8 lines
wide, and so on.
Cut along fold. Staple the eight
half-sheets together to form a booklet. Fold each sheet
of grid paper in half from top to
bottom.
Reading and Writing As you read and study the chapter, use each page to write notes and to graph examples.
Fold
Cut Tabs into Margin
Cut and Staple
Vocabulary
• axes
• origin
• coordinate plane • y-axis
• x-axis • x-coordinate • y-coordinate • quadrant • graph
The Coordinate Plane
• Locate points on the coordinate plane.
• Graph points on a coordinate plane.
Underwater archaeologists use a grid system to map excavation sites of sunken ships. The grid is used as a point of reference on the ocean floor. The coordinate system is also used to record the location of objects they find.
Knowing the position of each object helps archaeologists reconstruct how the ship sank and where to find other artifacts.
Name an Ordered Pair
Write the ordered pair for point G.• Follow along a vertical line through the point to find the x-coordinate on the x-axis. The x-coordinate is 4.
• Follow along a horizontal line through the point to find the y-coordinate on the y-axis. The y-coordinate is 3.
• So, the ordered pair for point G is (4, 3). This can also be written as G(4, 3).
Unless marked otherwise, you can assume that each division on the axes represents 1 unit.
y
x O
G
4
3
Example
1
Example
1
IDENTIFY POINTS
In mathematics, points are located in reference to two perpendicular number lines called .Points in the coordinate plane are named by ordered pairs of the form (x, y). The first number, or , corresponds to the numbers on the x-axis. The second number, or , corresponds to the numbers on the y-axis. The origin, labeled O, has coordinates (0, 0).
y-coordinate x-coordinate
y
x
The plane containing the x- and y-axes is called the coordinate plane.
1
1
1
2
3
4
2
3
4 2 3 4
2 3 4 The axes intersect at
their zero points, called the origin.
The vertical number line is called the y-axis. The horizontal number line is called the x-axis.
O 1
axes
Reading Math
The x-coordinate is called the abscissa. The y-coordinate is called the ordinate.
Study Tip
do archaeologists use
coordinate systems?
Lesson 4-1 The Coordinate Plane 193
The x-axis and y-axis separate the coordinate plane into four regions, called . Notice which quadrants contain positive and negative
x-coordinates and which quadrants contain positive
and negative y-coordinates. The axes are not located in any of the quadrants.
quadrants
O x
y
Quadrant I (, ) Quadrant II
(, )
Quadrant IV (, ) Quadrant III
(, )
www.algebra1.com/extra_examples
Identify Quadrants
Write ordered pairs for points A, B, C, and D. Name the quadrant in which each point is located.
Use a table to help find the coordinates of each point.
y
x O
A
B
C
D
Example
2
Example
2
GRAPH POINTS
To an ordered pair means to draw a dot at the point on the coordinate plane that corresponds to the ordered pair. This is sometimes called plotting a point. When graphing an ordered pair, start at the origin. Thex-coordinate indicates how many units to move right (positive) or left (negative). The y-coordinate indicates how many units to move up (positive) or down (negative).
graph
Graph Points
Plot each point on a coordinate plane. a. R(4, 1)
• Start at the origin.
• Move left 4 units since the x-coordinate is 4. • Move up 1 unit since the y-coordinate is 1. • Draw a dot and label it R.
b. S(0, 5)
• Start at the origin.
• Since the x-coordinate is 0, the point will be located on the y-axis.
• Move down 5 units. • Draw a dot and label it S.
c. T(3, 2)
• Start at the origin.
• Move right 3 units and down 2 units. • Draw a dot and label it T.
y
x O
T
S R
Example
3
Example
3
Point x-Coordinate y-Coordinate Ordered Quadrant Pair
A 4 3 (4, 3) I
B 2 0 (2, 0) none
C 3 2 (3, 2) III
Use a Coordinate System
GEOGRAPHY Latitude and longitude lines form a system of coordinates to designate locations on Earth. Latitude lines run east and west and are the first coordinate of the ordered pairs. Longitude lines run north and south and are the second coordinate of the ordered pairs.
a. Name the city at (40°, 105°).
Locate the latitude line at 40°. Follow the line until it intersects with the longitude line at 105°. The city is Denver.
b. Estimate the latitude and longitude of Washington, D.C.
Locate Washington, D.C., on the map. It is close to 40° latitude and 75° longitude. There are 5° between each line, so a good estimate is 39° for the latitude and 77° for the longitude.
40°
35°
30°
25° 45°
Casper
Little Rock Las Vegas
Denver
Oklahoma City
Dallas
Austin
Miami New
Orleans Montgomery
AtlantaCharleston Raleigh Louisville Richmond
Washington, D.C. Columbus
Detroit Portland
Boise Helena
San Francisco
Los Angeles
Albuquerque
Nashville Omaha
70°
125° 120° 115° 110° 105° 100° 95° 90° 85° 80° 75° 70° 65°
Example
4
Example
4
Geography
The prime meridian, 0° longitude, passes through London’s Greenwich Observatory. A metal marker indicates its exact location. Source:www.encarta.msn.comTEACHING TIP
Concept Check
Guided Practice
Application
1. Drawa coordinate plane. Label the origin, x-axis, y-axis, and the quadrants.
2. Explainwhy (1, 4) does not name the same point as (4, 1).
3. OPEN ENDED Give the coordinates of a point for each quadrant in the coordinate plane.
Write the ordered pair for each point shown at the right. Name the quadrant in which the point is located.
4. E 5. F
6. G 7. H
Plot each point on a coordinate plane. 8. J(2, 5) 9. K(1, 4)
10. L(0, 3) 11. M(2, 2)
12. ARCHITECTURE Chun Wei has sketched the southern view of a building. If A is located on a coordinate system at (40, 10), locate the coordinates of the other vertices.
E
D
C
B A
30 ft
40 ft
10 ft 20 ft
y
x O
G
H F
Practice and Apply
Practice and Apply
Lesson 4-1 The Coordinate Plane 195 www.algebra1.com/self_check_quiz
Write the ordered pair for each point shown at the right. Name the quadrant in which the point is located.
13. N 14. P
15. Q 16. R
17. S 18. T
19. U 20. V
21. W 22. Z
23. Write the ordered pair that describes a point 12 units down from and 7 units to the right of the origin.
24. Write the ordered pair for a point that is 9 units to the left of the origin and lies on the x-axis.
Plot each point on a coordinate plane.
25. A(3, 5) 26. B(2, 2) 27. C(4, 2) 28. D(0, 1)
29. E(2, 5) 30. F(3, 4) 31. G(4, 4) 32. H(4, 4)
33. I(3, 1) 34. J(1, 3) 35. K(4, 0) 36. L(2, 4)
GEOGRAPHY For Exercises 37 and 38, use the map on page 194. 37. Name two cities that have approximately the same latitude.
38. Name two cities that have approximately the same longitude.
39. ARCHAEOLOGY The diagram at the right shows the positions of artifacts found on the ocean floor. Write the coordinates of the location for each object: coins, plate, goblet, and vase.
y
x O
coins
vase
goblet
plate
y
x O
N
Q S
P R
V T
Z
U W
E. Huron St.
Palmer Field Catherine St.
Division St.
Chemistry Natural
Science
Shapiro Undergraduate
Library Natural Resources and
Environment A
1
2
3
4
5
B C D E
Homework Help
For See
Exercises Examples 13–24, 39 1, 2
25–36 3 37, 38, 4 40–43
Extra Practice
See page 828.MAPS For Exercises 40–43, use the map at the left.
On many maps, letters and numbers are used to define a region or sector. For example, Palmer Field is located in sector E2. Rogelio is a guide for new students at the University of Michigan. He has selected campus landmarks to show the students.
40. In what sector is the Undergraduate Library?
41. In what sector are most of the science buildings?
42. Which street goes from sector (A, 2) to (D, 2)?
43. Name the sectors that have bus stops.
44. CRITICAL THINKING Describe the possible locations, in terms of quadrants or axes, for the graph of (x, y) given each condition.
Extending
the Lesson
Standardized
Test Practice
Maintain Your Skills
Maintain Your Skills
Mixed Review
Getting Ready for
the Next Lesson
51. AIRPLANES At 1:30 P.M., an airplane leaves Tucson for Baltimore, a distance
of 2240 miles. The plane flies at 280 miles per hour. A second airplane leaves Tucson at 2:15 P.M. and is scheduled to land in Baltimore 15 minutes before
the first airplane. At what rate must the second airplane travel to arrive on schedule? (Lesson 3-9)
Solve each equation or formula for the variable specified. (Lesson 3-8)
52. 3xb2x5 for x 53. 10c2(2d3c) for d
54. 6w3hb for h 55. 3(a
4
t)
2t for t
Find each square root. Round to the nearest hundredth if necessary. (Lesson 2-7)
56.
81 57. 63 58. 180 59. 256Evaluate each expression. (Lesson 2-1)
60. 52 18 7 61. 81 4717 62. 42 60 74
63. 36 15 21 64. 10 16 27 65. 38 65 21
PREREQUISITE SKILL Rewrite each expression using the Distributive Property. Then simplify. (To review the Distributive Property, see Lesson 1-5.)
66. 4(xy) 67. 1(x3) 68. 3(1 6y)
69. 3(2x5) 70. 1
3(2x6y) 71.
1
4(5x2y)
45. Answer the question that was posed at the beginning of the lesson.
How do archaeologists use coordinate systems?
Include the following in your answer:
• an explanation of how dividing an excavation site into sectors can be helpful in excavating a site, and
• a reason why recording the exact location of an artifact is important.
For Exercises 46 and 47, refer to the figure at the right. 46. ABCD is a rectangle with its center at the origin. If
the coordinates of vertex B are (3, 2), what are the coordinates of vertex A?
(3, 2) (3, 2)
(3, 2) (3, 2)
47. What is the length of AD?
6 units 4 units
5 units 3 units
The of a line segment is the point that lies exactly halfway between the two endpoints. The midpoint of a line segment whose endpoints are at (a, b) and (c, d) is at
a2c, b2d
. Find the midpoint of each line segment whose endpoints are given.
48. (7, 1) and (3, 1) 49. (5, 2) and (9, 8) 50. (4, 4) and (4, 4)
midpoint
D C
B A
D C
B A
y
x O
A B(3, 2)
C D
TRANSFORM FIGURES
are movements of geometric figures. The is the position of the figure before the transformation, and the is the position of the figure after the transformation.a figure is flipped over a line a figure is slid in any direction
a figure is enlarged or reduced a figure is turned around a point
rotation dilation
translation reflection
image
preimage
Transformations
Transformations on the
Coordinate Plane
Lesson 4-2 Transformations on the Coordinate Plane 197
Vocabulary
• transformation • preimage • image • reflection • translation • dilation • rotation
Identify Transformations
Identify each transformation as a reflection, translation, dilation, or rotation.
a. b. c. d.
a. The figure has been turned around a point. This is a rotation.
b. The figure has been flipped over a line. This is a reflection.
c. The figure has been increased in size. This is a dilation.
d. The figure has been shifted horizontally to the right. This is a translation.
Example
1
Example
1
• Transform figures by using reflections, translations, dilations, and rotations.
• Transform figures on a coordinate plane by using reflections, translations, dilations, and rotations.
Computer programs can create movement that mimic real-life situations. A new CD-ROM-based flight simulator replicates an actual flight experience so closely that the U.S. Navy is using it for all of their student aviators. The movements of the on-screen graphics are accomplished by using mathematical transformations.
are transformations used
in computer graphics?
Transformations on the Coordinate Plane
Reflection To reflect a point reflection over x-axis: over the x-axis, (x, y)→(x, y) multiply the
y-coordinate by 1.
To reflect a point over reflection over y-axis: the y-axis, multiply the (x, y)→(x, y)
x-coordinate by 1.
Translation To translate a point by (x, y)→(xa, yb) an ordered pair (a, b),
add a to the
x-coordinate and b to the y-coordinate.
Dilation To dilate a figure by a (x, y)→(kx, ky) scale factor k, multiply
both coordinates by k.
If k1, the figure is enlarged.
If 0k1, the figure is reduced.
Rotation To rotate a figure 90° 90° rotation:
counterclockwise about (x, y)→(y, x) the origin, switch the
coordinates of each point and then multiply the new first coordinate by 1.
To rotate a figure 180° 180° rotation: about the origin, (x, y)→(x, y) multiply both
coordinates of each point by 1.
y
x O
(x, y) (y, x)
(x, y)
y
x O
(x, y) (kx, ky)
x y
O
(x, y) (x a, y b)
y
x O
(x, y)
(x, y) (x, y)
Name Words Symbols Model
Reading Math
The verticesof a polygon are the endpoints of the angles.
Study Tip
TRANSFORM FIGURES ON THE COORDINATE PLANE
You canperform transformations on a coordinate plane by changing the coordinates of the points on a figure. The points on the translated figure are indicated by the prime symbol to distinguish them from the original points.
Reflection
A parallelogram has vertices A(4, 3), B(1, 3), C(0, 1), and D(5, 1).
a. Parallelogram ABCD is reflected over the x-axis. Find the coordinates of the vertices of the image.
To reflect the figure over the x-axis, multiply each y-coordinate by 1. (x, y)→(x, y) (x, y)→(x,y)
A(4, 3)→A(4, 3) C(0, 1)→C(0, 1)
B(1, 3)→B(1, 3) D(5, 1)→D(5, 1)
The coordinates of the vertices of the image are A(4, 3), B(1, 3), C(0, 1), and D(5, 1).
Example
2
Reading Math
Parallelogram ABCDand its image ABCDare said to be symmetric. The x-axis is called the line of symmetry.
Study Tip
Lesson 4-2 Transformations on the Coordinate Plane 199
b. Graph parallelogram ABCD and its image ABCD.
Graph each vertex of the parallelogram ABCD. Connect the points.
Graph each vertex of the reflected image
ABCD. Connect the points.
y
x O
A' A
B' C D'
D
B
C'
www.algebra1.com/extra_examples
Translation
Triangle ABC has vertices A(2, 3), B(4, 0), and C(2, 5).
a. Find the coordinates of the vertices of the image if it is translated 3 units to the left and 2 units down.
To translate the triangle 3 units to the left, add 3 to the x-coordinate of each vertex. To translate the triangle 2 units down, add 2 to the y-coordinate of each vertex.
(x, y)→(x3, y2)
A(2, 3)→A(23, 32)→A(5, 1)
B(4, 0)→B(43, 02)→B(1, 2)
C(2, 5)→C(23, 52)→C(1, 7) The coordinates of the vertices of the image are A(5, 1), B(1, 2), and C(1, 7).
b. Graph triangle ABC and its image.
The preimage is ABC.
The translated image is ABC.
y
x O
A' A
B'
C B
C'
Example
3
Example
3
Dilation
A trapezoid has vertices L(4, 1), M(1, 4), N(7, 0), and P(3, 6).
a. Find the coordinates of the dilated trapezoid LMNPif the scale factor is 34.
To dilate the figure multiply the coordinates of each vertex by 34.
(x, y)→
34x, 3 4y
L(4, 1)→L
34(4), 3
41
→L–3, 3 4M(1, 4)→M
341, 3
44
→M 3 4, 3N(7, 0)→N
347, 3
40
→N5 1 4, 0P(3, 6)→P
34(3), 3
4(6)
→P2 1 4, 41 2
The coordinates of the vertices of the image are L
3, 34
, M 3 4, 3,N
514, 0, and P214, 412.Example
4
Example
4
b. Graph the preimage and its image.
The preimage is trapezoid LMNP. The image is trapezoid LMNP. Notice that the image has sides that are three-fourths the length of the sides of the original figure.
y
x O
M
P
N
L M'
L'
N'
P'
1. Compare and contrastthe size, shape, and orientation of a preimage and an image for each type of transformation.
2. OPEN ENDED Draw a figure on the coordinate plane. Then show a dilation of the object that is an enlargement and a dilation of the object that is a reduction.
Identify each transformation as a reflection, translation, dilation, or rotation.
3. 4.
Find the coordinates of the vertices of each figure after the given transformation is performed. Then graph the preimage and its image.
5. triangle PQR with P(1, 2), Q(4, 4), and R(2, 3) reflected over the x-axis
6. quadrilateral ABCD with A(4, 2), B(4, 2), C(1, 3), and D(3, 2) translated 3 units up
7. parallelogram EFGH with E(1, 4), F(5, 1), G(2, 4), and H(4, 1) dilated by a scale factor of 2
8. triangle JKL with J(0, 0), K(2, 5), and L(4, 5) rotated 90° counterclockwise about the origin
GUIDED PRACTICE KEY
Guided Practice
Concept Check
Example
5
Example
5
Rotation
Triangle XYZ has vertices X(1, 5), Y(5, 2), and Z(1, 2).
a. Find the coordinates of the image of XYZ after it is rotated 90° counterclockwise about the origin.
To find the coordinates of the vertices after a 90° rotation, switch the
coordinates of each point and then multiply the new first coordinate by 1. (x, y)→(y, x)
X(1, 5)→X(5, 1)
Y(5, 2)→Y(2, 5)
Z(1, 2)→Z(2, 1)
b. Graph the preimage and its image.
The image is XYZ.
The rotated image is XYZ.
y
x O
X'
X Y'
Z Y
Lesson 4-2 Transformations on the Coordinate Plane 201 www.algebra1.com/self_check_quiz
Application
Practice and Apply
Practice and Apply
Identify each transformation as a reflection, translation, dilation, or rotation.
11. 12.
13. 14.
15. 16.
For Exercises 17–26, complete parts a and b.
a. Find the coordinates of the vertices of each figure after the given transformation is performed.
b. Graph the preimage and its image.
17. triangle RST with R(2, 0), S(2, 3), and T(2, 3) reflected over the y-axis
18. trapezoid ABCD with A(2, 3), B(5, 3), C(6, 1), and D(2, 1) reflected over the
x-axis
19. quadrilateral RSTU with R(6, 3), S(4, 2), T(1, 5), and U(3, 7) translated 8 units right
20. parallelogram MNOP with M(6, 0), N(4, 3), O(1, 3), and P(3, 0) translated 3 units right and 2 units down
21. trapezoid JKLM with J(4, 2), K(2, 4), L(4, 4), and M(4, 4) dilated by a scale factor of 12
22. square ABCD with A(2, 1), B(2, 2), C(3, 2), and D(1, 3) dilated by a scale factor of 3
23. triangle FGH with F(3, 2), G(2, 5), and H(6, 3) rotated 180° about the origin
24. quadrilateral TUVW with T(4, 2), U(2, 4), V(0, 2), and W(2, 4) rotated 90° counterclockwise about the origin
25. parallelogram WXYZ with W(1, 2), X(3, 2), Y(0, 4), and Z(4, 4) reflected over the y-axis, then rotated 180° about the origin
26. pentagon PQRST with P(0, 5), Q(3, 4), R(2, 1), S(2, 1), and T(3, 4) reflected over the x-axis, then translated 2 units left and 1 unit up
Homework Help
For See
Exercises Examples 11–16, 1
37, 38
17–36 2–5
Extra Practice
See page 828.NAVIGATION For Exercises 9 and 10, use the following information.
A ship was heading on a chartered route when it was blown off course by a storm. The ship is now ten miles west and seven miles south of its original destination.
9. Using a coordinate grid, make a drawing to show the original destination A and the current position B of the ship.
Digital
Photography
Digital photographs contain hundreds of thousands or millions of tiny squares called pixels. Source:www.shortcourses.comANIMATION For Exercises 27–29, use the diagram at the right.
An animator places an arrow representing an airplane on a coordinate grid. She wants to move the arrow 2 units right and then reflect it across the x-axis.
27. Write the coordinates for the vertices of the arrow.
28. Find the coordinates of the final position of the arrow.
29. Graph the image.
30. Trapezoid JKLM with J(6, 0), K(1, 5), L(1, 1), and M(3, 1) is translated to JKLMwith J(3, 2), K(2, 3), L(2, 1), M(0, 3). Describe this translation.
31. Triangle QRS with vertices Q(2, 6), R(8, 0), and S(6, 4) is dilated. If the image
QRShas vertices Q(1, 3), R(4, 0), and S(3, 2), what is the scale factor?
32. Describe the transformation of parallelogram WXYZ with W(5, 3), X(2, 5),
Y(0, 3), and Z(3, 1) if the coordinates of its image are W(5, 3), X(2, 5), Y(0, 3), and Z(3, 1).
33. Describe the transformation of triangle XYZ with X(2, 1), Y(5, 3), and
Z(4, 0) if the coordinates of its image are X(1, 2), Y(3, 5 ), and Z(0, 4).
DIGITAL PHOTOGRAPHY For Exercises 34–36, use the following information.
Soto wants to enlarge a digital photograph that is 1800 pixels wide and 1600 pixels high (1800 1600) by a scale factor of 21
2.
34. What will be the dimensions of the new digital photograph?
35. Use a coordinate grid to draw a picture representing the 1800 1600 digital photograph. Place one corner of the photograph at the origin and write the coordinates of the other three vertices.
36. Draw the enlarged photograph and write its coordinates.
ART For Exercises 37 and 38, use the following information.
On grid paper, draw a regular octagon like the one shown.
37. Reflect the octagon over each of its sides. Describe the pattern that results.
38. Could this same pattern be drawn using any of the other transformations? If so, which kind?
39. CRITICAL THINKING Make a conjecture about the coordinates of a point (x, y) that has been rotated 90° clockwise about the origin.
40. CRITICAL THINKING Determine whether the following statement is sometimes,
always, or never true.
A reflection over the x-axis followed by a reflection over the y-axis gives the same result as a rotation of 180°.
y
x O F
G D A
B
Lesson 4-2 Transformations on the Coordinate Plane 203
41. Answer the question that was posed at the beginning of the lesson.
How are transformations used in computer graphics?
Include the following in your answer:
• examples of movements that could be simulated by transformations, and • types of other industries that might use transformations in computer graphics
to simulate movement.
42. The coordinates of the vertices of quadrilateral QRST are Q(2, 4), R(3, 7),
S(4, 2), and T(5, 3). If the quadrilateral is moved up 3 units and right 1 unit, which point below has the correct coordinates?
Q(1, 5) R(4, 4) S(5, 1) T(6, 0)
43. x is 2
3of y and y is 1
4of z. If x14, then z
48. 72. 84. 96.
Graph the image of each figure after a reflection over the graph of the given equation. Find the coordinates of the vertices.
44. x0 45. y 3 46. yx
y
x O
S
T R y
x O
L
M J
K y
x O
A
C D
B
D C
B A
D C
B A
WRITING IN MATH
Standardized
Test Practice
Maintain Your Skills
Maintain Your Skills
Mixed Review
Getting Ready for
the Next Lesson
Plot each point on a coordinate plane. (Lesson 4-1)
47. A(2, 1) 48. B(4, 0) 49. C(1, 5)
50. D(1, 1) 51. E(2, 3) 52. F(4, 3)
53. CHEMISTRY Jamaal needs a 25% solution of nitric acid. He has 20 milliliters of a 30% solution. How many milliliters of a 15% solution should he add to obtain the required 25% solution? (Lesson 3-9)
Two dice are rolled and their sum is recorded. Find each probability. (Lesson 2-6)
54. P(sum is less than 9) 55. P(sum is greater than 10)
56. P(sum is less than 7) 57. P(sum is greater than 4)
PREREQUISITE SKILL Write a set of ordered pairs that represents the data in the table. (To review ordered pairs, see Lesson 1-8.)
58.
59.
1 2 3 4 5 6
9.95 11.45 12.95 14.45 15.95 17.45
Number of toppings Cost of large pizza ($)
Extending
the Lesson
0 5 10 15 20 25 30
100 90 81 73 66 60 55
204Investigating Slope-Intercept Form
A Preview of Lesson 4-3
Graph the relation {(3, 7), (8, 12), (5, 7), (11, 1)}.
Choose the viewing window.
• Be sure you can see all of the points.[10, 15] scl: 1 by [5, 15] scl: 1
KEYSTROKES: 10 15
1 5 15 1
Graph the relation.
• Display the graph.KEYSTROKES:
[10, 15] scl: 1 by [5, 15] scl: 1 GRAPH
The x-axis will go from 10 to 15 with a tick mark at every unit.
ENTER ENTER
ENTER
ENTER ENTER
WINDOW
Enter the data.
• Enter the x-coordinates in L1and the
y-coordinates in L2.
KEYSTROKES: 3 8
5 11 7
12 7 1
Format the graph.
• Turn on the statistical plot.KEYSTROKES:
• Select the scatter plot, L1as the Xlistand L2
as the Ylist.
KEYSTROKES:
ENTER L2
2nd
ENTER
L1
2nd
ENTER
ENTER ENTER
STAT PLOT
2nd
The first ordered pair is (3, 7).
ENTER ENTER
ENTER
ENTER ENTER
ENTER ENTER
ENTER ENTER
STAT
Graphs of Relations
You can represent a relation as a graph using a TI-83 Plus graphing calculator.
Exercises
Graph each relation. Sketch the result.
1. {(10, 10), (0, 6), (4, 7), (5, 2)} 2. {(4, 1), (3, 5), (4, 5), (5, 1)}
3. {(12, 15), (10, 16), (11, 7), (14, 19)} 4. {(45, 10), (23, 18), (22, 26), (35, 26)}
5. MAKE A CONJECTURE How are the values of the domain and range used to determine the scale of the viewing window?
(continued on the next page)
REPRESENT RELATIONS
Recall that a relation is a set of ordered pairs. A relation can be represented by a set of ordered pairs, a table, a graph, or a . A mapping illustrates how each element of the domain is paired with an element in the range. Study the different representations of the same relation below.Ordered Pairs Table Graph Mapping
(1, 2) (2, 4) (0, 3)
X Y
1
2 0
2 4
3
y
x O
mapping
Relations
Lesson 4-3 Relations 205
Vocabulary
• mapping • inverse
Represent a Relation
a. Express the relation {(3, 2), (1, 4), (0, 3), (3, 4), (2, 2)} as a table, a graph, and a mapping.
Table Graph
List the set of x-coordinates in the Graph each ordered pair first column and the corresponding on a coordinate plane.
y-coordinates in the second column.
y
x O
Example
1
Example
1
Look Back
To review relations, see Lesson 1-8.
Study Tip
can relations be used to
represent baseball statistics?
can relations be used to
represent baseball statistics?
Ken Griffey, Jr.
Year HomeRuns Strikeouts
2001 1994
1995
1996
1997
1998
1999
2000
22 40
17
49
56
56
48
40
72 73
53
104
121
121
108
117
Ken Griffey, Jr.’s, batting statistics for home runs and strikeouts can be represented as a set of ordered pairs. These statistics are shown in the table at the right, where the first coordinates represent the number of home runs and the second coordinates represent the number of strikeouts. You can plot the ordered pairs on a graph to look for patterns in the distribution of the points.
• Represent relations as sets of ordered pairs, tables, mappings, and graphs.
• Find the inverse of a relation.
x y
3 2
1 4
0 3
3 4
2 2
x y
1 2
2 4
Inverse of a Relation
Relation Q is the inverse of relation S if and only if for every ordered pair (a, b) in S, there is an ordered pair (b, a) in Q.
Mapping
List the x values in set X and the y values in set Y. Draw an arrow from each x value in X to the corresponding y value in Y.
b. Determine the domain and range.
The domain for this relation is {3, 2, 1, 0, 3}.
The range is {3, 2, 2, 4}.
X Y
3
1 0
3
2
2 4
3
2
Use a Relation
BALD EAGLES In 1990, New York purchased 12,000 acres for the protection of bald eagles. The table shows the number of eagles observed in New York during the annual mid-winter bald eagle survey from 1993 to 2000.
a. Determine the domain and range of the relation.
The domain is {1993, 1994, 1995, 1996, 1997, 1998, 1999, 2000}. The range is {102, 116, 144, 174, 175, 177, 244, 350}.
b. Graph the data.
• The values of the x-axis need to go from 1993 to 2000. It is not practical to begin the scale at 0. Begin at 1992 and extend to 2001 to include all of the data. The units can be 1 unit per grid square.
• The values on the y-axis need to go from 102 to 350. In this case, it is possible to begin the scale at 0. Begin at 0 and extend to 400. You can use units of 50.
c. What conclusions might you make from the graph of the data?
The number of eagles has increased each year. This may be due to the efforts of those who are protecting the eagles in New York.
Number of Eagles
150 100 200
50 0 250 300 350 400
Year ’95 ’94 ’93
’92 ’96’97’98’99’00 ’01
Example
2
Example
2
Domain and
Range
When writing the elements of the domain and range, if a value is repeated, you need to list it only once.
Study Tip
Bald Eagles
The bald eagle is not really bald. Its name comes from the Old English meaning of bald, “having white feathers on the head.” Source: Webster’s Dictionary1993 1994 1995 1996 1997 1998 1999 2000
102 116 144 174 175 177 244 350
Bald Eagle Survey Year
Number of Eagles
INVERSE RELATIONS
The of any relation is obtained by switching the coordinates in each ordered pair.inverse Source:New York Department of Environmental Conservation
Relations and Inverses
• Graph the relation {(3, 4), (2, 5), (4, 3), (5, 6), (1, 0), (0, 2)} on grid paper using a colored pencil. Connect the points in order using the same colored pencil.
• Use a different colored pencil to graph the inverse of the relation, connecting the points in order.
• Fold the grid paper through the origin so that the positive y-axis lies on top of the positive x-axis. Hold the paper up to a light so that you can see all of the points you graphed.
Analyze
1. What do you notice about the location of the points you graphed when you looked at the folded paper?
2. Unfold the paper. Describe the transformation of each point and its inverse.
3. What do you think are the ordered pairs that represent the points on the fold line? Describe these in terms of x and y.
Make a Conjecture
4. How could you graph the inverse of a function without writing ordered pairs first?
Lesson 4-3 Relations 207
Relation Inverse
(2, 5) (5, 2) (3, 2) (2, 3)
(6, 7) (7, 6) (5, 1) (1, 5)
Notice that the domain of a relation becomes the range of the inverse and the range of a relation becomes the domain of the inverse.
y
x O
(1, 5)
(3, 2)
(2, 3) (5, 1) (2, 5)
(5, 2) (6, 7)
(7, 6)
www.algebra1.com/extra_examples
Inverse Relation
Express the relation shown in the mapping as a set of ordered pairs. Then write the inverse of the relation.
Relation Notice that both 2 and 3 in the domain are paired with 4 in the range.
{(2, 4), (3, 4), (5, 7), (6, 8)}
Inverse Exchange x and y in each ordered pair to write the inverse relation.
{(4, 2), (4, 3), (7, 5), (8, 6)} The mapping of the inverse is shown at the right. Compare this to the mapping of the relation.
X Y
4
7
8
2 3 5 6
X Y
2 3 5 6
4
7
8
Example
3
1. Describethe different ways a relation can be represented.
2. OPEN ENDED Give an example of a set of ordered pairs that has five elements in its domain and four elements in its range.
3. Statethe relationship between the domain and range of a relation and the domain and range of its inverse.
Express each relation as a table, a graph, and a mapping. Then determine the domain and range.
4. {(5, 2), (8, 3), (7, 1)} 5. {(6, 4), (3, 3), (1, 9), (5, 3)}
6. {(7, 1), (3, 0), (2, 5)} 7. {(4, 8), (1, 9), (4, 7), (6, 9)}
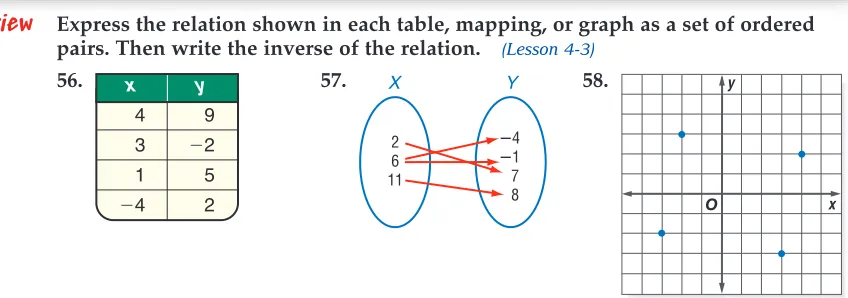
Express the relation shown in each table, mapping, or graph as a set of ordered pairs. Then write the inverse of the relation.
8. 9. 10.
11. 12. 13.
TECHNOLOGY For Exercises 14–17, use the graph of the average number of students per computer in U.S. public schools.
14. Name three ordered pairs from the graph.
15. Determine the domain of the relation.
16. Estimate the least value and the greatest value in the range.
17. What conclusions can you make from the graph of the data?
Online Research
Data Update What is the average number of students per computer in your state? Visit www.algebra1.com/data_update to learn more.Average Number of Students per Computer 22 18 14 10 6.1 25 16 10.5 7.8 5.7 20
Students per Computer 5 0 10 15 20 25 30 Year ’8 8 –’89 ’8 9 –’90 ’9 0 –’91 ’9 1 –’92 ’9 2 –’93 ’9 3 –’94 ’9 4 –’95 ’9 5 –’96 ’9 6 –’97 ’9 7 –’98 ’9 8 –’99
Source: Quality Education Data
y x O y x O X Y 2 3 4 5 6 7 8 X Y 3 5 7 0 2 4
Concept Check
Guided Practice
Application
GUIDED PRACTICE KEYx y
3 2
6 7 4 3 6 5 x y 4 9 2 5
2 2
Practice and Apply
Practice and Apply
Express each relation as a table, a graph, and a mapping. Then determine the domain and range.
18. {(4, 3), (1, 7), (1, 3), (2, 9)} 19. {(5, 2), (5, 0), (6, 4), (2, 7)}
20. {(0, 0), (6, 1), (5, 6), (4, 2)} 21. {(3, 8), (3, 7), (2, 9), (1, 9)}
22. {(4, 2), (3, 4), (1, 2), (6, 4)} 23. {(0, 2), (5, 1), (0, 6), (1, 9)}
24. {(3, 4), (4, 3), (2, 2), (5, 4), (4, 5)} 25. {(7, 6), (3, 4), (4, 5), (2, 6), (3, 2)}
Express the relation shown in each table, mapping, or graph as a set of ordered pairs. Then write the inverse of the relation.
26. 27. 28.
29. 30. 31.
32. 33. 34.
35. 36. 37.
COOKING For Exercises 38–40, use the table that shows the boiling point of water at various altitudes.
Many recipes have different cooking times for high altitudes. This is due to the fact that water boils at a lower temperature in higher altitudes.
38. Graph the relation.
39. Write the inverse as a set of ordered pairs.
40. How could you estimate your altitude by finding the boiling point of water at your location?
y x O y x O X Y 0 4 7 8 2 3 5 7 X Y 2 5 8 4 3 6 7 11 y x O y x O X Y 1 4 6 8 1 0 5 X Y 6 4 3 1 2 3 5 7
Lesson 4-3 Relations 209 www.algebra1.com/self_check_quiz
Homework Help
For See Exercises Examples 18–25 1 26–37 3 38–48 2Extra Practice
See page 829.x y 1 16.50 1.75 28.30 2.5 49.10 3.25 87.60 4 103.40 x y 0 3 5 2 4 7 3 2 x y 0 0 4 7 8 10.5 12 13 16 14.5 x y 1 2 3 4 5 6 7 8
Altitude Boiling Point (feet) of Water (°F)
0 212.0 1000 210.2 2000 208.4 3000 206.5 5000 201.9 10,000 193.7
FOOD For Exercises 41–43, use the graph that shows the annual production of corn from 1991–2000.
41. Estimate the domain and range of the relation.
42. Which year had the lowest production? the highest?
43. Describe any pattern you see.
HEALTH For Exercises 44–48, use the following information.
A person’s muscle weight is about 2 pounds of muscle for each 5 pounds of body weight.
44. Make a table to show the relation between body and muscle weight for people weighing 100, 105, 110, 115, 120, 125, and 130 pounds.
45. What are the domain and range?
46. Graph the relation.
47. What are the domain and range of the inverse?
48. Graph the inverse relation.
49. CRITICAL THINKING Find a counterexample to disprove the following.
The domain of relation F contains the same elements as the range of relation G. The range of relation F contains the same elements as the domain of relation G. Therefore, relation G must be the inverse of relation F.
50. Answer the question that was posed at the beginning of the lesson.
How can relations be used to represent baseball statistics?
Include the following in your answer:
• a graph of the relation of the number of Ken Griffey, Jr.’s, home runs and his strikeouts, and
• an explanation of any relationship between the number of home runs hit and the number of strikeouts.
For Exercises 51 and 52, use the graph at the right. 51. State the domain and range of the relation.
D {0, 2, 4}; R {4, 2, 0, 2, 4} D {4, 2, 0, 2, 4}; R {0, 2, 4} D {0, 2, 4}; R {4, 2, 0}
D {4, 2, 0, 2, 4}; R {4, 2, 0, 2, 4}
52. SHORT RESPONSE Graph the inverse of the relation.
For Exercises 53–56, use a graphing calculator. a. Graph each relation.
b. State the WINDOW settings that you used.
c. Write the coordinates of the inverse. Then graph the inverse.
d. Name the quadrant in which each point of the relation and its inverse lies. 53. {(0, 10), (2, 8), (6, 6), (9, 4)} 54. {(1, 18), (2, 23), (3, 28), (4, 33)}
55. {(35, 12), (48, 25), (60, 52)} 56. {(92, 77), (93, 200), (19, 50)}
D C B A
y
x O
WRITING IN MATH
Standardized
Test Practice
Graphing
Calculator
Farmers growing bumper crop
USA TODAY Snapshots
®By Suzy Parker, USA TODAY Source: National Agricultural Statistics Service
U.S. farmers are predicted to produce a billion more bushels of corn than last year. Annual production:
Billions of bushels
’91 ’93 ’95 ’97 ’99 2000 10.4
7.5 10
9
8
7
6
Maintain Your Skills
Maintain Your Skills
Lesson 4-3 Relations 211
Mixed Review
Getting Ready for
the Next Lesson
Identify each transformation as a reflection, translation, dilation, or rotation.
(Lesson 4-2)
57. 58. 59.
Write the ordered pair for each point shown at the right. Name the quadrant in which the point is located. (Lesson 4-1)
60. A 61. K
62. L 63. W
64. B 65. P
66. R 67. C
68. HOURLY PAY Dominique earns $9.75 per hour. Her employer is increasing her hourly rate to $10.15 per hour. What is the percent of increase in her salary? (Lesson 3-7)
Simplify each expression. (Lesson 2-4)
69. 729 70. 10515
71. 31
3 72. 16
1 4 73. 54n
6
78
74. 98x
7 35y
PREREQUISITE SKILL Find the solution set for each equation if the replacement set is {3, 4, 5, 6, 7, 8}. (To review solution sets, see Lesson 1-3.)
75. a15 20 76. r6 2
77. 9 5n6 78. 3 8w35
79. g
315 17 80.
m 5
3 52
y
x O
A B C
R
P L W
K
P
ractice Quiz 1
P
ractice Quiz 1
Plot each point on a coordinate plane. (Lesson 4-1)
1. Q(2, 3) 2. R(4, 4) 3. S(5, 1) 4. T(1, 3)
Find the coordinates of the vertices of each figure after the given transformation is performed. Then graph the preimage and its image. (Lesson 4-2)
5. triangle ABC with A(4, 8), B(7, 5), and C(2, 1) reflected over the x-axis
6. quadrilateral WXYZ with W(1, 0), X(2, 3), Y(4, 1), and Z(3, 3) translated 5 units to the left and 4 units down
State the domain, range, and inverse of each relation. (Lesson 4-3)
7. {(1, 3), (4, 6), (2, 3), (1, 5)} 8. {(2, 6), (0, 3), (4, 2), (8, 5)}
9. {(11, 5), (15, 3), (8, 22), (11, 31)} 10. {(5, 8), (1, 0), (1, 4), (2, 7), (6, 3)}
SOLVE EQUATIONS
The equation p0.69d is an example of an. A of an equation in two variables is an ordered pair that results in a true statement when substituted into the equation.
solution equation in two variables
Since the solutions of an equation in two variables are ordered pairs, the equation describes a relation. So, in an equation involving x and y, the set of x values is the domain, and the corresponding set of y values is the range.
Equations as Relations
Solve Using a Replacement Set
Find the solution set for y2x3,given the replacement set {(2, 1), (1, 3), (0, 4), (3, 9)}.
Make a table. Substitute each ordered pair into the equation.
The ordered pairs (2, 1) and (3, 9) result in true statements. The solution set is {(2, 1), (3, 9)}.
Example
1
Example
1
Solve Using a Given Domain
Solve ba5 if the domain is {3, 1, 0, 2, 4}.Make a table. The values of a come from the domain. Substitute each value of a into the equation to determine the values of b in the range.
The solution set is {(3, 2), (1, 4), (0, 5), (2, 7), (4, 9)}.
Example
2
Example
2
Study Tip
x y y2x3 True or False?
2 1 12(2)3
1 1 true
1 3 32(1)3
3 1 false
0 4 42(0)3
4 3 false
3 9 92(3)3
9 9 true
a a5 b (a, b)
3 35 2 (3, 2)
1 15 4 (1, 4) 0 05 5 (0, 5)
2 25 7 (2, 7)
4 45 9 (4, 9)
Variables
Unless the variables are chosen to represent real quantities, when variables other than xand yare used in an equation, assume that the letter that comes first in the alphabet is the domain.
are equations of relations
important in traveling?
are equations of relations
important in traveling?
• Use an equation to determine the range for a given domain.
• Graph the solution set for a given domain.
During the summer, Eric will be taking a trip to England. He has saved $500 for his trip, and he wants to find how much that will be worth in British pounds sterling. The exchange rate today is 1 dollar 0.69 pound. Eric can use the equation p0.69d to convert dollars d to pounds p.
Lesson 4-4 Equations as Relations 213
GRAPH SOLUTION SETS
You can graph the ordered pairs in the solution set for an equation in two variables. The domain contains values represented by theindependent variable. The range contains the corresponding value represented by the dependent variable.
When you solve an equation for a given variable, that variable becomes the dependent variable. That is, its value depends upon the domain values chosen for the other variable.
www.algebra1.com/extra_examples
Solve and Graph the Solution Set
Solve 4x2y10 if the domain is {1, 0, 2, 4}. Graph the solution set.
First solve the equation for y in terms of x. This makes creating a table of values easier.
4x2y10 Original equation
4x2y4x10 4x Subtract 4x from each side.
2y10 4x Simplify.
2
2
y
10
2
4x
Divide each side by 2.
y5 2x Simplify.
Substitute each value of x from the domain to determine the corresponding values of y in the range.
Graph the solution set {(1, 7), (0, 5), (2, 1), (4, 3)}.
Example
3
Example
3
Solve for a Dependent Variable
Refer to the application at the beginning ofthe lesson. Eric has made a list of the expenses he plans to incur while in England. Use the conversion rate to find the equivalent U.S. dollars for these amounts given in pounds (£) and graph the ordered pairs.
Explore In the equation p0.69d, d represents U.S. dollars and p represents British pounds. However, we are given values in pounds and want to find values in dollars. Solve the equation for d since the values of d depend on the given values of p.
p0.69d Original equation
0.
p
69
0
0
.6
.6
9
9
d
Divide each side by 0.69.
1.45pd Simplify and round to the nearest hundredth.
(continued on the next page)
Example
4
Example
4
Study Tip
x 5 2x y (x, y)
1 5 2(1) 7 (1, 7) 0 5 2(0) 5 (0, 5)
2 5 2(2) 1 (2, 1)
4 5 2(4) 3 (4, 3)
y
x O
Daily Exp
enses
Hotel
Meals
Transporta
tion
Entertain
ment
30
15
6
40
Look Back
Guided Practice
Plan The values of p, {40, 30, 15, 6}, are the domain. Use the equation
d1.45p to find the values for the range.
Solve Make a table of values. Substitute each value of p from the domain to determine the corresponding values of d. Round to the nearest dollar.
Graph the ordered pairs. Notice that the values for the independent variable p are graphed along the horizontal axis, and the values for dependent variable d are graphed along the vertical axis.
Examine Look at the values in the range. The cost in dollars is higher than the cost in pounds. Do the results make sense?
1. Describehow to find the domain of an equation if you are given the range.
2. OPEN ENDED Give an example of an equation in two variables and state two solutions for your equation.
3. FIND THE ERROR Malena says that (5, 1) is a solution of y2x3. Bryan says it is not a solution.
Who is correct? Explain your reasoning.
Find the solution set for each equation, given the replacement set. 4. y3x4; {(1, 1), (2, 10), (3, 12), (7, 1)}
5. 2x5y1; {(7, 3), (7, 3), (2, 1), (2, 1)}
Solve each equation if the domain is {3, 1, 0, 2}.
6. y2x1 7. y4 x
8. 2y2x12 9. 3x2y13
Solve each equation for the given domain. Graph the solution set. 10. y3x for x{3, 2, 1, 0, 1, 2, 3}
11. 2yx2 for x{4, 2, 0, 2, 4}
Concept Check
GUIDED PRACTICE KEY
p 1.45p d (p, d )
40 1.45(40) 58.00 (40, 58)
30 1.45(30) 43.50 (30, 44)
15 1.45(15) 21.75 (15, 22)
6 1.45(6) 8.70 (6, 9)
Expense Pounds Dollars
Hotel 40 58
Meals 30 43
Entertainment 15 22
Transportation 6 9
Dollars
20 10
0 30 40
Pounds
10 40 50
50 60
60 20 30
Bryan y = 2x + 3 1 = 2(5) + 3
1 =/ 13
Malena y = 2x + 3 5 = 2(1) + 3
Lesson 4-4 Equations as Relations 215
Application
www.algebra1.com/self_check_quiz
Practice and Apply
Practice and Apply
Homework Help
For See
Exercises Examples 14–19 1 20–31 2 32–39 3 40–45 4
Extra Practice
See page 829.Find the solution set for each equation, given the replacement set. 14. y4x1; {(2, 1), (1, 5), (9, 2), (0, 1)}
15. y8 3x; {(4, 4), (8, 0), (2, 2), (3, 3)}
16. x3y 7; {(1, 2), (2, 1), (2, 4), (2, 3)}
17. 2x2y6; {(3, 0), (2, 1), (2, 1), (4, 1)}
18. 3x8y 4; {(0, 0.5), (4, 1), (2, 0.75), (2, 4)}
19. 2y4x8; {(0, 2), (3, 0.5), (0.25, 3.5), (1, 2)}
Solve each equation if the domain is {2, 1, 1, 3, 4}.
20. y4 5x 21. y2x3 22. xy4
23. x7 y 24. 6x3y18 25. 6xy 3
26. 8x4y12 27. 2x2y0 28. 5x10y20
29. 3x2y14 30. x12y8 31. 2x13y4
Solve each equation for the given domain. Graph the solution set. 32. y2x3 for x{3, 2, 1, 1, 2, 3}
33. y3x1 for x{5, 2, 1, 3, 4}
34. 3x2y5 for x{3, 1, 2, 4, 5}
35. 5x4y8 for x{4, 1, 0, 2, 4, 6}
36. 12xy2 for x{4, 1, 1, 4, 7, 8}
37. y14x3 for x{4, 2, 0, 2, 4, 6}
38. The domain for 3xy8 is {1, 2, 5, 8}. Find the range.
39. The range for 2yx6 is {4, 3, 1, 6, 7}. Find the domain.
TRAVEL For Exercises 40 and 41, use the following information.
Heinrich and his brother live in Germany. They are taking a trip to the United States and have been checking the average temperatures in different U.S. cities for the month they will be traveling. They are unfamiliar with the Fahrenheit scale, so they would like to convert the temperatures to Celsius. The equation F1.8C32 relates the temperature in degrees Celsius C to degrees Fahrenheit F.
40. Solve the equation for C.
41. Find the temperatures in degrees Celsius for each city.
JEWELRY For Exercises 12 and 13, use the following information.
Since pure gold is very soft, other metals are often added to it to make an alloy that is stronger and more durable. The relative amount of gold in a piece of jewelry is measured in karats. The formula for the relationship is g2
6 5k
, where k is the number of karats and g is the percent of gold in the jewelry.
12. Find the percent of gold if the domain is {10, 14, 18, 24}. Make a table of values and graph the function.
13. How many karats are in a ring that is 50% gold?
City Temperature (°F)
New York 34
Chicago 23
San Francisco 55
Miami 72
GEOMETRY For Exercises 42–44, use the following information.
The equation for the perimeter of a rectangle is P22w. Suppose the perimeter of rectangle ABCD is 24 centimeters.
42. Solve the equation for .
43. State the independent and dependent variables.
44. Choose five values for w and find the corresponding values of .
45. ANTHROPOLOGY When the remains of ancient people are discovered, usually only a few bones are found. Anthropologists can determine a person’s height by using a formula that relates the length of the tibia T (shin bone) to the person’s height H, both measured in centimeters. The formula for males is H81.7 2.4T and for females is H72.6 2.5T. Copy and complete the tables below. Then graph each set of ordered pairs.
46. RESEARCH Choose a country that you would like to visit. Use the Internet or other reference to find the cost of various services such as hotels, meals, and transportation. Use the currency exchange rate to determine how much money in U.S. dollars you will need on your trip.
47. CRITICAL THINKING Find the domain values of each relation if the range is {0, 16, 36}.
a. yx2 b. y4x16 c. y4x16 48. CRITICAL THINKING Select five values for the domain and find the range of
yx4. Then look at the range and domain of the inverse relation. Make a conjecture about the equation that represents the inverse relation.
49. Answer the question that was posed at the beginning of the lesson.
Why are equations of relations important in traveling?
Include the following in your answer:
• an example of how you would keep track of how much you were spending in pounds and the equivalent amount in dollars, and
• an explanation of your spending power if the currency exchange rate is 0.90 pound compared to one U.S. dollar or 1.04 pounds compared to one dollar.
50. If 3xy18 and y3, then x
4. 5. 6. 7.
51. If the perimeter of a rectangle is 14 units and the area is 12 square units, what are the dimensions of the rectangle?
26 3 3
3 4 D 1 12
C
B A
D C
B A
WRITING IN MATH
Standardized
Test Practice
More About . . .
Forensic
Anthropologist
Forensic anthropologists assist police investigations. They can determine the age and stature of a victim by examining dental wear on the teeth and measuring certain bones.Online Research
For information about a career as a forensic anthropologist, visit: www.algebra1.com/ careers
Male Length of Height
Tibia (cm) (cm) (T, H )
30.5
34.8
36.3
37.9
Female Length of Height
Tibia (cm) (cm) (T, H )
30.5
34.8
36.3
Maintain Your Skills
Maintain Your Skills
Lesson 4-4 Equations as Relations 217 TABLE FEATURE You can enter selected x values in the TABLEfeature of a
graphing calculator, and it will calculate the corresponding y values for a given equation. To do this, enter an equation into the Ylist. Go to TBLSETand highlight Ask
under the Independent variable. Now you can use the TABLEfunction to enter any domain value and the corresponding range value will appear in the second column.
Use a graphing calculator to find the solution set for the given equation and domain.
52. y3x4; x{11, 15, 23, 44}
53. y 6.5x42; x{8, 5, 0, 3, 7, 12}
54. y3x12 for x{0.4, 0.6, 1.8, 2.2, 3.1}
55. y1.4x0.76 for x{2.5, 1.75, 0, 1.25, 3.33}
Express the relation shown in each table, mapping, or graph as a set of ordered pairs. Then write the inverse of the relation. (Lesson 4-3)
56. 57. 58.
Find the coordinates of the vertices of each figure after the given transformation is performed. Then graph the preimage and its image. (Lesson 4-2)
59. triangle XYZ with X(6, 4), Y(5, 0), and Z(3, 3) reflected over the y-axis
60. quadrilateral QRST with Q(2, 2), R(3, 3), S(1, 4) and T(4, 3) rotated 90° counterclockwise about the origin
Use cross products to determine whether each pair of ratios forms a proportion. Write yes or no. (Lesson 3-6)
61.
1 6
5
, 1
4 8 5
62.
1 1 2 1
, 3
3 3 4
63.
2 8
2
, 2
5 0 5
64. 68, 43 65. 35, 295 66. 2356, 1125
Identify the hypothesis and conclusion of each statement. (Lesson 1-7)
67. If it is hot, then we will go swimming.
68. If you do your chores, then you get an allowance.
69. If 3n7 17, then n8.
70. If ab and bc, then ac.
PREREQUISITE SKILL Solve each equation. (To review solving equations, see Lesson 3-4.)
71. a15 20 72. r9 12
73. 4 5n6 74. 3 8w35
75. g
42 5 76.
m 5
3 52
y
x O
4 1 7 8
X
2 6 11
Y
Mixed Review
Getting Ready for
the Next Lesson
Graphing
Calculator
x y
4 9
3 2
1 5
Standard Form of a Linear Equation
The standard form of a linear equation is
AxByC,
where A0, A and B are not both zero, and A, B, and C are integers whose greatest common factor is 1.
IDENTIFY LINEAR EQUATIONS
A can be written in theform AxByC. This is called the standard formof a linear equation.
linear equation
Vocabulary
• linear equation • standard form • x-intercept • y-interceptGraphing Linear Equations
• Determine whether an equation is linear.
• Graph linear equations.
Nutritionists recommend that no more than 30% of a person’s daily caloric intake come from fat. Each gram of fat contains nine Calories. To determine the most grams of fat f you should have, find the total number of Calories C you consume each day and use the equation
f0.3
C9or f3C0. The graph of this equation shows the maximum number of grams of fat you can consume based on the total number of Calories consumed.Grams of Fat 40 20
0 60 80 100
Total Calories
500 1000 150020003500 3000
f C
30
f
C
can linear equations be used in nutrition?
can linear equations be used in nutrition?
Identify Linear Equations
Determine whether each equation is a linear equation. If so, write the equation in standard form.
a. y5 2x
First rewrite the equation so that both variables are on the same side of the equation.
y5 2x Original equation
y2x5 2x2x Add 2x to each side.
2xy5 Simplify.
The equation is now in standard form where A2, B1, and C5. This is a linear equation.
b. 2xy5y6
Since the term 2xy has two variables, the equation cannot be written in the form
AxByC. Th