Volume 6, number 1 | April 2017
N
IC
H
O
LA
S
T
. A
RND
T
LL
U
ÍS
F
O
NTBO
TÉ
JEF
FR
EY
W
. HED
EN
Q
U
IS
T
ST
EP
HEN
E
. K
ESL
ER
JO
HN
F.H
. T
H
O
M
PS
O
N
D
AN
IEL G
. W
O
O
D
Future Global
L
ianeG. B
enninGGFZ Potsdam, Germany University of Leeds, UK
S
tevena. B
anwartUniversity of Leeds, UK
Editorial Board
t
ime
LLiottUniversity of Bristol, UK
D
onC
anfieLDUniversity of Southern Denmark, Denmark
S
uSanL.S. S
tippUniversity of Copenhagen, Denmark
Editorial Manager
m
arie-a
uDeH
uLSHoffGraphical Advisor
J
uanD
ieGor
oDriGuezB
LanCoTrinity College Dublin, Ireland Each issue of Geochemical Perspectives
pre-sents a single article with an in-depth view on the past, present and future of a field of geochemistry, seen through the eyes of highly respected members of our community. The articles combine research and history of the field’s development and the scientist’s opinions about future directions. We welcome personal glimpses into the author’s scientific life, how ideas were generated and pitfalls along the way.
Perspectives articles are intended to appeal to the entire geochemical community, not only to experts. They are not reviews or monographs; they go beyond the current state of the art, providing opinions about future directions and impact in the field.
Copyright 2017 European Association of Geochemistry, EAG. All rights reserved. This journal and the individual contributions contained in it are protected under copy-right by the EAG. The following terms and conditions apply to their use: no part of this publication may be reproduced, translated to another language, stored in a retrieval system or transmitted in any form or by any means, electronic, graphic, mechanical, photo-copying, recording or otherwise, without prior written permission of the publisher. For information on how to seek permission for reproduction, visit:
www.geochemicalperspectives.org
or contact [email protected]. The publisher assumes no responsibility for any statement of fact or opinion expressed in the published material.
ISSN 2223-7755 (print) ISSN 2224-2759 (online) DOI 10.7185/geochempersp.6.1
Principal Editor for this issue
Janne Blichert-Toft
Reviewers
Damien Giurco, University of Technology Sydney, Australia
Ross Large, University of Tasmania, Australia Larry Meinert, US Geological Survey, USA Eric Oelkers, University College London, UK & CNRS Toulouse, France.
Richard Sillitoe, Highgate Village, UK
Cover LayoutPouliot Guay Graphistes
TypesetterInfo 1000 Mots
PrinterDeschamps impression
About the cover
New tunnel at El Teniente, Chile, in operation for over a century and now the largest underground Cu mine. This development will add 50 years of mine life and 17 Mt of Cu metal from ~2 km depth using panel caving, a new style of mass underground mining. This development illustrates a “light at the end of the tunnel” for supply of a large fraction of the world’s minerals, as mining shifts underground and reduces its surface footprint.
J
anneB
LiCHert-t
oftI GEOCHEMICALPERSPECTIVES | N I C O L A S T. A R N D T ◆ L L U Í S FO N T B O T É ◆
J E F F R E Y W. H E D E N Q U I S T ◆ S T E P H E N E . K E S L E R ◆ J O H N F. H . T H O M P S O N ◆ DA N I E L G . WO O D
CONTENTS
Preface . . . . V
Future Global Mineral Resources . . . . 1
Abstract . . . . 1
1 . Metals and Minerals, now and in the Future . . . . 3
1 .1 Introduction . . . . 3
1 .2 Is Recycling the Answer? . . . . 3
1 .3 Reserves, Ore Reserves, Resources and Mineral Resources: Definitions Matter . . . . 6
1 .4 The Dynamic Nature of Reserves . . . . 10
1 .5 Why Do We Focus on Cu? . . . . 13
1 .6 Conclusion . . . . 17
2 . Formation of Mineral Deposits . . . . 18
2 .1 What is an Ore Deposit? . . . . 18
2 .2 Ore Grades and Ore Minerals . . . . 19
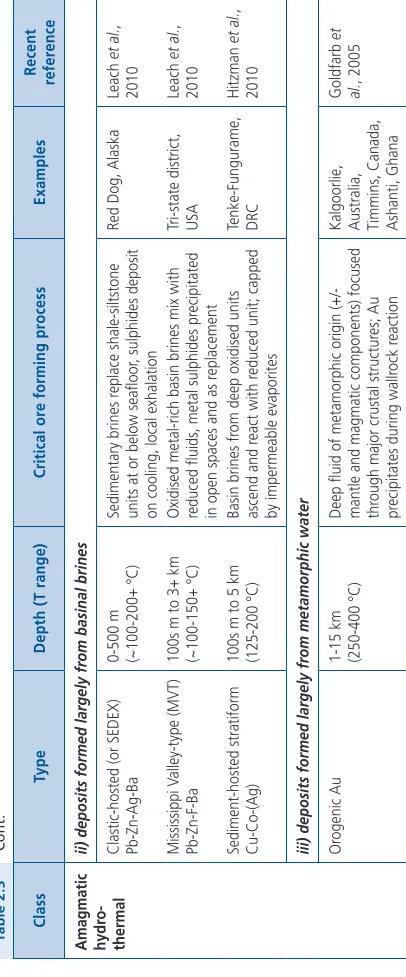
2 .3 Classification of Ore Deposits . . . . 24
2 .4 Orthomagmatic Ore Deposits . . . . 32
2 .5 .1 Hydrothermal deposits in intrusive-volcanic
environments . . . . 37
2 .5 .2 Hydrothermal deposits hosted by sedimentary rocks . . . . . 41
2 .5 .3 Hydrothermal deposits in metamorphic environments . . . . 44
2 .6 Sedimentary Ore Deposits . . . . 44
2 .6 .1 Banded iron formations and iron ore deposits . . . . 44
2 .6 .2 Placer deposits . . . . 45
2 .7 Ore Deposits Produced by Weathering . . . . 46
2 .8 Global Controls on the Distribution of Ore Deposits . . . . 47
2 .8 .1 Ore deposits and Earth evolution . . . . 47
2 .8 .2 Metallogenic provinces . . . . 49
2 .9 Future Resources – New Types and New Locations of Ore Deposits . . . . 50
3 . Mineral Exploration: Discovering and Defining Ore Bodies . . . . 52
3 .1 Introduction . . . . 52
3 .1 .1 Purpose of this section . . . . 52
3 .1 .2 Exploration objective . . . . 53
3 .1 .3 Discovery target . . . . 54
3 .2 Exploration Techniques . . . . 55
3 .2 .1 Principal search methods . . . . 55
3 .2 .2 Geology . . . . 56
3 .2 .3 Geochemistry . . . . 58
3 .2 .4 Geophysics . . . . 60
3 .2 .5 Drilling . . . . 62
3 .3 Exploration Process . . . . 64
3 .3 .1 Regional exploration . . . . 64
3 .3 .2 Prospect exploration . . . . 65
3 .3 .3 Drilling for discovery . . . . 65
3 .4 Discovery Assessment . . . . 66
3 .4 .1 Resource delineation and definition . . . . 66
3 .4 .2 Resource estimation . . . . 67
3 .4 .3 Mining studies . . . . 69
3 .5 Discovery Strategy and Success . . . . 71
3 .5 .1 Major versus junior company exploration . . . . 71
3 .5 .2 Strategy and tactics . . . . 72
3 .5 .3 Chance of success . . . . 77
3 .5 .4 Risk . . . . 78
3 .5 .5 Mining method . . . . 79
3 .5 .6 Social considerations . . . . 79
3 .6 Exploration Budget . . . . 80
3 .6 .1 Economic decisions in exploration . . . . 80
3 .6 .2 Discovery cost . . . . 82
3 .6 .3 Discovery challenges – why discovery is rarely achieved . . . 82
4 . Exploiting Mineral Deposits . . . . 86
4 .1 Introduction . . . . 86
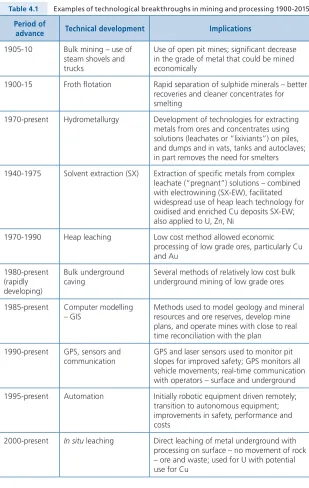
4 .2 Historical Background . . . . 88
4 .2 .1 Ancient mining to the Industrial Revolution – 40,000 BP to ~200 BP . . . . 89
4 .2 .2 Industrial revolutions 1760-1910 . . . . 92
4 .3 Mining – the Past 150 Years . . . . 93
4 .3 .1 Bulk surface mining . . . . 95
4 .3 .2 Concentrates – froth flotation . . . . 95
4 .3 .3 Metallurgy and new materials . . . . 96
4 .3 .4 Hydrometallurgy – heap leaching, solvent extraction and electrowinning . . . . 98
4 .3 .5 Digital technology, automation and scale . . . . 100
4 .3 .6 Health, safety and the environment . . . . 101
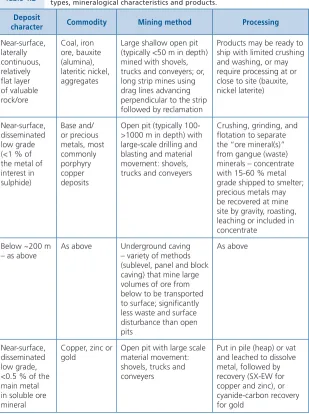
4 .4 Modern Mining and Processing Methods – Importance of Deposit Types . . . . 102
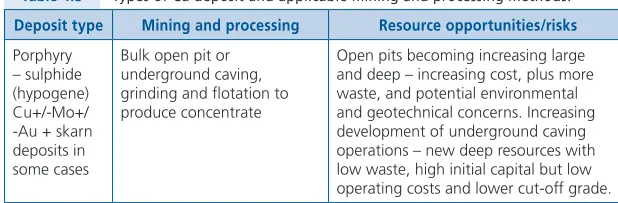
4 .5 Copper Deposits, Mining and Processing . . . . 107
4 .5 .1 Porphyry – Cu ± Mo, Au . . . . 108
4 .5 .2 Supergene oxide and sulphide-enriched porphyry Cu . . . 110
4 .5 .3 Sediment-hosted – Cu ± Ag, Co . . . . 111
4 .5 .4 Volcanogenic massive sulphide (VMS) – Cu ± Zn, Pb, Au, Ag . . . . 111
4 .5 .5 Iron oxide Cu-gold (IOCG) – Cu-Au ± U, REEs . . . . 112
4 .5 .6 Magmatic Cu-Ni ± PGEs . . . . 112
4 .6 Current Issues and Challenges . . . . 112
4 .6 .1 Jurisdictional issues . . . . 113
4 .6 .2 Community issues . . . . 114
4 .6 .3 Environmental issues . . . . 115
4 .6 .4 New materials, substitution and recycling . . . . 115
4 .7 Future Developments in Mining and Processing – Implications for Resources . . . . 116
5 . Estimating Ultimate Resources . . . . 122
5 .1 Estimating Global Mineral Resources . . . . 122
5 .1 .1 Production-based estimates . . . . 122
5 .1 .2 Peak Cu? . . . . 125
5 .2 Geology-Based Methods . . . . 127
5 .3 Extending Geologic Estimates . . . . 129
5 .3 .1 Deposit-model based estimates . . . . 129
5 .3 .2 Distribution of copper in the crust – The role of low-grade, anomalous, mineralised rock . . . . . 130
5 .3 .3 Mineralogical setting of copper in low-grade, mineralised rocks . . . . 135
5 .4 Conclusions . . . . 137
5 .5 Looking Ahead – Challenges for Geoscientists Who Will Supply Resources for Future Generations . . . . 138
References . . . . 142
Appendix to Section 3: Exploration Methods . . . . 157
PREFACE
This volume was written to provide an overview of Earth’s mineral resources – their origin, discovery and development, and their role as a source of materials that are crucial to everyone’s way of life in our modern society. For some time, pessimistic viewpoints have been expressed about long-term global mineral supplies, as illustrated in a recent Geochemical Perspectives volume by Sverdrup and Ragnarsdóttir (2014). In this article, the authors suggested that many impor-tant minerals are becoming scarce and that their production “…has either peaked already or will peak within the next 50 years.” In their opinion “… the world is heading towards a restricted access to the key resources that are used by humanity today and these restrictions will have a profound impact on the world economies and life styles of future generations.” Laherrère (2010) and Kerr (2011) proposed similarly pessi-mistic scenarios and the Club of Rome famously supported a publication, The Limits to Growth (Meadows et al., 1972) that predicted copper and aluminium would be exhausted in 21 and 31 years, respectively. Yet current reserves of these metals are larger than in 1972, despite four decades of continually increasing yearly production. Is it then reasonable to warn of imminent peak production of important mineral commodities?
general, in both research institutions and industry, can help meet the mineral demands of society. Most importantly we argue that geoscientists can act as well-informed advocates to society as a whole by developing an understanding of mineral deposits and responsible mining.
Most mineral exploration and discovery has focused on the upper few 100 m of Earth’s crust, whereas a similar density of many deposit types almost certainly is present in the upper few km. Recent technological advances allow low-grade mass mining to depths of 2-3 km to recover many of these deeper deposits, which will reduce the surface footprint and impact of mining. This is a “light at the end of the tunnel” (see cover photograph) for the future supply of a significant part of the world’s mineral resources. Similar radical changes in mineral processing and metal extraction, energy and water efficiency, and inno-vative social contracts will permit more resources of multiple commodities, both near-surface and at depth, to be mined economically in the future.
We reach the fundamental conclusion that mineral supplies will be main-tained at levels that satisfy demand well into the future, and that any peak of production of individual commodities will probably result from declining demand caused by technological or societal developments, rather than exhaustion of the resource.
The volume comprises five sections that treat different aspects of the subject. All authors contributed to the writing of each section, but to different extents, with one person having final responsibility for content and organisation. Section 1 – Introduction, presents an overview of the subject and focuses on a thorny issue of crucial importance – the difference between reserves and resources. We then explain why we have chosen the metal copper to illustrate many of the points we wish to make. Steve Kesler was the main author of this section.
Section 2 – Formation of Mineral Deposits, defines an “ore deposit”, presents methods for classifying ore deposits, describes some typical examples, and gives an overview on current thinking on how these deposits formed. All authors contributed to this section.
Section 3 – Mineral Exploration:Discovering and Defining Ore Bodies describes how mineral exploration companies go about finding new ore deposits and eval-uating their potential, plus the reasons that mining for many commodities will increasingly shift underground over the coming decades.Dan Wood and Jeff Hedenquist wrote this section.
Section 5 – Determining Reserves and Resources – Metals for Future Genera-tions considers in more depth the long-term outlook for the availability, produc-tion and consumpproduc-tion of copper and other metals, and discusses the transiproduc-tion between metal concentrations in mineable deposits and normal rocks. Steve Kesler and Nicholas Arndt wrote this section.
We thank the reviewers who contributed insightful comments and sugges-tions that have improved the volume: Damien Giurco, Ross Large, Larry Meinert, Eric Oelkers and Richard Sillitoe. We also acknowledge contributions from Antonio Arribas, Steve Barnes, Nic Beukes, Gideon Chitombo, Ernst Pernicka and Richard Schodde. And finally we thank the Editor, Janne Blichert-Toft, for her advice and unstinting assistance during all stages of the preparation of this volume.
Nicholas T. Arndt
Institut des Sciences de la Terre University Grenoble Alpes Grenoble, France
Lluís Fontboté
Department of Earth Sciences University of Geneva 1205 Geneva, Switzerland
Jeffrey W. Hedenquist
Department of Earth and Environmental Sciences University of Ottawa Ottawa, ON K1N6N5, Canada
Stephen E. Kesler
Department of Earth and Environmental Sciences University of Michigan Ann Arbor, MI 48105, USA
John F.H. Thompson
Department of Earth and Atmospheric Sciences Cornell University Ithaca, NY 14853, USA
Dan G. Wood
FUTURE GLOBAL
MINERAL RESOURCES
ABSTRACT
Some scientists and journalists, and many members of the general public, have been led to believe that the world is rapidly running out of the metals on which our modern society is based. Advocates of the peak metal concept have predicted for many decades that increasing consumption will soon lead to exhaustion of mineral resources. Yet, despite ever-increasing production and consumption, supplies of minerals have continued to meet the needs of industry and society, and lifetimes of reserves remain similar to what they were 30-40 years ago.
Over the last 150 years, improved technologies, economies of scale and increased efficiency have combined to reduce costs hence allowing lower-grade ore to be mined economically. The net result is that the long-term inflation- adjusted price of most metals has decreased more or less in parallel with increasing production, a second apparent paradox that frequently is not well understood.
Using copper as the principal example and other metals as appropriate, we summarise the latest research on ore deposits and the activities of the minerals industry. Following a description of the numerous geological processes that form ore deposits, we outline the scientific methods used by the minerals industry to explore for new deposits. We also discuss how resources are mined and how minerals are processed, as well as recent efforts to reduce related environmental impacts. Economic and societal factors influence supply, and these are as impor-tant as the actual presence of a resource. Finally, we discuss the critical roles that geoscientists will play in assuring continued supplies of minerals. These include the development of new concepts and techniques that will assist the discovery, mining, processing, remediation, and management of mineral resources. It is essential that researchers help to educate the general public about the need for continued exploration to find new resources to meet growth in world living standards.
1.
METALS AND MINERALS,
NOW AND IN THE FUTURE
1.1
Introduction
Metals and mineral products are essential for modern society. They are found in the products we use every day, from kitchen utensils to cell phones to refrigera-tors. They are the basis for construction of homes, offices and bridges, and manu-facturing of cars, trains and aeroplanes, and they are employed in more hidden ways as catalysts, medicines and fertilisers. Although per capita consumption of minerals has stabilised in developed countries, global demand will continue to rise, fuelled by the growing needs in developing countries and changing technologies.
Our mineral supplies come from ore deposits, and we must find new ones to replace those that are exhausted. To meet the growing need for copper, for example, a new, world-class deposit will need to be found at least every few years. It is obvious that Earth’s ore deposits are finite and will be exhausted if consumption continues long enough. But, how long do we have? Various govern-ment and commercial organisations provide estimates for common metals and mineral products. In most cases, these estimates amount to only 20 to 40 times current annual consumption, and this leads to the commonly voiced conclusion that supplies will be exhausted in a few decades.
This view reflects a lack of understanding of the terms “reserve” and “resource”, which are used in these estimates of supplies, and a wider failure to understand the role of mineral exploration and production in supplying our global needs. It is this issue that we address in this volume.
1.2
Is Recycling the Answer?
Before going further, it is important to dispel the common misconception that we don’t really need to produce mineral commodities from mines; why don’t we just recycle more completely the enormous amount of mineral commodities that we have produced already? Such a circular economy would allow us to avoid the nuisance of mining and processing, and their associated environmental impacts (Fig. 1.1).
to reach this level of Cu usage. The magnitude of this demand is shown by the remarkable increase in Chinese Cu consumption to a level exceeding the USA (Fig. 1.2).
Figure 1.1 Schematic illustration of an economy that requires new long-term minerals and produces waste from production of these minerals. A true circular economy would require no new mineral supplies and have no production wastes.
It is true that improvements in material use and recycling in more devel-oped countries have allowed per capita consumption to stabilise and even decline (Auci and Vignani, 2013), but this relief is small in relation to the continually increasing demand as less developed countries grow. Furthermore, recycling can never reach 100 % because a variable proportion is lost in manufacturing or use. This proportion ranges typically from 10 % to more than 50 %; several mineral commodities are used in such a dissipative way that they are virtually impossible to recycle and others are totally decomposed during use and cannot be recycled (e.g., pigments, fillers and fertilisers). Other commodities like Fe and Cu are more robust, but are susceptible to corrosion, which diminishes their quality and quantity at a surprisingly rapid rate (Davis, 2000).
Box 1.1 – New versus Recycled Metals – Despite major efforts to recycle, primary mineral production is still the dominant source of most metals. Steel is produced from a combination of Fe ore, coal, limestone and recycled steel, as well as additives such as Mn, Ni, Cr, V and W. From 1950 to 2000, yearly world steel production increased from 189 to 850 million tonnes (Mt), after which it doubled to 1621 Mt in 2015 (https://www. worldsteel.org/en/dam/jcr:4f060d8b-3602-4ffe-9e87-7e93e0659449/Word+Steel+in+-Figures+2016.pdf). In 2014, 35 % of steel production was sourced from recycled steel. The steel industry reports that 92 % of the steel in automobiles is recycled (http:// www.steel.org/sustainability/steel-recycling.aspx), although recycling from other applications is much lower.
By contrast, only 17 % of the 22.5 Mt of refined Cu produced in 2014 came from recycled metal, with the balance originating from mines. At present, a total of ~13 Mt of Zn is refined annually, of which only 8 % is recycled scrap, with the balance coming from mined deposits (www.zinc.org). For Al, recycling has increased from about 20 % in 1950 to 30 % in 2010 due largely to energy savings and incentives to recycle packaging and transportation material. Annual production of Al in this period increased from a few Mt to nearly 60 Mt (http://recycling.world-aluminium. org/review/recycling-indicators.html). Lead is by far the most efficiently recycled industrial metal. World Pb production of about 5 Mt is sourced about equally from mines and recycled material. In the USA and Europe, recycled Pb accounts for between 80 and 60 % of total production. This high rate of recycling reflects the fact that about 85 % of Pb is used in batteries, which are easily recycled (http://ila-lead. org/lead-facts/lead-recycling). Platinum and Pd in auto exhaust systems might also be recycled efficiently, although export of used cars from developed to developing countries with fewer recycling systems complicates this effort.
We are almost certainly faced with a continuation of the long history of growing demand for minerals (Fig. 1.3). So far, the only mineral commodities that have experienced a decrease in use and thus in production are metals like Hg, which is toxic (Brodkin et al., 2007). In coming decades, coal and crude oil produc-tion will decline because of their contribuproduc-tion to atmospheric CO2 levels. For
(Fe, Cu, Al, REE), as well as light-emitting diodes (LEDs; Sb, In, REE), catalytic converters (Pt, Pd, Rh, REE, Ce), electric car batteries (REE, Li) and particularly smart phones, which contain at least 60 different elements. Even when production has declined temporarily during recessions or a change in applications, it rose again. Lead, for instance, went through a phase of declining production as it was removed from petrol and paints, but has found expanded markets in batteries for sustainable electric systems. Similarly, demand for Ge dwindled and then grew again as declining demand from the semiconductor industry gave way to increased demand for a range of new-technology applications, including special glasses, LEDs, photovoltaic cells and photoreceptors.
Figure 1.3 Change in world production of base metals and steel since 1960 (from USGS, 2016).
Mineral production to satisfy both this technological evolution and the growing demand from more consumers must come from orereserves and mineral resources. These terms are at the heart of the problem in specifying long-term supplies and they require definition and explanation before we can proceed.
1.3
Reserves, Ore Reserves, Resources and Mineral Resources:
Definitions Matter
Part of the confusion reflects the different interests of the two main groups that deal with mineral supplies, government and industry. Industry provides most of the data on individual mineral deposits whereas government agencies like the U.S. Geological Survey (USGS) and other national organisations compile these and other measurements to make global estimates. So, it is important that we understand the difference between their methodologies and terminologies, and the reasons for the differences. (Note that the term “industry”, as used here, includes publicly-owned firms like BHP Billiton and Rio Tinto as well as govern-ment-owned firms like Chile’s Codelco, all of which have the goal of extracting metals from deposits at a profit.)
Industry’s principal interest in evaluating a mineral deposit is to deter-mine how much material is deter-mineable at current prices, or potentially deter-mineable if prices increase or decrease. As explained further in Section 3, quantification is done largely by drilling, which collects samples of material from the subsur-face that can be analysed. Subsequent assessment then determines whether the amount of material is present at a sufficiently high concentration, and with the continuity, form and structure necessary for economic mining and processing (including associated environmental costs). Drill holes have to be close enough together, and sample recovery good enough, to provide a statistically valid sample of the volume of rock (the “tonnage”) and its content of the element or mineral of interest (“grade”, see also Kesler and Simon, 2015, Chapter 4). Depending on both the density of sampling and the quality of material that has been sampled, material is first described by industry as a “resource” and then part of this mate-rial might be reclassified as “ore” – i.e. material that can be mined and processed economically under present conditions and at assumed future metal prices. Mate-rial that fails this test may require more complete sampling, higher metal prices, better mining methods, or other economic or technological developments to qualify as ore. If prices increase significantly, some of this material becomes ore.
The distinction between Ore Reserve and Mineral Resource must be confirmed by someone who qualifies as a “Competent Person”; i.e. a geoscien-tist with sufficient experience working on the relevant style of mineralisation and who is a member of an accredited professional organisation. This is impor-tant because the estimates have direct implications for the asset valuation of a company, and this controls its ability to finance projects by borrowing funds and/or selling equity (shares). Application of these terms is closely monitored by government agencies, and Competent Persons and associated companies signing off on an Ore Reserve and related estimates have direct legal liability. In one recent high-profile case, Royal Dutch Shell was forced by the U.S. Securities and Exchange Commission to reduce its published oil reserve figures because of apparently inadequate delineation (Gupta and Gautam, 2004). In most cases, disputes over terminology are technical matters, although some deposits have been represented fraudulently, as in the case of the huge Bre-X gold scandal (Goold and Willis, 1997).
Industry terminology is not used by most authors who write about mineral supplies. The best informed employ governmental terminology, such as that of the USGS (Fig. 1.4c), which uses the term “resources” to refer to all mineralised deposits in the planet. Resources of this type obviously include both Ore Reserves and Mineral Resources as defined by industry. Most classifications, including that of the USGS, define resources in a two-dimensional framework with one axis representing geological knowledge and the other economic feasibility. On the geological axis, the USGS distinguishes between “discovered” and “undis-covered” resources. In the “dis“undis-covered” category (on the economic axis in the left half of the diagram), there is a continuum downward from resources that have been shown to be economically mineable now (Ore Reserves) to marginal material that does not meet this criterion.
Box 1.2 – Resources, Reserves and the BBC – BBC Science published in June 2012 a report with the title “Stock check: Estimated remaining world supplies of non-renew-able resources”, with the “estimated remaining world supplies” of Cu being listed at 32 years (http://www.bbc.com/future/story/20120618-global-resources-stock-check; italics are ours). The fine print in the caption states that there is “No provision made for ... discovery of new reserves...”). In addition to using the terms “resources” and “reserves” interchangeably, they failed to take into account that reserves are not fixed but are renewed as new deposits are discovered and resources are converted to reserves by further exploration. When questioned about the terminology and conclu-sions, the BBC responded that: “The page – and the site – are designed for a general audience who we felt would not know the subtle differences between the professional terms. With the benefit of hindsight this was a mistake.” (The Future Team, BBC, personal communication to J.W. Hedenquist, 8 August 2012). On 30 August 2012, BBC added a footnote to the article: “This graphic uses the terms resources and reserves interchangeably. However, in the case of minerals, the graphic refers specifically to known reserves.” Nevertheless, the misleading original diagram – with the title “remaining world supplies of resources” – remained on their website and was still there at the time of writing this volume. BBC Science missed – and continues to miss – an opportunity to educate their “general audience”. In this, they are not alone. A metallurgy site reproduced two diagrams that are found commonly on the internet: https://www.911metallurgist.com/blog/when-will-minings-metal-tank-run-empty. It is no wonder then that common misconceptions about the need for and life of mineral resources persist, even among scientists.
In this volume, we have followed the USGS terminology: resources will refer to various estimates of all mineral material on the planet (whether known or undiscovered, and regardless of whether it is mineable or not) and reserves will refer to that part of the resource that is mineable under present conditions. Where reference is made to specific estimates made by industry, appropriate JORC terminology (noted above) will be used.
1.4
The Dynamic Nature of Reserves
same from year to year even though it contains different material. We can show this by plotting a curve (Fig. 1.5) representing the reserve estimate plus cumula-tive production. The “reserve plus production curve” shows that at least for the last few decades, by adding an amount similar to what we have produced, we have maintained reserves at near-constant levels, i.e. a relatively constant “reserve life”. Similar relations prevail for other commodities. Graedel et al. (2014) noted that world reserve life for Cu and Ni has been roughly constant, between 30 and 60 years of supply, from the 1980s to 2011, despite a doubling of production for these two metals – which is exactly the point that we raised in the Preface.
Figure 1.5 Production and reserves for Zn since 1988 (USGS, 2016). Note that by about 2007, the curve showing cumulative production had increased to the point that it exceeded the reserves value quoted by the USGS in 1988. The curve showing cumulative production plus reserves follows a trend similar to that of cumu-lative production, showing that reserves have remained recumu-latively constant even though they must have consisted of different material as time passed.
company has sufficient reserves for the next few decades (and to justify the cost of building a mine to extract the ore), there is no point in spending large sums to find more unless it is planning to increase its production of the commodity. The market gives little consideration to a reserve life sufficient to supply more than 20 to 40 years of present consumption.
Exactly when reserves are exhausted for any specific commodity will depend on the ultimate size of the resource. One such estimate is the “identified resource” (Fig. 1.4) recently estimated by the USGS (Fig. 1.4). The identified resource includes marginally economic and sub-economic resources for which estimates of grade, tonnage and amenability to mining and processing are poorly known. Since 1973, the USGS has published an estimate of “world resources” that includes identified and undiscovered resources (Fig. 1.6). Both estimates are much larger than reserves, indicating that considerable material remains for future production if it can be discovered and shown to be mineable.
Figure 1.6 Comparison of Cu reserves and identified and undiscovered resource estimates of the USGS. The increase in the resource figure reflects the availability of more information through time, including the step-change with publication of the study of Johnson et al. (2014) (see Table 1.1).
Table 1.1
Recent resource estimates for copper (millions of tonnes, Mt, of metal). Consid-eration of what constitutes a resource, and the methods used, differ. Most estimates are for deposits at depths of 1 km or less, except for the Kesler and Wilkinson estimate, which is for deposits to a depth of 3.3 km.
Amount Source Comment
89,000 Kesler and Wilkinson (2008) based on tectonic diffusion model 6,380 Singer (2017) extension of Johnson et al. (2014)
5,600 Johnson et al. (2014) 2,100 Mt identified and 3,500 Mt undiscovered 2,636 Copper Development Assoc.
(2013)
2,459 Schodde (2010) compilation of public and other data 2,100 USGS (2016) identified resources from compilations 1,781 Mudd et al. (2013) compilation of public data
1,771 Northey et al. (2014) compilation of public data
1,623 Gerst (2008) reevaluation of Cox (1979), Lasky (1950b) 1,400 Laherrère (2010) peak copper estimate
But first, we need to pare down the coverage a bit. The spectrum of mineral resources is so large that we cannot discuss all mineral commodities. Instead, and because we are discussing the issue from a geochemical perspective, we will focus on one widely used and versatile element, Cu, with occasional reference to other elements and commodities.
1.5
Why Do We Focus on Cu?
There are good geochemical and economic reasons for using Cu as the theme for this volume and a proxy for the broader mining industry. On the economic side, it is one of the most important industrial metals (along with Fe and Al) and was among the earliest to be used in a processed form (Renfrew, 1990; Smith, 2015), as discussed further in Section 4. Since its initial use, Cu has found a multitude of markets that depend in part on its excellent thermal and electrical conductivity and anti-bacterial properties (second only to silver). Current markets include electrical and electronic equipment (31 %), construction (30 %), infrastructure (12 %), transport (12 %), and industrial machinery (12 %) (World Copper Factbook, 2015). Because of its impressively wide array of markets and their close ties to the overall health of the world economy, the metal has been referred to as Doctor Copper (Radetzki, 2009).
largely in sulphide form in most rocks. For this reason, Cu can be separated from rocks and ores, even when its concentration is relatively low. It behaves incompatibly during most stages of magmatic crystallisation and enters either a magmatic hydrothermal solution or a sulphide melt depending on the oxida-tion state of the magma. It forms soluble complexes in hydrothermal soluoxida-tions, mainly with chloride and hydroxide, making it mobile in the upper crust, and it can be deposited from solution by processes ranging from redox changes to cooling (Wood and Samson, 1998; Liu et al, 2001; Hack and Mavrogenes, 2006; Simon et al., 2006; Evans et al., 2008; Kouzmanov and Pokrovski, 2012). It can also be mobilised during weathering and re-precipitated at higher concentrations (Sections 2 and 4). As a result, we find Cu deposits in a wide range of geologic settings, including felsic and mafic igneous rocks, sedimentary rocks, and at seafloor hot springs (black smokers). The list of deposit types and the range of their characteristics continue to grow (Section 2), with some debate about the origin of several types of deposits.
World Cu mine production of about 18.7 Mt in 2014 came from about 450 mines in 53 countries (World Copper Factbook, 2015). Despite the widespread distribution of deposits, Chile accounts for almost a third of total world produc-tion (5.8 Mt), followed by China, the USA, Peru, Australia, Russia, the Democratic Republic of Congo (DRC) and Zambia. About 60 % of world production comes from porphyry Cu deposits and another 20 % comes from sediment-hosted Cu deposits. Copper production from the rest of the world comes mainly from other types of deposits, and is complemented by recycled material (called secondary refined Cu), which was 3.9 Mt in 2014, making a refined total of 22.5 Mt Cu.
Annual production of mined Cu, currently valued at about $100 billion, has been growing for decades, with occasional dips because of global recessions. The price of Cu has lagged behind the consumer price index over most of the past century due to technological improvements in mining and processing (Fig. 1.7). Starting shortly after 2000, the price rose rapidly in response to heavy demand, largely from China, although it has since returned to a level more consistent with the consumer price index (Fig. 1.7). The behaviour of Cu prices is typical for most metals, which have generally grown less rapidly than inflation during the past 100 years. Since early in the 21st century, China has been both the main producer of refined Cu (smelted from domestic production as well as imported Cu concentrates from around the world), and the major consumer of Cu (Fig. 1.2), reflecting its major construction and infrastructure enhancement programme.
Figure 1.7 Change in price of Cu since 1960 compared to the U.S. consumer price index and global production (data from World Copper Factbook, 2015; U.S. Federal Reserve Bank).
Our response is that all of these estimates are based only on identified resources, with only one exception. Only the estimate by Johnson et al. (2014) includes a category of unidentified (undiscovered) resources, but these are mainly located in areas of known deposits, and at shallow depths. We have every reason to believe that many undiscovered deposits remain to be found in addition to the USGS predictions. Large areas of the crust have not been explored and we have only explored to very shallow depths, usually much less than 1 km (Section 3). Most known Cu deposits are at depths of 1 km or less (Fig. 1.8), whereas we know they actually form at depths of 2 to 3 km (Sillitoe, 2010a). Kesler and Wilkinson (2008) used this relation to estimate that undiscovered Cu deposits within 3.3 km of the surface contain a theoretical resource of at least 8.9 × 10⁴ Mt of Cu, more
than 10 times the total estimated by the USGS (Fig. 1.9).
Figure 1.8 Depth of Cu, Ni (except laterite deposits) and Pb-Zn deposits discovered since 1900 (modified from Schodde, 2014a and written communication, August 2016).
1.6
Conclusion
2.
FORMATION OF MINERAL DEPOSITS
2.1
What is an Ore Deposit?
The term “ore deposit” has a specific meaning in the geological literature (Section 1), being a mass of rock that contains a useful element, compound or mineral with a grade (concentration) and total amount sufficiently high that the material can be mined economically. Copper, Au and Fe are the most impor-tant metals in terms of value of global production (Fig. 2.1a). As explained in Section 1, ore deposits are an important subset of the broader term “mineral deposits”, which include natural concentrations of elements or minerals. Metals and minerals become concentrated by many processes into a wide variety of ore deposits that form in four main geologic environments, orthomagmatic, hydro-thermal, sedimentary and weathering (Fig. 2.1b).
2.2
Ore Grades and Ore Minerals
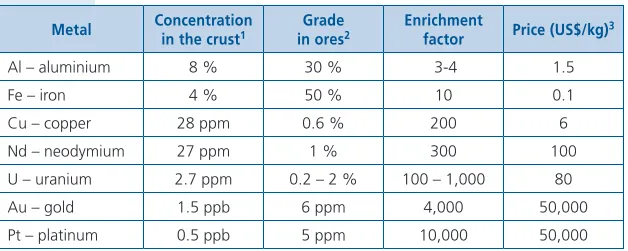
The grade of ores varies by many orders of magnitude, from essentially 100 % for commodities like quartz for glass, solar panels and semiconductors and gravel for construction, to a part per million (ppm or gram per tonne, g/t) for valuable metals like Au and Pt. In Table 2.1 we compare typical present-day ore grades for some metals along with their average concentrations in rocks that make up the upper for some metals along with their average continental crust.
Table 2.1 Concentrations of ore metals in the continental crust and ores.
Metal Concentration in the crust1 in oresGrade 2 Enrichment factor Price (US$/kg)3
Al – aluminium 8 % 30 % 3-4 1.5
Fe – iron 4 % 50 % 10 0.1
Cu – copper 28 ppm 0.6 % 200 6
Nd – neodymium 27 ppm 1 % 300 100
U – uranium 2.7 ppm 0.2 – 2 % 100 – 1,000 80
Au – gold 1.5 ppb 6 ppm 4,000 50,000
Pt – platinum 0.5 ppb 5 ppm 10,000 50,000
1 Upper continental crust from Rudnick and Gao (2004); Al and Fe recalculated from oxide values. 2 From InfoMine.com.
Figure 2.1 (a) Relative value of metal production for processed material (data from Ericsson, 2008, and USGS, 2016). (b) Relative value by deposit type, based on data in diagram (a) combined with our estimate of the relative contribution of the four deposit types to the production of each metal.
with the relative abundance of these deposits, is reflected in their low metal prices, only $1.5 per kg for Al and less than $0.1 per kg for Fe. Iron alone accounts for over a quarter of the value of all metals mined and refined in the world, followed by Al (Fig. 2.1a).
The next three metals in Table 2.1 are referred to as trace elements in the geochemical literature. Copper is a base metal; i.e. a metal present in moderate concentrations in the crust and used widely by industry (Section 4). The 2014 production of 22.5 Mt (18.7 Mt mined and 3.9 Mt secondary Cu; World Copper Factbook, 2016) accounts for about 16 % of the value of mined metals. Its concen-tration in the upper continental crust is estimated to be 28 ppm (Rudnick and Gao, 2004) but ores must have concentrations of at least 0.3-0.5 % (3,000-5,000 ppm) before they can be mined economically. Neodymium is one of the rare earth elements (REE) that acquired celebrity status, initially because of its use in magnets inside everything from smart phones to wind turbines, and reinforced by Chinese export regulations that restricted REE availability. The concentration of Nd in the upper continental crust is about 27 ppm, and ore grades are similar to those of Cu. Despite their critical importance for high-technology products, rela-tively small amounts of Nd and other REEs are used by industry (~123 kilotonnes [kt] of rare earth oxides were produced in 2015; Dutta, 2016). Uranium is classed as an energy-related element because of its use in nuclear reactors. Its concen-tration in the crust is lower (2.7 ppm) than the other two trace elements, and ore grades range from about 0.2 to more than 5 % in some exceptional deposits; 56 kt were produced in 2014 (www.world-nuclear.org). For all three elements, metal prices are about $US5 to $US100 per kg, reflecting lower ore grades and the difficulty and cost of separating the element from the ore.
The last two elements in the list are precious metals. Gold is not a major focus of geochemical studies but figures prominently in the ore deposit sphere because of its use in jewellery (about half of the ~4,000 t/y supply, one third of which comes from recycling), high technology (~8 %) and finance. Gold contrib-utes 15-20 % to the mined value of metals, even though nearly half of global non-ferrous exploration expenditures are devoted to exploring for this element (Section 3). Platinum is an important tracer of petrological processes (it fraction-ates from other platinum-group elements (PGE) during mantle melting, particu-larly if sulphides are present), and it has important industrial applications as a catalyst in the automobile and chemical industries. It contributes 2 % of global mined metal value and has a large strategic importance; 190 t were produced in 2015 (USGS, 2016). Both precious elements are present at ~1 part per billion (ppb) in the continental crust and at the ppm level in ores. Their scarcity is reflected in their prices, which recently have oscillated around $US40,000 to $US50,000 per kg ($US1,200-1,500/oz).
form an ore deposit, its concentration must be many times, up to several orders of magnitude, higher than those in typical crustal rocks. The average grade of ores has generally decreased with time, as illustrated by Cu in inflation-adjusted terms (Section 5), largely because of improvements in mining technology and the economies of scale of large mines.
To produce the high degrees of concentration needed to form an ore deposit requires a confluence of geologic processes that are referred to as ore-forming processes. In most cases, this involves the formation of one or more ore minerals in which the ore element has a high concentration (compositions in Table 2.2). For base metals such as Cu, Zn and Pb, by far the most common ore minerals are sulphides; some oxides and carbonates can also be ore minerals. Hydrous silicates are the main ore minerals in Ni laterites, whereas most Au ores contain native metal or electrum (Au, Ag). In all cases, the nature of the ore mineral has an impact on the ease with which the desired element can be extracted and used (Sections 4 and 5).
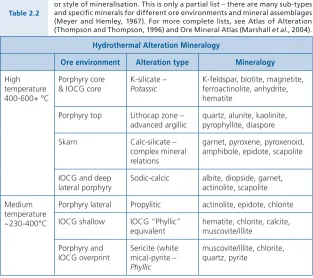
Table 2.2
Selected alteration and ore minerals listed by ore environment and alteration or style of mineralisation. This is only a partial list – there are many sub-types and specific minerals for different ore environments and mineral assemblages (Meyer and Hemley, 1967). For more complete lists, see Atlas of Alteration (Thompson and Thompson, 1996) and Ore Mineral Atlas (Marshall et al., 2004).
Hydrothermal Alteration Mineralogy
Ore environment Alteration type Mineralogy
High temperature 400-600+ °C
Porphyry core
& IOCG core K-silicate – Potassic K-feldspar, biotite, magnetite, ferroactinolite, anhydrite, hematite
Porphyry top Lithocap zone –
advanced argillic quartz, alunite, kaolinite, pyrophyllite, diaspore
Skarn Calc-silicate – complex mineral relations
garnet, pyroxene, pyroxenoid, amphibole, epidote, scapolite
IOCG and deep
lateral porphyry Sodic-calcic albite, diopside, garnet, actinolite, scapolite
Medium temperature ~230-400°C
Porphyry lateral Propylitic actinolite, epidote, chlorite
IOCG shallow IOCG “Phyllic”
equivalent hematite, chlorite, calcite, muscovite/illite
Porphyry and
IOCG overprint Sericite (white mica)-pyrite –
Phyllic
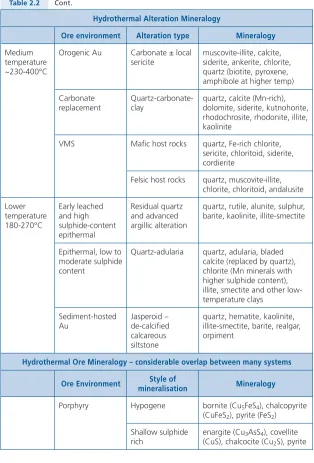
Table 2.2 Cont.
Hydrothermal Alteration Mineralogy
Ore environment Alteration type Mineralogy
Medium temperature ~230-400°C
Orogenic Au Carbonate ± local
sericite muscovite-illite, calcite, siderite, ankerite, chlorite, quartz (biotite, pyroxene, amphibole at higher temp)
Carbonate
replacement Quartz-carbonate-clay quartz, calcite (Mn-rich), dolomite, siderite, kutnohorite, rhodochrosite, rhodonite, illite, kaolinite
VMS Mafic host rocks quartz, Fe-rich chlorite, sericite, chloritoid, siderite, cordierite
Felsic host rocks quartz, muscovite-illite, chlorite, chloritoid, andalusite
Lower temperature 180-270°C
Early leached and high sulphide-content epithermal
Residual quartz and advanced argillic alteration
quartz, rutile, alunite, sulphur, barite, kaolinite, illite-smectite
Epithermal, low to moderate sulphide content
Quartz-adularia quartz, adularia, bladed calcite (replaced by quartz), chlorite (Mn minerals with higher sulphide content), illite, smectite and other low-temperature clays
Sediment-hosted
Au Jasperoid – de-calcified calcareous siltstone
quartz, hematite, kaolinite, illite-smectite, barite, realgar, orpiment
Hydrothermal Ore Mineralogy – considerable overlap between many systems
Ore Environment mineralisationStyle of Mineralogy
Porphyry Hypogene bornite (Cu5FeS4), chalcopyrite
(CuFeS2), pyrite (FeS2)
Shallow sulphide
Hydrothermal Ore Mineralogy – considerable overlap between many systems
Ore Environment mineralisationStyle of Mineralogy
Supergene
(20-40°C) chalcocite, covellite
Oxide enrichment
(20-40°C) malachite (Cuatacamite (Cu22(OH)Cl(OH)2CO3), 3),
cuprite (Cu2O), brochantite
(Cu4(SO4)(OH)6), chrysocolla
(Cu2H2Si2O5(OH)4), turquoise
(CuAl6(PO4)4(OH)8 • 4H2O)
Skarn/carbonate replacement
Multiple types with different metals – Cu and Zn deposits listed
chalcopyrite, bornite, sphalerite ((Zn,Fe)S), galena (PbS), tetrahedrite (Cu12Sb4
S13), pyrite, pyrrhotite (FeS),
magnetite (Fe3O4), hematite
(Fe2O3)
Orogenic Au Veins and
replacement native gold (Au), electrum (Au,Ag), pyrite, pyrrhotite, arsenopyrite (FeAsS), stibnite (Sb2S3), sphalerite
VMS Massive sulphide and footwall stringers
pyrite, pyrrhotite, chalcopyrite, sphalerite, galena, tetrahedrite
Magmatic Sulphide Ore Mineralogy
Komatiite-hosted and mafic intrusions
Massive and disseminated sulphide
pyrrhotite, pentlandite ((Fe,Ni)9S8), chalcopyrite,
pyrite, Pt group minerals, chromite ((Fe,Mg)Cr2O4),
magnetite
Low-temperature and Weathering-related Ore Mineralogy
20-40°C Uranium deposits Unconformities uraninite (pitchblende)(UO2)
Bauxite Blankets above groundwater table
gibbsite (Al(OH)3), boehmite
(AlO(OH))
Ni laterites Blankets above
3
C
la
ss
ifi
ca
ti
o
n o
f
O
re
D
ep
o
si
ts
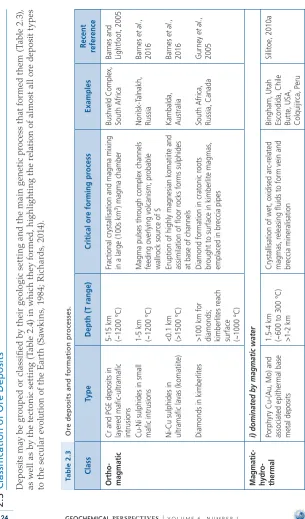
D ep os its m ay be gr ou pe d or cl as si fie d by th ei r ge ol og ic se tt in g an d th e m ai n ge ne ti c pr oc es s th at fo rm ed th em (T ab le 2. 3) , as w el l a s b y t he te ct on ic s et ti ng ( Ta bl e 2 .4 ) i n w h ic h t he y f or m ed , h ig h lig ht in g t he r el at io n o f a lm os t a ll or e de po si t t yp es to th e se cu la r ev ol ut io n of th e Ea rt h (S aw ki ns , 1 98 4; R ic ha rd s, 2 01 4) . Ta b le 2 .3 O re d ep o si ts a n d f o rm at io n p ro ce ss es . Cla ss Ty pe D ep th ( T r an ge ) Cr it ic al o re f or m in g p ro ce ss Exa m pl es Re ce nt re fer enc e Ortho- magmatic Cr andPGE deposits in
layer
ed
mafic-ultramafic
intrusions
5-15 km (~1200 °C) Fractional crystallisation and magma mixing in a large (100s km 3) magma chamber
Bushveld Complex, South Africa Bar nes and Lightfoot, 2005
Cu-Ni sulphides in small
mafic intrusions
1-5 km (~1200 °C)
Magma pulses thr
ough complex channels
feeding overlying volcanism; pr
obable
wallr
ock sour
ce of S
Norilsk-T alnakh, Russia Bar nes et al. , 2016
Ni-Cu sulphides in ultramafic lavas (
komatiite)
<0.1 km (>1500 °C) Eruption of highly magnesian komatiite and assimilation of floor r
ocks forms sulphides
at base of channels
Kambalda, Australia
Bar nes et al. , 2016 Diamonds in kimberlites
>100 km for diamonds; kimberlites r
each
surface (~1000 °C)
Diamond formation in cratonic r
oots
br
ought to surface in kimberlite magmas,
emplaced in br
eccia pipes
South Africa, Russia,
Canada Gur ney et al. , 2005 Magmatic- hydr o-thermal
i) dominated by magmatic water Porphyry Cu-(
Au, Mo) and associated epithermal base metal deposits
1.5-4 km (~600 to 300 °C) >1-2 km
Crystallisation of wet, oxidised ar
c-r
elated
magmas, r
eleasing
fluids to form vein and
br
eccia mineralisation
Bingham, Utah Escondida,
Climax-type Mo-(
W-Sn)
>3 km (~600 to 300 °C)
As above; magma composition mor
e felsic
and mor
e r
educed
Henderson, Colorado
Seedorf f et al. , 2005 Skar n Fe, Cu,
Zn, Au, Mo,
W
2-10 km (500-300 °C)
Magma-wallr
ock r
eactions r
eplace contact
zone with calc-silicate minerals and mineralisation Ertsberg, Indonesia
Meinert et al. , 2005 Iron oxide Cu-Au±U-REE (IOCG)
~1-10 km (~500 to 200 °C) Extensive deep oxidised saline magmatic fluids mix with basin/surface fluids; r
egional
alteration, focused deposits
Olympic Dam, Australia
Gr oves et al. , 2010; W illiams et al. , 2005
ii) dominated by
meteoric or sea water with magmatic component
Epithermal
Au-Ag-(Se-T
e)
Ag-Pb-Zn-(Au)
Au-Cu-As
0-1000 (1500) m (180-300 °C)
Shallow mineralisation fr
om ascending
magmatic and meteoric fluids; near surface T and chemical gradients
Hishikari, Japan Fr esnillo, Mexico Yanacocha, Peru
Sillitoe and Hedenquist, 2003
Carlin-type Au
2-3 km (180-240 °C)
Meteoric dominant fluid + deep magmatic/
metamorphic fluids; r
eplacement
of calcar
eous siltstones
Post-Betze, Nevada Muntean et al.
, 2011
Volcanogenic massive sulphide (
VMS)
0-300 m below seafloor (200-350 °C)
Seawater cir
culation below seafloor (+/-
magmatic fluid), discharge at seafloor; metals pr
ecipitated by cooling + mixing
Brunswick #12, Kidd Cr
eek, Canada Galley et al. , 2007
Amagmatic hydr
o-thermal
i) deposits dominated by
meteoric water
Unconformity
U
1-2 km (150-250 °C)
Oxidised basin
fluids r
eact with r
educed
basement and gases r
elated to deep
structur
es
Athabasca Basin, Canada Cuney and Kyser
, 2009
Roll fr
ont and sandstone U
deposits
100-500 m (75-150 °C)
Oxidised meteoric/basin fluids flow thr
ough
reduced sandstone aquifers
Wyoming,
USA
Cuney and Kyser
Ta b le 2 .3 C o nt . Cla ss Ty pe D ep th ( T r an ge ) Cr it ic al o re f or m in g p ro ce ss Exa m pl es Re ce nt re fer enc e
Amagmatic hydr
o-thermal
ii) deposits formed largely from
basinal brines Clastic-hosted (or SEDEX) Pb- Zn-Ag-Ba
0-500 m (~100-200+ °C)
Sedimentary brines r
eplace shale-siltstone
units at or below seafloor
, sulphides deposit
on cooling, local exhalation
Red Dog, Alaska Leach et al. , 2010 Mississippi V alley-type (MVT) Pb-Zn-F-Ba
100s m to 3+ km (~100-150+ °C) Oxidised metal-rich basin brines mix with reduced fluids, metal sulphides pr
ecipitated
in open spaces and as r
eplacement
Tri-state district, USA
Leach
et al.
,
2010
Sediment-hosted stratiform Cu-Co-(Ag) 100s m to 5 km (125-200 °C)
Basin brines fr
om deep oxidised units
ascend and r
eact with r
educed unit; capped
by impermeable evaporites
Tenke-Fungurame, DRC
Hitzman
et al.
,
2010
iii) deposits formed largely from
metamorphic water
Or
ogenic
Au
1-15 km (250-400 °C) Deep fluid of metamorphic origin (+/- mantle and
magmatic components) focused
thr
ough major crustal structur
es; Au
pr
ecipitates during wallr
ock r
eaction
Kalgoorlie, Australia, Timmins, Canada, Ashanti, Ghana
Goldfarb
et
al.
Sedimentary (chemical or detrital)
Banded ir
on formations (BIF)
Seafloor (2-20 °C)
Dir ect Fe oxide pr ecipitation fr om r educed Palaeopr oter ozoic/Ar chean seawater ,
possibly bacterially assisted
Hamersley
,
Australia; Carajàs, Brazil
Bekker
et al.
,
2010
Li-rich brines
0-200 m (10-30 °C) Active evaporitic basin (“salar”) with Li-rich volcanic input; concentration by evaporation
Chile, Bolivia, Argentina Munk et al. , 2016
Phosphorites P (U,
REE)
Seafloor (2-20 °C) Platforms, marginal seas, with P upwelling in ocean curr
ents
North Africa, Middle East Pufahl and Groat, 2017
Placers: Au,
PGE, diamonds,
Ti-Zr
Surface (0-25 °C)
Active str
eams and rivers with fluvial
concentration of heavy metals and grains; similar concentration pr
ocess in beach and
shallow marine sands
Califor nia, Alaska, Colombia, Russia, Namibia Gar nett and Bassett, 2005
Palaeoplacers: Au-U
Ancient surface
Placer concentration of Au and U in a reducing atmospher
e and multiple
reworking W itwatersrand, South Africa Frimmel et al. , 2005 W eathering
(above the ground- water table)
Al
laterite (bauxite) and Ni
laterite
Surface (15-30 °C)
Tr
opical
weathering with warm rainfall
exceeding evaporation; downwar
d
leaching
of r
ocks (Ni-rich for Ni laterites) and r
esidual
concentration of Al or Ni
Al: W eipa, Australia Ni: Philippines, New Caledonia Fr eyssinet et al. , 2005;
Retallack, 2010
“Supergene” Cu enrichment 10-200 m (10-40 °C)
Rainwater oxidises
pyrite, generates acid
and leaches Cu; pr
ecipitated at watertable
Andes, SW USA
Ta b le 2 .4 Te ct o n ic s et ti n g o f o re d ep o si ts . Te ct on ic se tt in g De po si t t yp e D ep os it su b-t yp e M aj or m et al as so ci at ion G eol og ic se tt in g; m ai n a ss oc ia te d r oc ks M ost -e ndo w ed p er io d( s)
Convergent margin
Porphyry systems Porphyry Cu±Au±Mo Continental and island ar c; intermediate
calc-alkaline to alkaline
Mid Mesozoic to Pliocene
Epithermal Au- Ag-As-Hg- (Pb-Zn)
Continental and island ar
c; intermediate
calc-alkaline some back ar
c (
sulphide-poor), bimodal felsic-mafic
Mid Mesozoic (Cenozoic for epithermal) to Recent
Skar
n
Fe, Cu, Au, Zn, W-Sn,
Mo
Continental and island ar
cs;
carbonate
rocks
Mid Mesozoic to Recent
Carbonate replacement
Zn-Pb-Ag
Continental and island ar
c;
carbonate
sequences
Mid Mesozoic to Recent
Silty
carbonate
hosted (
Carlin)
Au-As
Continental and island ar
c Tertiary Iron-oxide Cu-Au (IOCG) Many variations
Fe±Cu-Au± U±REE
Transpr
esional to extensonal settings
(complex craton
margins
in older
deposits;
variety of host r
ocks
Late Ar
chean, Early to
Middle Pr oter ozoic, Mesozoic Or ogenic Au Au-As Au-As For e-ar c, back-ar c, accr etionary wedge; gr eenschist facies Late Ar chean, Early Pr oter ozoic, Palaeozoic-Tertiary Spr eading centr e
and convergent- margin extension Volcanic-hosted massive sulphide (VMS) Cyprus Kur
oko
Cu-Pb-Zn ± Ag, Au
Mid-ocean ridge (
Cyprus); bimodal mafic,
mafic Back-ar
c (
Kur
oko); bimodal felsic,
siliciclastic Ar chean, Phaner ozoic For eland basin Mississippi V alley-type (MVT) Pb-Zn±Ba±F Post-collision for eland basin;
platform carbonate host
Rifts, sag basins, passive margins Sediment-hosted stratiform Cu
Cu±Co±Ag
Inter
craton rift basin; r
ed beds,
carbonaceous units, evaporites
Late Pr
oter
ozoic, Permian
Uranium
Unconformity
U±Au±Co± Mo±Se±Ni
Sedimentary basin; r
edox fr ont, contacts Middle Pr oter ozoic Sandstone U±V±Mo
Closed basin; r
edox fr
ont, contacts
Mesozoic, T
ertiary
Clastic-dominated Zn-Pb (or
SEDEX)
Pb-Zn±Cu± Ag±As±Bi
Passive margin, back-ar
c and continental
rift, sag basin; shale and carbonate r
ocks Middle Pr oter ozoic, Paleozoic Banded Ir on Formation (BIF) Fe-(P)
Passive margin, deep basin; carbonate and silica facies
Ar
chean, Early Pr
oter ozoic Mn-rich sediments Mn-(Fe) Open shelf Early Pr oter ozoic, Paleozoic
Passive margin platform
Phosphorites P-( U, REE, Se, Mo, Zn, Cr)
Platform; epeiric sea
latest Pr oter ozoic-Miocene Large igneous pr ovince (oceanic or continental) Ni sulphide Komatiite Ni±Cu±PGE Gr eenstone belt; ultramafic Ar chean, Pr oter ozoic Mafic intrusion
Ni-Cu-PGE± Co±Au
Plumes; sedimentary basin
Pr
oter
ozoic, Phaner
ozoic
Craton or craton margin
Layer ed intrusion PGE-Ni±Cu; Cr Plume, craton Late Ar chean, Pr oter ozoic Diamond diamond Cratons; kimberlites Late Pr oterzoic, Cenozoic Land surface Lateritic Al, Ni Al Granite-gabbr o, arkose
Tertiary to Recent
Ni-Co
Ultramafic
Mid Cr
etaceous to Miocene
Placer (palaeoplacer)
Box 2.1 – An Ore Deposit Pioneer – Waldemar Lind-gren pioneered the use of ore-forming processes to classify ore deposits. He was born in Sweden in 1860 and showed a strong interest in the natural sciences, collecting samples from Cu and Fe mines by the age of 13. In 1877, he visited the famous Mining Academy at Freiberg, and took a trip through the mines of Saxony. The following year he returned to study geology, mineralogy, metallurgy and mining engineering at Freiberg. In 1883 he crossed the Atlantic to follow his dream to join mining and geological activities in the western USA. He studied numerous ore districts in the Americas and around the world, mostly for the USGS, gaining three decades of field experience and writing numerous seminal publications. His lectures at Stanford University and the Massachusetts Insti-tute of Technology formed the basis of his famous and still referenced book, Mineral Deposits, which evolved over four editions from 1913 to 1933. Inset: Lindgren
at Santa Rita porphyry Cu deposit, New Mexico, 1933 (courtesy of Göran Fredrikson).
Genetic classification. Classifying ore deposits by inferred genetic processes was common in Europe during the late 1800s and early 1900s (summary by Noble, 1955). As a wider range of ore deposit types became known, classifica-tions became more comprehensive. The most influential of these was proposed by Lindgren (1933), largely based on his perceptive observations, both in the field and in the laboratory. He focused largely on hydrothermal deposits that formed from circulation of hot aqueous fluids, and grouped them in terms of temperature of formation and fluid composition. He also recognised deposit types formed by magmatic processes, sedimentation, evaporation and weathering. Most modern textbooks on economic geology follow similar general classifications (e.g., Robb, 2004; Pohl, 2011; Ridley, 2013; Jébrak and Marcoux, 2015). The most common ore-forming process involves hydrothermal fluids, either exsolved by magmas or circulating through the crust. Orthomagmatic processes, physical and chemical sedimentation, and weathering also form significant deposits (Fig. 2.1b; Tables 2.3 and 2.4).
Tectonic environments. By the 1970s, a growing understanding of the critical role that tectonics played in the formation, preservation and metallogenic evolution of ore deposits led to the use of plate tectonics as a basis to classify ore deposits (Sawkins, 1984; Fig. 2.2).
Box 2.2 – F.J. (Sam) Sawkins – Sawkins (1984) was prescient in his early tectonic synthesis of ore deposits based on the evolving understanding of the tectonic setting of ore deposits by many workers during the previous decade. He noted that the primary conceptual tool in exploration planning (Section 3) is lithologic association, the basis of all good descriptive models of ore deposits. “The principal impact of plate tectonics on all this has been to broaden and deepen our understanding of the tectonic environments in which many of these lithologic associations develop (Dickinson, 1980), and to provide insights into their relative spatial associa-tions. Metallogenesis can now be understood within the fundamental context of continental evolution, and
this in turn permits the conception of exploration programmes aimed at specific types of ore deposits.” (p. 280). Inset: Sam Sawkins (courtesy of Ginny Sawkins).
We briefly describe the most significant types of ore deposits in terms of their genesis (Table 2.3) and tectonic affiliation (Table 2.4, Fig. 2.2). For each deposit type, we provide examples of the total contained metal to give an idea of the capacity of a single deposit to meet current global demand. These estimates illustrate the highly skewed nature of deposit sizes (Section 5), with most pres-ently exploited resources contained in relatively few very large deposits, called world class or Tier 1. For example, the 20 largest Cu mines, out of about 450 total, produce 8.8 Mt/y, or 44 % of global output (World Copper Factbook, 2015). A more comprehensive coverage of deposit types is provided in review volumes, such as Robb (2004), Hedenquist et al. (2005) and Jébrak and Marcoux (2015).
2.4
Orthomagmatic Ore Deposits
that crystallise chromite alone, combined with crystal sorting during flow into the magma chamber to concentrate the chromite in layers (Maier et al., 2013). The PGE- and V-rich magnetite deposits also form through accumulation of magmatic phases, with PGE partitioning mainly into sulphide phases; the exact mechanisms of formation of PGE ores is complex and subject to much discussion (e.g., Naldrett et al., 2011).
Figure 2.3 Orthomagmatic ore-forming environments. A mantle plume is diverted along the sloping base of the lithosphere and partially melts to give magmas that form ore deposits at various levels in the crust; e.g., Jinchuan (China), Voisey’s Bay (Canada), Norilsk (Russia), Kambalda (Australia) and Bushveld (South Africa) (modified from Barnes et al., 2016).
Cont. Ovoid deposit, Voisey’s Bay, Canada (Box 3.1) (courtesy of S. Beresford and S. Barnes; PdX peridotite xenolith, HPgX hercynite paragneiss xenolith, Po pyrrhotite, Pn pentlandite, Cp chalcopyrite, Pl plagioclase; width 15 cm).
(c) Quartz-chalcopyrite-pyrite vein stockwork, Far Southeast porphyry Cu-Au deposit, Philippines (courtesy of A. Gaibor; width 10 cm). (d) Colloform layers of quartz, adularia and Au (yellow), Kochbulak epithermal deposit, Uzbekistan (courtesy of V. Kovalenker; width 5 cm). (e) Turtle Pits black smoker vent, 5° S, Mid-Atlantic Ridge (400 °C, 2,900 m water depth) (courtesy of ROV Team, GEOMAR; visible height 1 m of 5 m-tall chimney). Inset: massive sulphide lens next to vent and sphalerite replacement of overlying volcanoclastic horizon at Kidd Creek VMS deposit, Canada (courtesy of M. Hannington; width 6 cm).