Http://www.ijetmr.com©International Journal of Engineering Technologies and Management Research [20]
EXPERIMENTAL AND ANALYTICAL STUDY ON BEHAVIOUR OF
COLD FORMED STEEL USING ANGLE SECTION UNDER TENSION
MEMBERS
Paul Makesh A 1, Arivalagan S 2
1
Assistant Professor of Civil Engineering, Dr.M.G.R Educational and Research Institute University, Chennai, India
2
HOD of Civil Engineering, Dr.M.G.R Educational and Research Institute University, Chennai, India
Abstract:
The effective sectional area concept was adopted to conduct the analysis of cold-formed Tension members. ANSYS software was utilized to simulate the behavior of cold formed steel angle under tension load. The paper describes the results from a finite element investigation into the load capacity tension members of single angle sections of 2mm and double angles sections of 2mm under plain (without Lipped) and with Lipped conditions subjected to tension. Comparisons were made between the test results and the predictions based on both the Experimental investigation and the ANSYS analysis. Results also comparisons were made by the International codes BIS, AISI, AS/NZS and BS.
Keywords: ANSYS; Tension Members; Cold-Formed Steel; Strength; Displacement.
Cite This Article: Paul Makesh A, and Arivalagan S. (2018). “EXPERIMENTAL AND
ANALYTICAL STUDY ON BEHAVIOUR OF COLD FORMED STEEL USING ANGLE SECTION UNDER TENSION MEMBERS.” International Journal of Engineering Technologies and Management Research, 5(1), 20-28. DOI: https://doi.org/10.29121/ijetmr.v5.i1.2018.44.
1. Introduction
Http://www.ijetmr.com©International Journal of Engineering Technologies and Management Research [21]
formed steel angles, the finite element analysis program ANSYS is used to create the model of the tested specimens under these models, ultimate loads and total deformation of cold formed angles are compared with experimental results angles.
ANSYS Workbench capabilities include a unique and extensive materials and sections for concrete and steel structures.. A user- friendly beam and shell postprocessor included listing and plotting section geometry, reinforcements, beam stresses and strains inside the cross section. The skilled combination module, selects loads and coefficients for logic code combinations. Results embrace concomitance. The analysis is carried out in three stages such as.
1. Preprocessor 2. Solution 3. Post processor.
2. Literature Review
In order to understand flexural behavior of CFS members and why there is need of this study, a through literature review was undertaken. This literature review included review of the characteristics, design methods and numerical methods to analyze and accurate modeling of CFS sections followed by a summary which presents main findings and gaps in the literature. Alireza Bagheri et.al [1] (2012) are presented the Cyclic behavior of bolted cold – formed angles. In this paper a finite element (FE) procedure is described for simulating hysteretic moment – rotation behavior and failure deformations of bolted cold- formed steel ( CFS). K.F. Chung and K.H,Ip [2] (2012) are presented the Finite element investigation on the structural behavior of cold formed steel bolted connections. A finite element model with three-dimensional soild elements established to investigate the bearing failure of cold- formed steel bolted connections. Valdier Francisco et al. [3] presented details of 66 experiments carried out on cold formed steel fastened with bolts subjected to tension. They examined the reduction coefficient performance based upon the new tests and data available in the literature, comprising of 108 tests. Chi-Ling Pan[4] investigated the effect of shear lag on the angles cold formed steel sections, by testing 54 specimens with different cross sectional dimensions. The Indian code for use of cold formed steel IS: 801[5] does not any provision for the design of tension members. Hence during the code revision, experiments were conducted at CSIR-SERC on cold formed angle tension members for the inclusion of design provisions.Moen et.al[6] 2008 through analytical models showed that the variation of residual stress through the thickness is rather complex and nonlinear similar finding was made by Shafter and Pekoz earlier in experimental analysis.
3. Codal Provisions
The following codal provisions are used to predict member capacities of the cold- formed steel angle members. Different International codal provision in tension members are presented in
Table 1: Different International Codal provision in the tension members
Bureau of Indian Standards, BIS 800:2007 Australian and Newzealand standards, AS/NZS
4600: 2005 The permissible stress in axial tension,
Pn= Ae x 0.6fy; fy=minimum yield stress of steel in
MPa
Ae the net effective areas of the section shall not
The nominal section capacity of a member in tension shall be taken as the lesser of
Nt = Ag fy (1), Nt = An0.85 Kt An fu (2)
Http://www.ijetmr.com©International Journal of Engineering Technologies and Management Research [22]
exceed:
In the case of single angle connected through one leg the net effective sectional area shall be taken as:A1+A2k
Where, A1 = effective cross sectional area of the
connected;
A2 = effective cross sectional area of the connected;
Ae = 3A1/ (3A1+A2);In the case of double angles ;
Ae = 5A1/ (3A1+A2);
member, mm2
fy= yield stress of the material, N/mm 2
Kt= correction factor for distribution of forces =
0.85
An= net area of the cross-section, obtained by
deducting from the gross area of the cross section, the sectional area of all penetrations and holes, including fastener holes mm2
fu= tensile strength used in the design, N/mm2
American Iron and Steel Institute, AISI 2007 British Standard, BS:5950 (Part 5)-1998
The tensile capacity Pn, of a member should be determined from
Pn = An Ae fu
Where fu= tensile strength of the connected part
of a member, N/mm2
Ae= UAn and U = 1.0 - 0.36 X / L < 0.9 and U >
0.5
An= effective net sectional area of the member,
mm2
X = distance from shear plane to centroid of the cross section, mm
L= length of the end connection i.e. distance between the outermost bolts in the joint along the length direction, mm
The tensile capacity Pt, of a member Pt = Ae * py
Single angles
For single angles connected through one leg only, the effective area Ae is computed as
Ae = a1(3a1+4a2)/ (3a1+a2)
Double angles
For double angles connected to opposite side of gusset plate, the effective area is determined as Ae = a1(5a1+6a2)/ (5a1+a2)
For double angles connected to the same side of gusset plate the effective area can be determined as that of single angles. Ae = effective area of the
section
a1 = the net sectional area of the connected leg
a2 = the gross sectional area of the unconnected leg
py = the design strength.
4. Experimental Investigation
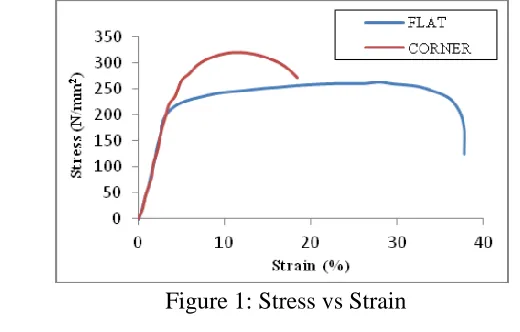
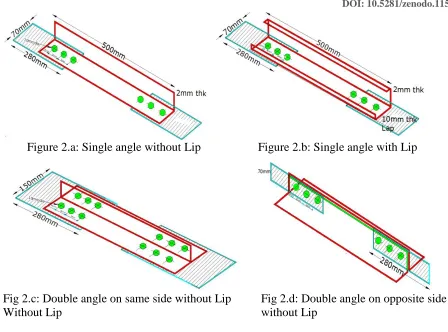
A total of 36 specimens have been tested by varying the angle sizes, number of bolts and the bold pitch distance. All the specimens have been designed to undergo net section rupture failure or block failure. The specimens are equal angles 50x50, 60x60 and 70x70mm, and unequal angles are 50x25,60x30 and 70x35mm they have equal length and thickness of 500mm and 2mm respectively. The angles are connected to the gusset plate under eccentric tensile loads on single and double angle specimen. The stress vs strain curve was plotted as shown in Figure 1.
Http://www.ijetmr.com©International Journal of Engineering Technologies and Management Research [23]
Figure 2.a: Single angle without Lip Figure 2.b: Single angle with Lip
Fig 2.c: Double angle on same side without Lip Fig 2.d: Double angle on opposite side Without Lip without Lip
5. Numerical Investigation
To validate the experimental results, a finite element analysis package ANSYS (16.2) was used for the modeling and analysis. A non-linear analysis was performed and the materials are assumed to behave as an isotropic hardening material. From the experimental tension test results, the static material modeling was done. The element type used to model the test specimens is SHELL 63. It is a 4-noded 3 dimensional quadratic shell element. This element has six degrees of freedom at each node. Finite element mesh of size 2x2mm was implied and used in all the simulations. The friction or contact between connected leg of the specimen and the gusset plate was ignored. Figure 3 shows the single angle without Lip, the load applied on the element
.
Http://www.ijetmr.com©International Journal of Engineering Technologies and Management Research [24]
6. Result and Discussion
6.1. Comparison of Experimental and Analytical Ultimate Load
Design values from International codes
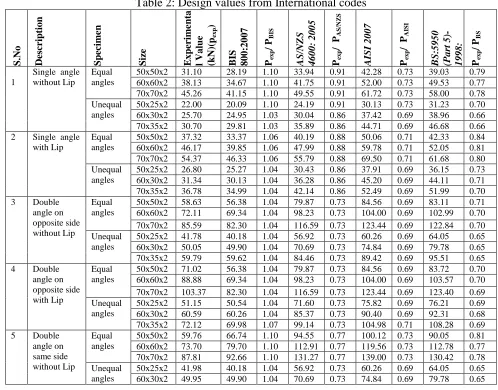
A comparative study between the experimentally observed ultimate loads of the specimen tested with the tensile load carrying capacity of equations of the following codes American Institute of steel corporation (AISC), AS/NZS:4600-2005, BS:5950 (Part 5 )-1998 is made to review the procedures recommended. The comparison of predicted ultimate loads by the three various codes for single and double angles tested are shown in Table 2 and Fig 4.a and 4.b. The tensile capacity equation of the international codes take it into account the effect of shear lag and incorporates the capacity reduction factor in addition to net effective area of the section. In case of values predicted by BIS,AISI, AS/NZS and BS are overestimated when compared to experimental ultimate load nearly 8% 10%, 11% and 12% of its standard Deviation values ie 2%, 3% 4% and 6% of lower than the ultimate loads irrespective of whether the angle is equal or unequal and provided with or without lip. All coal values give good relationship with experimental ultimate loads of with and without lip of single and double angles.
Table 2: Design values from International codes
S.No Descript io n Sp ec ime n
Size Ex
perime nta l V a lue (kN) (p exp ) B IS 8 0 0 :2 0 0 7 Pexp / P BIS A S/NZ S 4 6 0 0 : 2 0 0 5 Pexp / PAS/NZS A IS I 2 0 0 7 Pexp / PAISI B S:5 9 5 0 (P a rt 5 )-1 9 9 8 : Pexp / P BS 1
Single angle without Lip
Equal angles
50x50x2 31.10 28.19 1.10 33.94 0.91 42.28 0.73 39.03 0.79 60x60x2 38.13 34.67 1.10 41.75 0.91 52.00 0.73 49.53 0.77 70x70x2 45.26 41.15 1.10 49.55 0.91 61.72 0.73 58.00 0.78 Unequal
angles
50x25x2 22.00 20.09 1.10 24.19 0.91 30.13 0.73 31.23 0.70 60x30x2 25.70 24.95 1.03 30.04 0.86 37.42 0.69 38.96 0.66 70x35x2 30.70 29.81 1.03 35.89 0.86 44.71 0.69 46.68 0.66 2 Single angle
with Lip
Equal angles
50x50x2 37.32 33.37 1.06 40.19 0.88 50.06 0.71 42.33 0.84 60x60x2 46.17 39.85 1.06 47.99 0.88 59.78 0.71 52.05 0.81 70x70x2 54.37 46.33 1.06 55.79 0.88 69.50 0.71 61.68 0.80 Unequal
angles
50x25x2 26.80 25.27 1.04 30.43 0.86 37.91 0.69 36.15 0.73 60x30x2 31.34 30.13 1.04 36.28 0.86 45.20 0.69 44.11 0.71 70x35x2 36.78 34.99 1.04 42.14 0.86 52.49 0.69 51.99 0.70 3 Double
angle on opposite side without Lip
Equal angles
50x50x2 58.63 56.38 1.04 79.87 0.73 84.56 0.69 83.11 0.71 60x60x2 72.11 69.34 1.04 98.23 0.73 104.00 0.69 102.99 0.70 70x70x2 85.59 82.30 1.04 116.59 0.73 123.44 0.69 122.84 0.70 Unequal
angles
50x25x2 41.78 40.18 1.04 56.92 0.73 60.26 0.69 64.05 0.65 60x30x2 50.05 49.90 1.04 70.69 0.73 74.84 0.69 79.78 0.65 70x35x2 59.79 59.62 1.04 84.46 0.73 89.42 0.69 95.51 0.65 4 Double
angle on opposite side with Lip
Equal angles
50x50x2 71.02 56.38 1.04 79.87 0.73 84.56 0.69 83.72 0.70 60x60x2 88.88 69.34 1.04 98.23 0.73 104.00 0.69 103.57 0.70 70x70x2 103.37 82.30 1.04 116.59 0.73 123.44 0.69 123.40 0.69 Unequal
angles
50x25x2 51.15 50.54 1.04 71.60 0.73 75.82 0.69 76.21 0.69 60x30x2 60.59 60.26 1.04 85.37 0.73 90.40 0.69 92.31 0.68 70x35x2 72.12 69.98 1.07 99.14 0.73 104.98 0.71 108.28 0.69 5 Double
angle on same side without Lip
Equal angles
50x50x2 59.76 66.74 1.10 94.55 0.77 100.12 0.73 90.05 0.81 60x60x2 73.70 79.70 1.10 112.91 0.77 119.56 0.73 112.78 0.77 70x70x2 87.81 92.66 1.10 131.27 0.77 139.00 0.73 130.42 0.78 Unequal
angles
Http://www.ijetmr.com©International Journal of Engineering Technologies and Management Research [25]
70x35x2 59.85 59.62 1.04 84.46 0.73 89.42 0.69 95.51 0.65 6 Double
angle on same side with Lip
Equal angles
50x50x2 72.37 66.74 1.10 94.55 0.77 100.12 0.73 92.02 0.79 60x60x2 89.34 79.70 1.10 112.91 0.77 119.56 0.73 112.78 0.77 70x70x2 106.35 92.66 1.10 131.27 0.77 139.00 0.73 132.91 0.76 Unequal
angles
50x25x2 50.66 50.54 1.07 71.60 0.75 75.82 0.71 76.21 0.71 60x30x2 60.77 63.50 1.07 89.96 0.75 95.26 0.71 96.02 0.71 70x35x2 71.68 69.98 1.07 99.14 0.75 104.98 0.71 108.28 0.69
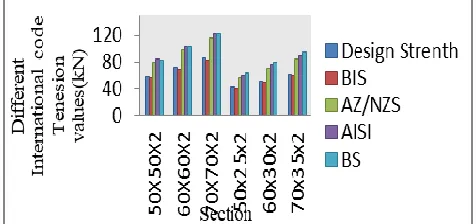
6.2. Comparison of Experimental Results with Various International Codes
Fig 4.a: Comparison of Design loads with loads based on codal provision for Double angle on opposite side without Lip
Fig 4.b: Comparison of Design load with loads based on codal provision for single plain angles
7. Comparison of Experimental and Numerical Investigation
The stress distributions obtained using ANSYS closely agrees with the experimental results within the elastic limit.
7.1. Comparison of Numerical valve in Ansys
Http://www.ijetmr.com©International Journal of Engineering Technologies and Management Research [26]
7.2.Comparison of Experimental Results with Various International Codes
Figure 6.a: Comparison of Design load with loads based on codal Double angle on opposite side without Lip
Figure 6.b: Comparison of Design load with loads based on provision for single plain angles with Lip
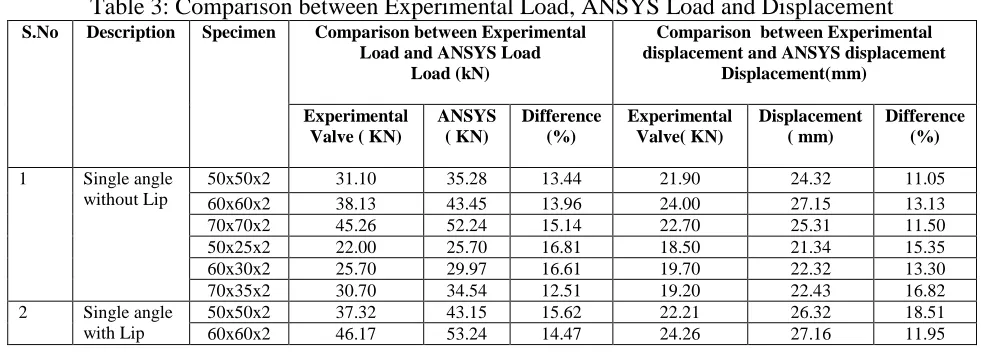
7.3.Comparison Between Experimental Load, ANSYS Load And Displacement
Comparison of experimental loads & displacement with ANSYS loads and displacements are shown in Table 3. From the table, it is observed that ANSYS loads increased experimental loads by an average of 15%. Similarly the displacement obtained from ANSYS increased by 17%.
Table 3: Comparison between Experimental Load, ANSYS Load and Displacement
S.No Description Specimen Comparison between Experimental Load and ANSYS Load
Load (kN)
Comparison between Experimental displacement and ANSYS displacement
Displacement(mm)
Experimental Valve ( KN)
ANSYS ( KN) Difference (%) Experimental Valve( KN) Displacement ( mm) Difference (%)
1 Single angle without Lip
50x50x2 31.10 35.28 13.44 21.90 24.32 11.05
60x60x2 38.13 43.45 13.96 24.00 27.15 13.13
70x70x2 45.26 52.24 15.14 22.70 25.31 11.50
50x25x2 22.00 25.70 16.81 18.50 21.34 15.35
60x30x2 25.70 29.97 16.61 19.70 22.32 13.30
70x35x2 30.70 34.54 12.51 19.20 22.43 16.82
2 Single angle with Lip
50x50x2 37.32 43.15 15.62 22.21 26.32 18.51
60x60x2 46.17 53.24 14.47 24.26 27.16 11.95
0 10 20 30 40 50 60 50 X50X 2 60 X60X 2 70 X70X 2 50 x25x2 60 x30x2 70 x35x2 L o ad KN Section Experimental value KN
Http://www.ijetmr.com©International Journal of Engineering Technologies and Management Research [27]
70x70x2 54.37 62.24 16.11 23.22 26.24 13.01
50x25x2 26.80 31.12 12.73 19.21 22.26 15.88
60x30x2 31.34 35.33 15.66 19.01 23.21 22.09
70x35x2 36.78 42.54 15.66 19.20 22.43 16.82
3 Double angle on opposite side without Lip
50x50x2 58.63 65.24 11.27 24.56 28.31 15.27
60x60x2 72.11 82.15 13,91 23.34 27.51 17.87
70x70x2 85.59 96.45 12.69 23.76 26.42 11.20
50x25x2 41.78 48.24 15.46 20.08 24.42 21.61
60x30x2 50.05 58.01 15.90 20.98 23.93 14.06
70x35x2 59.79 68.47 14.52 21.32 24.52 15.01
4 Double angle on opposite side with Lip
50x50x2 71.02 82.24 15.80 24.76 28.46 14.94
60x60x2 88.88 101.32 14.01 23.43 27.89 19.04
70x70x2 103.37 118.32 14.46 24.13 29.17 20.89
50x25x2 51.15 59.28 15.89 19.32 23.15 19.82
60x30x2 60.59 69.05 13.96 18.32 22.31 21.78
70x35x2 72.12 82.24 14.03 18.51 22.34 20.69
5 Double angle on same side without Lip
50x50x2 59.76 67.25 12.53 25.65 29.32 14.31
60x60x2 73.70 84.25 14.31 24.91 29.55 18.63
70x70x2 87.81 101.28 15.33 23.33 28.15 20.66
50x25x2 41.98 47.28 12.62 22.23 27.16 22.18
60x30x2 49.95 57.25 14.61 21.25 25.31 19.11
70x35x2 59.85 68.28 14.08 19.35 24.54 26.82
6 Double angle on same side with Lip
50x50x2 72.37 82.78 14.38 25.32 29.54 16.67
60x60x2 89.34 102.32 14.53 24.12 27.34 13.35
70x70x2 106.35 121.32 14.07 24.22 28.26 16.68
50x25x2 50.66 58.25 14.98 21.89 25.32 15.67
60x30x2 60.77 70.34 15.74 22.24 26.42 18.79
70x35x2 71.68 82.12 14.56 22.56 26.33 21.14
Average 14.52 Average 17.10
8. Proposed Design Equation for Determining the Net Section Tension Capacity
The tensile strength of the angle sections can be evaluated in terms of the ratio of its average stress at ultimate load (Pexp/An) to the ultimate tensile strength (fu) of the material. This ratio is
called as the net section efficiency which represents reduction in load carrying capacity. The comparisons between predicted values lead to more accurate estimates for the tested specimens. Based on the above comparisons, geometrical factors such as connection eccentricity (x), connection length (L), width of connected leg of the angle (ac), net width of connected leg of the angle (acn), width of unconnected leg (ad), nominal bolt diameter (d) and angle thickness (t) have effect on net section efficiency. Therefore, new net section efficiency (U) equation is developed for both single and double angles incorporating the above geometrical factors. In order to establish the form of the equation, regression analysis including linear and non-linear regression analysis have been performed using commercially available statistical software Sigmaplot 10. It was pointed out that the use of statistical regression analysis for deriving the design Equation.
The net section efficiency equation is
U=1.034 -0.311(x / L) - (0.15acn+0.25ad -0.861d -1.5t)/ ac (1)
Http://www.ijetmr.com©International Journal of Engineering Technologies and Management Research [28]
Pun = U An fu.
Where, An = Net area of cross section; U = net section efficiency; fu = Ultimate load
9. Conclusions and Recommendations
Based on the experimental, numerical and analytical results were concluded.
1) All angles section values predicted by the international codes BIS, AISI, AS/NZS and BS. Experimental Ultimate loads are nearly 10% to 12% less than the all codal provisions.
2) The stress contours obtained in the finite element analysis indicates that maximum stresses occur in the innermost bolt holes from which the experimental failures were initiated.
3) The proposed equation for net section tension capacity is applicable for all the section which gives more accruable value when compared to experimental values.
References
[1] AS/NZS: 4600 (2005), 'Cold-formed Steel Structures', Australia / New Zealand Standard.
[2] BS: 5950-Part 5 (1998), 'Structural Use of Steelwork in Building-Code of practice for design of cold-formed thin gauge sections', British Standards Institution.
[3] Gupta L.M and Mohan Gupta (2005), "Limit state design of bolted steel angles under tension", Journal of Structural Engineering, Vol.31, No.4, pp265-274.
[4] AISI (1996). Cold-Formed Steel Design Manual, American Iron and Steel Institute, Washington, D.C.Google Scholar
[5] AISI (2001). Cold-Formed Steel Standard, American Iron and Steel Institute, Washington, D.C.Google Scholar
[6] ANSYS Release 8.1 (2004). ANSYS, Inc., USA.Google Scholar
[7] AS/NZS (1996). Australian/New Zealand Standard, Cold- Formed Steel Structures, Sydney, Australia.Google Scholar
[8] Desmond, T. P., Pekoz, T., and winter, G. (1981). “Edge stiffeners for thin-walled members.” Journal of Structural Engineering, 107(2), pp. 329–353.Google Scholar
[9] Lam, S. S. E., Chung, K. F., and Wang, X. P. (2006). “Loadcarrying capacities of cold-formed steel cut stub columns with lipped C-section.” Thin-Walled Structures, 44, pp. 1077–1083.Google Scholar
[10] NAS (2001). Specification for the Design of Cold-formed Steel Structural Members, North American Specification, Washington, D.C.Google Scholar
*Corresponding author.