Earth Syst. Sci. Data, 5, 187–197, 2013 www.earth-syst-sci-data.net/5/187/2013/ doi:10.5194/essd-5-187-2013
©Author(s) 2013. CC Attribution 3.0 License.
History
of Geo- and SpaceSciences
Open
Access
Advances
inScience & Research
Open Access Proceedings
Open
Access
Earth System
Science
Data
OpenAccess
Earth System
Science
Data
D
iscussions
Drinking Water
Engineering and Science
Open Access
Drinking Water
Engineering and Science
Discussions
O
pen
Acc
es
s
Social
Geography
Open
Access
D
iscussions
Social
Geography
Open
Access
Technical details concerning development of a 1200 yr
proxy index for global volcanism
T. J. Crowley and M. B. Unterman
School of Geosciences, The University of Edinburgh, Grant Institute, The King’s Buildings, West Mains Road, Edinburgh EH9 3JW, UK
Correspondence to: T. J. Crowley ([email protected])
Received: 14 November 2011 – Published in Earth Syst. Sci. Data Discuss.: 26 January 2012 Revised: 15 January 2013 – Accepted: 4 March 2013 – Published: 23 May 2013
Abstract. This report describes details of developing a volcano forcing reconstruction (Crowley et al., 2008) for climate models that is based primarily on sulphate records in Antarctic and Greenland ice cores. The chronology of eruptions is considered accurate to within 1 yr for the interval AD 1104–2000 and about 2 yr for AD 800–1103. The reconstruction involves (1) calibration against satellite aerosol optical depth (AOD) estimates of the 1991 Pinatubo/Hudson eruptions; (2) partial validation against independent lunar estimates of AOD and global sulphate emissions; (3) partial assessment of uncertainties in AOD estimates; (4) assessment of possible tropical “false positives” in ice core reconstructions due to simultaneous occurrence of mid/ high-latitude eruptions in each hemisphere; (5) identification of a new category of eruptions, termed “unipolar” tropical eruptions, in which the eruption plume penetrates mainly to polar regions in only the hemisphere of its eruption; (6) use of different growth curves for high- and low-latitude eruptions; (7) specification of 2/3 power shortwave scaling for eruptions larger than the 1991 Pinatubo eruption; (8) introduction of an estimate of ef-fective particle size that affects lifetime and scattering properties of stratospheric aerosols; and (9) utilization of bimonthly-resolution electrical conductivity measurements to estimate the eruption date of the 1258/1259 eruption as 1257.7±0.2. The data, and a high-temporal resolution reconstruction for climate models, are avail-able at: http://hurricane.ncdc.noaa.gov/pls/paleox/f?p=519:1:::::P1 STUDY ID:14168.
1 Introduction
Over the last fifteen years there has been a virtual explo-sion of interest in the role of volcanism in climate change (e.g., Free and Robock, 1999; Crowley, 2000; Robock, 2000; Timmreck et al., 2009; Jungclaus et al., 2010; Schmidt et al., 2011). Such work necessitates the use of reliable estimate of volcanic forcing. As polar ice cores contain the best records of past volcanism, the challenge has focused on document-ing volcanic peaks in polar ice cores and convertdocument-ing them into estimates of stratospheric aerosol forcing, which is the term needed for specification in climate model simulations. With each iteration, the development of polar records of vol-canism has become more comprehensive and detailed (e.g., Crowley et al., 1993; Robock and Free, 1995, 1996; Crowley, 2000; Gao et al., 2008). In 2008 (Crowley et al., 2008), we published preliminary findings for a new reconstruction that
focused not only on new ice core information but also cal-ibration of the ice core record against stratospheric aerosol depth measurements of the last three decades. Herein we pro-vide the full documentation of the methodology used in that study to create a new 1200 yr reconstruction of volcanism.
2 Development of time series of volcanic eruptions
2.1 Determination of volcanic peaks
188 T. J. Crowley and M. B. Unterman: Development of a 1200 yr proxy index for global volcanism
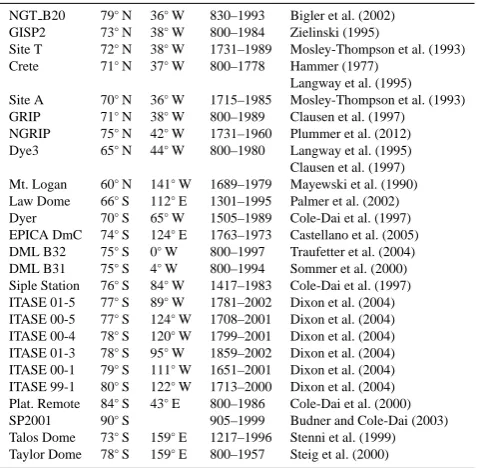
Table 1.Location and duration in years AD of sites used in this study.
NGT B20 79◦N 36◦W 830–1993 Bigler et al. (2002)
GISP2 73◦N 38◦W 800–1984 Zielinski (1995)
Site T 72◦N 38◦W 1731–1989 Mosley-Thompson et al. (1993)
Crete 71◦N 37◦W 800–1778 Hammer (1977)
Langway et al. (1995) Site A 70◦N 36◦W 1715–1985 Mosley-Thompson et al. (1993)
GRIP 71◦N 38◦W 800–1989 Clausen et al. (1997)
NGRIP 75◦N 42◦W 1731–1960 Plummer et al. (2012)
Dye3 65◦N 44◦W 800–1980 Langway et al. (1995)
Clausen et al. (1997) Mt. Logan 60◦N 141◦W 1689–1979 Mayewski et al. (1990)
Law Dome 66◦S 112◦E 1301–1995 Palmer et al. (2002)
Dyer 70◦S 65◦W 1505–1989 Cole-Dai et al. (1997)
EPICA DmC 74◦S 124◦E 1763–1973 Castellano et al. (2005)
DML B32 75◦S 0◦W 800–1997 Traufetter et al. (2004)
DML B31 75◦S 4◦W 800–1994 Sommer et al. (2000)
Siple Station 76◦S 84◦W 1417–1983 Cole-Dai et al. (1997)
ITASE 01-5 77◦S 89◦W 1781–2002 Dixon et al. (2004)
ITASE 00-5 77◦S 124◦W 1708–2001 Dixon et al. (2004)
ITASE 00-4 78◦S 120◦W 1799–2001 Dixon et al. (2004)
ITASE 01-3 78◦S 95◦W 1859–2002 Dixon et al. (2004)
ITASE 00-1 79◦S 111◦W 1651–2001 Dixon et al. (2004)
ITASE 99-1 80◦S 122◦W 1713–2000 Dixon et al. (2004)
Plat. Remote 84◦S 43◦E 800–1986 Cole-Dai et al. (2000)
SP2001 90◦S 905–1999 Budner and Cole-Dai (2003)
Talos Dome 73◦S 159◦E 1217–1996 Stenni et al. (1999)
Taylor Dome 78◦S 159◦E 800–1957 Steig et al. (2000)
variability as the baseline point for estimating excess flux for a particular volcanic event. Sometimes the baseline pe-riod can extend for several decades, in which case a confi-dent assessment of volcano peak amplitude can be obtained. Sometimes there are clusters of sulphate spikes that make as-sessment of an individual peak more uncertain. In such cases the post-eruption variability was used as a further constraint on appropriate background levels.
Although all Antarctic cores have been measured for sul-phate flux, there is a disappointing lack of published mul-tiple site annual-scale estimates of millennial sulphate flux for Greenland. Before 2012, only the GISP2 (Greenland Ice Sheet Project) record had a continuous sulphate record (Zielinski, 1995), and that is “only” at approximate biannual resolution (n.b., annual sulphate levels for the North GRIP (Greenland Ice Core Project) ice core were published in 2012 (Plummer et al., 2012) but only a shorter record was available for this study). Three other Greenland cores (Crete, Dye3, and GRIP) have near-annual scale electrical conductivity measurements (ECM) and spot sulphate measurements. Spot sulphate measurements (Langway et al., 1995; Clausen et al., 1997) were used to scale the higher resolution ECM record in these cores to sulphate. Three additional cores were used in the upper part of the record to better constrain estimates over the last two centuries and develop a bias estimate for the fewer number of records over the entire length of the se-ries.
2.2 Chronology
Dating of Greenland cores to a year can be extended with considerable confidence back to AD 1104 because of cross-checking with historical eruptions on Iceland (e.g., Ham-mer, 1977). For the interval 800–1103, uncertainty in Ice-landic eruptions is greater – probably 1–2 yr for the “Settle-ment Event” around AD 871 and the large Eldgja fissure flow around 933. These are the best-guess ages determined by de-tailed intercomparisons of three high-resolution Greenland ice cores (Vinther et al., 2006) and are the ages adopted here. Antarctic dating is more difficult, although a number of cores have annual-scale resolution. Still, false bands and missing bands can potentially occur in these records. Records can be cross-checked with Greenland for a number of large tropical eruptions – Krakatau (1883), Tambora (1815), Huay-naputina (1600), and the unknown but very large 1257/1258 eruption. Prior to that time Antarctic dating is more uncer-tain, for it is difficult to find any confident matchups with the Greenland records, especially since “false positives” – simul-taneous mid/high latitude eruptions in both hemispheres – are a distinct possibility. Cross-checking of Antarctic records (cf., Langway et al., 1995) indicates that the records seem to be consistent, but the fits are not airtight. Although it is not possible to make a precise uncertainty estimate of pre-1258 Antarctic peaks, an educated guess would be that the chronology of Antarctic eruptions prior to 1258 is accurate to within 2–3 yr.
2.3 Development of composite records for Greenland and Antarctica
Sulphate peaks for the individual ice cores were first compos-ited separately for Greenland and Antarctica (see data link). Sometimes, ice cores do not record events identified in other ice cores. This is usually the case for smaller volcanic erup-tions, although a notable exception is Krakatau (1883), which cannot be found in the GRIP ice core. The average value for an event across all ice cores on an ice sheet includes “0” for cores that do not record the event. This approach mutes the impact of some volcanic events that can be large in one ice core but small or absent in other ice cores (e.g., large 1588 and 1829 GISP2 sulphate peaks).
Because Greenland is a much smaller ice mass than Antarctica, mean values were just averaged for available records. Some records are only from the upper part of a core, and temporal biasing can occur due to “dropout” of infor-mation in the older part of the time series. Subsets from the younger interval were compared to the fuller data set over the last two centuries, and a bias correction was added to the initial value for the older intervals.
of two higher than for East Antarctic sites. Yet these regions are only about 10–15 % of the area of Antarctica. The 10 % value was used to area-weight the contribution values from different regions and also estimate a West Antarctic com-ponent for eruptions older than the oldest annual-resolution ice core (about AD 1450, cf., Cole-Dai et al., 1997). Prior to 1450, West Antarctic contribution for a particular erup-tion was estimated as twice the East Antarctic value. Tempo-ral bias estimates for Antarctica were calculated in the same manner as for Greenland.
2.4 Correction for latitude of eruptions
Local eruptions can have a disproportionate effect on volcano composites unless adjustments are made to the measured val-ues in ice cores. Failure to satisfactorily account for such lo-cal biasing could in theory lead to interpretation of coinci-dent peaks in both hemispheres as indications of a tropical eruption, leading to significant errors in subsequent climate model simulations. Icelandic eruptions are particularly trou-blesome because of their high frequency and because much of the sulphate may be delivered through the troposphere.
Because the index developed for this study is a record of stratospheric aerosol optical depth (AOD), Icelandic erup-tions (taken from www.volcano.si.edu/) were generally mini-mized or eliminated from the ice core composite unless some evidence could be found for larger-scale influence. For ex-ample, some Icelandic peaks can be found in ice cores from western Canada (Mayewski et al., 1990), although the values are much-muted from Greenland. In this case this far-field site was used to estimate the potential stratospheric input from some Plinian interludes of Icelandic eruptions. For ex-ample, the inferred stratospheric component of the 1783 Laki eruption is only about 15 % of the average sulphate loading for this event on Greenland. The procedure is not foolproof; some of the western Canada sulphur could have been trans-ported in the troposphere across Asia and the North Pacific. As in all geological records, there may also be “site effects” that inflence local deposition rates. Nevertheless, our correc-tion is almost certainly in the right direccorrec-tion and could even be considered a maximum stratospheric estimate due to the above caveats.
A somewhat similar approach can in theory be applied to Antarctic records, although the identification of local erup-tions is more problematic. Kurbatov et al. (2006) have iden-tified local ashes in some intervals of the Siple Dome ice core. Sulphate variablity in the Taylor Dome record also seems strongly influenced by local (Antarctic) volcanism. In some cases (e.g., 843, 1170, 1710), the size of sulphate peaks in Taylor Dome are very much larger than found in any other Antarctic ice cores, and a local source for the erup-tions can be fairly confidently established. Comparison of the Taylor Dome record with the historical record of vol-canism (www.volcano.si.edu/) over the last 150 yr suggests that any Taylor Dome peak in excess of 58 ppb is a
candi-date for a local eruption source. These eruptions have there-fore been deleted from the Antarctic composite because the hemispheric effects are likely nil. One consequence of this screening is that Antarctic peaks at 1170, 1276, and 1289 – records sometimes inferred to indicate tropical eruptions because of co-occurrence in Greenland – have been deleted from our reconstruction.
A final set of corrections involves large mid/high latitude eruptions (e.g., Japan, Siberia, Alaska) that are significant but still bias regional estimates due to proximity to the deposi-tion sites. Clausen and Hammer (1988) pioneered the use of radioactive nuclides from bomb testing to estimate this lo-cal “bias” effect. In reality this is probably not as much local bias but more a reflection of dropout of material from equa-torial eruptions before the aerosol plume reaches the polar region. Gao et al. (2007) updated the Clausen–Hammer ap-proach with more recent estimates of stratospheric injection of radioactive nuclides. They determined that, for a given in-jection, there was about a 20 % “dropout” of equatorial injec-tions as the plume spreads to polar regions. This estimate is very similar to satellite estimates of a 20 % reduction in peak high-latitude NH AOD for the Pinatubo eruption (Sato et al., 1993; http://data.giss.nasa.gov/modelforce/strataer). The consistency in these approaches indicates that the critical low-latitude inputs of climatically-important tropical erup-tions can be estimated with some degree of confidence.
3 Calibration and validation against AOD
3.1 Calibration of mean sulphate values against stratospheric AOD
Mean sulphate values were scaled against AOD by matching against the maximum twelve-month value for 30–90◦S AOD
from satellite measurements (Sato et al., 1993; http://data. giss.nasa.gov/modelforce/strataer/). The comparison is only made for Antarctica, because there are not enough Green-land ice core measurements for the 1990s, more noise from background tropospheric aerosol emissions and, we suspect, interannual deposition variability due to changes in the North Atlantic Oscillation.
190 T. J. Crowley and M. B. Unterman: Development of a 1200 yr proxy index for global volcanism
27-35
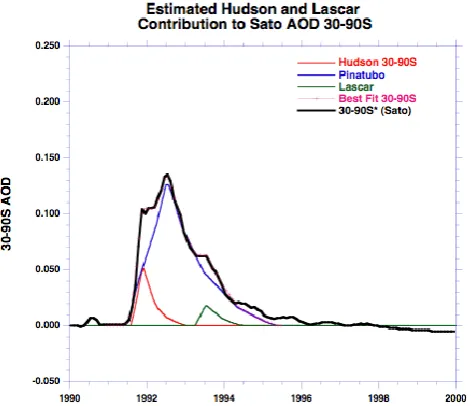
Figure 1. Best fit iteration of contribution of smaller Southern Hemisphere eruptions to the zonal mean 30–90◦
S values of Sato et al. (1993).
modest effects on the stratospheric AOD record of volcanic forcing.
The area-weighted (see above) mean sulphate flux for Antarctica is 10.1±1.0 (2σ) kg km−2. Although there is con-siderable scatter in sulphate loading for individual sites, the above uncertainty estimate was based on evaluating uncer-tainty in the average based on addition of new cores, remea-surements of fluxes for different ice cores to test for consis-tency, and also assessment of the averaging effect for inclu-sion of higher accumulation rate cores from West Antarctica (see above).
Since the maximum twelve-month (November 1991 to October 1992) estimated 30–90◦S AOD from satellite
es-timates is 0.120, and the background level is 0.065, then the Pinatubo/Hudson AOD contribution is 0.114. Round-ing offslightly, the conversion rate for sulphate is therefore 0.011±0.0012 AOD kg−1km−2. This is the value used as ini-tial scaling of sulphate to large-scale zonal AOD.
3.2 Partial validation of mass estimates from ice cores A mean flux of global sulphate can be determined by tak-ing the mean Antarctic values, and multiplytak-ing by 1.057 for the difference between mean twelve-month maximum Greenland AOD (0.120) and the 1.2 low-latitude multiplier discussed above. The global value is consistent with AOD estimates for low- and high-latitudes independently deter-mined by Sato et al. (1993). The estimated mean global sul-phate flux is 6.1±0.6 MT sulphate for the interval November 1991 to October 1992 – the interval over which the Antarc-tic flux levels have been scaled to AOD. Note that the un-certainty is only that due to unun-certainty is estimating mean
28-35
Figure 2.Observed zonal variability of the Pinatubo plume from Sato et al. (1993).
values for Antarctic. Total uncertainties are almost certainly greater than that number but are difficult to constrain.
Two different approaches to initial injection levels of sul-phur from the Pinatubo eruption yield values 27–28±6 MT sulphate (Guo et al., 2004; the Hudson injection is almost an order of magnitude lower, 3 MT). The Pinatubo value is four times the estimate from the ice core composite. How-ever, Guo et al. (2004) point out that one-half of the initial injection had been scavenged within twenty days by volcanic ash and water vapor injected (or entrained) with the eruption plume. Any curve fits out to 1.5 yr based on the initial twenty days of operation yielding unrealistic values – either zero or levels well above that suggested by the ice cores. Additional processes, including dispersion of the low-latitude cloud to higher latitudes, may have significantly delayed the exponen-tial decay based on just the first twenty days. What we can say is that the 6.1±0.6 MT value that we obtain does not seem significantly out of line with the 14±6 MT values remaining only three weeks after the 15 June 1991 eruption.
3.3 Life cycle of pinatubo eruption
Satellite observations of Pinatubo (Fig. 2) were inspected to develop a latitude-dependent canonical growth and decay model for time evolution of the aerosol perturbation. Satel-lite AOD indicates that for the Pinatubo eruption peak low-latitude (0–30◦N) AOD occurred about five months after the
29-35
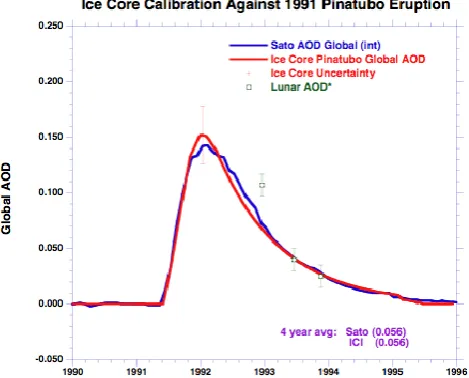
Figure 3.Calibration of ice core “Pinatubo” plume against Sato et al. (1993) global AOD, using rules discussed in the text. Also shown are lunar AOD estimates from Keen (2001).
The Pinatubo reconstruction for 30–90◦N indicates that it took approximately nine months to reach maximum values, which then persisted for approximately three months before decaying with an e-folding time of approximately one year. The 60–90◦S time series for Pinatubo indicated that it took
nearly a year after the eruption to reach maximum values over Antarctica. These observations were incorporated into the algorithm transferring sulphate fluxes into AOD.
3.4 Comparison with global AOD index
Using observations and methodologies discussed above, a global reconstruction (Fig. 3) was developed from the Antarctic sulphate data and compared to the Sato AOD global composite. Lunar eclipse estimates of AOD for the Pinatubo eruption (courtesy R. Keen, based on method of Keen, 1983) were further compared as a check on the recon-struction. The good agreement of the ice-core reconstruction with the satellite reconstruction merely demonstrates that the scaling was done properly. Although there is a slight underes-timate of peak forcing (due to the non-standard evolution of the 30–90◦S signal), the four-year average AOD, and
there-fore average radiative forcing, for the ice core reconstruction is identical to Sato et al. (1993). This agreement is very im-portant because the total forcing of a reconstruction is neces-sary for correct computation of ocean heat storage changes. The agreement with the lunar eclipse data is very good for two of the eclipses but quite poor for the third eclipse. We suspect that the size of the aerosol particles at this time may significantly bias lunar AOD estimates (see further discus-sion below).
4 Development of millennial-scale reconstruction
4.1 Problem of “unipolar” tropical eruptions
Despite the large-size of the 1982 El Chichon eruption, its aerosol is hardly detected over Antarctica, either in the satel-lite or ice core data. A similar situation applies to the North-ern Hemisphere for the 1963 Agung eruption and for Antarc-tica for the 1902 Santa Maria (Caribbean) eruption. These “unipolar” tropical eruptions are difficult to determine in ear-lier time series and, because of the climatic importance of tropical eruptions, are a sources of significant uncertainty in ice core reconstructions. Based on the experience with the 20th century unipolar eruptions, this category appears to oc-cur for medium-large sized volcanic (VEI=5) eruptions that, because of the rough power law scaling of volcanic eruptions, should be about ten times more common than the more pow-erful VEI=6 eruptions (e.g., Pinatubo). Their identification in older records is, however, ambiguous. If small sulphate peaks occur in the opposite hemisphere to a large sulphate peak, it could indicate an eruption of this type. It could also be coincidental. A method we adopt involves assignation of unipolar tropical status to eruptions that have a high-latitude average flux on the order of 10 kg km−2 (e.g., Agung, St. Maria, 1902) and at least three occurrences of events with
∼2–3 kg km−2in the opposite hemisphere (this stipulation is to minimize chance noise being elevated to a small peak of volcanic significance, which then turns into a unipolar trop-ical eruption). Large cooling persisting for more than a year in proxy records might be some way of inferring a possible tropical source, but then the volcano and climate reconstruc-tions would not be independent.
The relative magnitude of unipolar tropical forcing also differs from true bipolar eruptions. As indicated by data from Agung and El Chichon, low latitude forcing is much more restricted to the hemisphere of the eruption, whereas for Pinatubo the southern tropical strip has virtually the same value as the northern tropical strip. Evidence for El Chichon (Sato et al., 1993) and Agung (Stothers, 2001) indicates that the tropical “multiplier” (see above, Sect. 2.4) in the hemi-sphere of the unipolar eruption has an AOD maximum at least 30 % (as opposed to 20 %) higher than its polar max-imum. AOD values are also substantially lower in the op-posite tropical hemisphere than they are for Pinatubo. In our reconstructions we therefore stipulate that the opposite hemi-sphere to a unipolar eruption has a tropical value midway be-tween the tropical hemispheric maximum and the very low values observed in polar regions.
192 T. J. Crowley and M. B. Unterman: Development of a 1200 yr proxy index for global volcanism
30-35
Figure 4. Supporting evidence of a shorter life cycle for high latitude eruptions based on Stother’s (1996) reanalysis of sur-face observations for 1912 Novarupta eruption and bimonthly-scale ECM (µEq kg−1) from the GISP2 ice core (Taylor et
al., 1997, ftp://ftp.ncdc.noaa.gov/pub/data/paleo/icecore/greenland/ summit/gisp2/ecm/).
4.2 Duration of mid/high latitude aerosol plumes The time evolution of high-latitude eruptions is different than the low-latitude extension of Pinatubo and was based on Stothers’s (1996) reanalysis of data for the 1912 Novarupta eruption in Alaska and cross-checked against the August 1991 eruption of Hudson in Chile (Fig. 1). Stother’s anal-ysis indicates that peak values occur within two months of the eruption, persist for three months, and then decay more rapidly than for an equatorial eruption – the e-folding time for the first step is only three months, but it is nine months for the second step. The longer second step may reflect in-put from the 20 January 1913 eruption (VEI=5) of Colima (19◦N) in Mexico.
The Stothers’ result is supported by a comparison of bimonthly-scale ECM measurements of the 1912 interval in the GISP2 ice core (Fig. 4). The difference between the ECM and AOD estimates for the interval around 1913.0 could re-flect either residual higher values of aerosols in the highest latitudes (the core is at 73◦N – farther north than any mea-surement station in Stothers’ analysis), superposition of the annual cycle of higher accumulation in the ice core winter (note magnitude of annual cycle in later intervals of the ECM record), or some combination of the two. One possible expla-nation for the more rapid evolution of high-latitude plumes may involve a smaller volume of air containing debris from the eruption (thereby leading to more frequent collisions of particles, faster growth rates, and dropout of aerosols).
Because we are still in the early stage of understanding general rules for high-latitude eruptions, we chose more con-servative values for the evolution of mid-high latitutude
erup-31-35
Figure 5.Independent test of ice core AOD calibration, and 2/3 power scaling rule, against Stother’s (1996) reanalysis of 1912 No-varupta eruption. For reference, the Sato et al. (1993) values are also shown.
tion plumes. The evolution was specified as having a 100 day ramp (see further discussion below, in Sect. 4.4), a peak “plateau” 70 days long, a plateau with peak values 1.3 times the initial value (rather than 1.2 for Pinatubo), and an e-folding time of 250 days.
Stothers’ analysis of the 1912 eruption also suggests that, despite its clear power (VEI=6), the aerosol plume did not reach equatorial regions. Ground-based British AOD obser-vations in Cairo (30◦N) indicate the perturbation was barely detectable at that latitude. This result has been generalized to apply to all high-latitude eruptions, plus mid-latitude erup-tions (a clear mid-latitude Northern Hemisphere eruption (e.g., Japanese eruption of 1667) has not been identified in Antarctic sites).
4.3 Additional scaling for large eruptions
Because collisions between aerosol particles result in size in-creases, shortwave radiative forcing is reduced by the 2/3 power (ratio of surface to volume). We assume this scaling is implicitly taken into account for eruptions up to the size of Pinatubo (peak AOD about 0.180). Above that level some additional scaling is required. In this study, 2/3 power scaling was applied to all values greater than or equal to 0.200 AOD. We tested this approach for the large 1912 eruption (Fig. 5); the results are consistent within the range of uncertainty of ground-based observations, but more studies would have to be made to test this assumption further.
4.4 Aerosol size
32-35
Figure 6.Comparison of observed AOD and effective radius (Reff)
for Pinatubo, indicating the lag in Reffthat probably reflects disper-sion and then agglomeration of aerosol particles.
climate impact of very large eruptions (e.g., Timmreck et al., 2009). Based on the relation between AOD and Reff(effective radius) in the GISS reconstruction for Pinatubo (Fig. 6) – no-tably the lag between peak Reff and AOD – and estimates of maximum particle size from Pinto et al. (1989), a sim-ple calculation captures many of the observed properties of
Reffin Pinatubo. Because aerosol coagulation results in AOD scaling to the 2/3 power of mass, Reffwas simply estimated from the 1/3 power of AOD, plus the 0.200 baseline of Sato et al. (1993; http://data.giss.nasa.gov/modelforce/strataer/). During non-volcano years, Reff was set at 0.200, again con-sistent with Sato et al. (1993).
4.5 Time of year for eruptions (including great 1258/1259 eruption)
The Smithsonian volcanism website (www.volcano.si.edu/) provides a wealth of information on eruption dates for more recent eruptions – these were stipulated in the reconstruc-tion. For most unknown eruptions, a start date of 1 January was used as a default. However, if an ice core record of a postulated tropical eruption had maximum sulphate values in year two of the signal, then a mid-year (1 July) start date was inferred (based on observations for length of time it took the Pinatubo signal to reach polar regions).
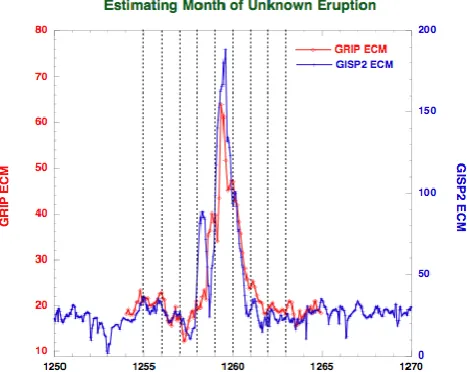
Subsequent to finalization of the present volcanic in-dex, it was discovered that very high-resolution (bimonthly-scale) ECM time series might be used to also estimate the month/season of an eruption, because in Greenland there is a small annual winter peak in ECM associated with higher snowfall rates. For example, the onset of the great “1258” eruption at the beginning of 1258 in the ice core ECM record would (Fig. 7), by analogy with the length of time required for the first-traces of the Pinatubo cloud to spread to
Green-33-35
Figure 7. Comparison of bimonthly-scale ECM profiles of GISP2 and GRIP at the time of the “1258” eruption, with small peaks (vertical dashed lines) indicating winter peak of snow accumulation. ECM data for GISP2 from Taylor et al. (1997, ftp://ftp.ncdc.noaa.gov/pub/data/paleo/icecore/greenland/ summit/gisp2/ecm/); GRIP data after Clausen et al. (1997). ECM data inµEq kg−1.
land and Antarctic (Sect. 3.3), suggest an eruption around September 1257, with an approximate uncertainty of 2–3 months. This result was tested on the AD 79 Vesuvius erup-tion, with estimated time of eruption consistent within 2–3 months with historical observations. Due to the lateness of the discovery, and the need to release the data for climate simulations (Jungclaus et al., 2010), the methodology has been applied only to the 1257 eruption, but it could with some effort be applied to other eruptions.
4.6 Completed AOD reconstruction
194 T. J. Crowley and M. B. Unterman: Development of a 1200 yr proxy index for global volcanism
34-35
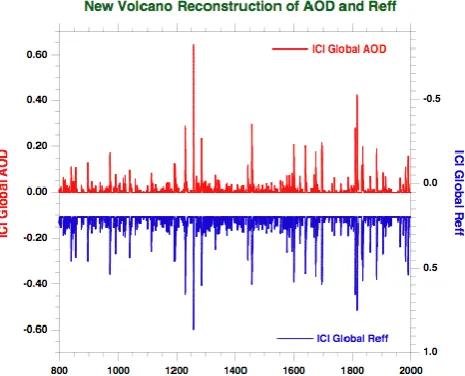
Figure 8.Comparison of reconstructed AOD and Refffor new ice core reconstruction (ICI stands for “ice core index”); note that Reff
is plotted on reverse scale to enable easier comparison.
could be of tropical origin, possibly from Indonesia (possi-bly Awu), where Plinian eruptions are common.
The mean annual global AOD is listed in the data link. Finally, since climate models often update radiative forcing on a time step of approximately 10 days, the reconstruction was also partitioned into time steps of 1/36 yr and is in the data link.
4.7 Comparison with Gao et al. (2007) reconstruction While it is beyond the scope of this paper to discuss in de-tail the application and implication of the final reconstruc-tion (Fig. 8), we note that the reconstrucreconstruc-tion shows more or less than the standard pulses of volcanism that have been documented before, with the differences being the hopefully improved calibration of the AOD and addition of effective radius size, and the screening of some eruptions that were probably local in origin. Schmidt et al. (2011) illustrate a comparison with the Gao et al. (2007) reconstruction, which also uses cores from sources not available for the present study. Although there is general agreement in timing of ma-jor eruptions over the last 800 yr, there are a few significant differences
The Gao et al. reconstruction generally has higher values of AOD for the largest historical eruptions – a feature we suspect is due to the 2/3 power scaling used in our study. We suspect that the global reach of the alleged 1831 Babuyan eruption has also probably been overestimated, because the very large Greenland fluxes (order 30 kg km−2) seem incon-sistent with a crater size (0.2 km) ten times smaller than the Pinatubo crater and frequent lack of a clear signature in Antarctic records. Improvements in chronology and identi-fication of regional eruptions (see Sect. 2.4) suggest that an
35-35
Figure 9.A further independent test of AOD calibration for 1883 Krakatau eruption, using lunar AOD data from Keen (2001). Note that the second “bump” in the reconstruction reflects the addition of new aerosol from the 1886 Okataina eruption on New Zealand.
Antarctic peak about that time actually may actually have been deposited in 1833 and could be of local origin. We also do not have a large AOD for the 1783 Laki eruption, because we think most of it is tropospheric in origin (see Sect. 2.4). In fact, Lanciki et al. (2012) recently report sulphur isotope evidence that little or none of the Laki sulphur deposited in Greenland was in contact with the stratosphere.
As also concluded by Gao et al. (2007), the estimates for the powerful Krakatau eruption suggests sulphur values are not much greater than for Pinatubo – despite the obviously great difference in the power of the eruptions. An additional test of this conclusion is illustrated in Fig. 9, which compares lunar AOD estimates from Keen (2001) to the growth and de-cay curve for that interval as estimated by our methodology. The lunar eclipse 14 months after the eruption agrees very well with our canonical growth and decay curve, while the eclipse about seven months after the eruption shows slightly lower values than we estimated. We suspect that the slight offset is in part due to the fact that we used a standard nine month buildup for the Krakatau plume to reach northern high latitudes, whereas lessons from the Pinatubo eruption (Sect. 3.3) suggest that it probably took 11–12 months to reach the polar hemisphere from the volcano located at 6◦S
indications (again, see Sect. 2.4) of at least one coincidental local eruption at the time of one of the Greenland eruptions previously inferred by all investigators (including ourselves – Crowley, 2000) as being tropical in origin.
There is also a difference in estimate of the 1450s “Kuwae” peak (Gao et al., 2006). In our reconstruction we do not find a large 1453 signal in Greenland records and use a 1456 estimate from Castellano et al. (2005), which was what we considered the best estimate at the time (sub-sequently we now think the Castellano et al. (2005) data sug-gest 1457 rather than 1456). Improved dating of the event in a Law Dome core (Plummer et al., 2012) now suggests that Kuwae may have erupted in mid-late 1457.
There is a large signal in 1458/1459 of our reconstruction and the GRIP ECM reconstruction (Vinther et al., 2006). The chronology justification of the 1458/1459 ECM/SO4 event seems very firm, because there is a very-well dated Icelandic eruption in 1477 that can be found in almost all Greenland cores. Given that the AD 79 Vesuvius signal occurs within a year of the band-counted signal in the GISP2 and GRIP ice cores, we cannot conceive of a 5 yr error occurring in the GISP2 core only fifteen years prior to a clearly identified ref-erence level. Nevertheless, we concede that the subject war-rants further discussion. Overall, we consider that the com-parison between the our’s and the Gao and Robock recon-struction yields a “reasonable” level of agreement.
Examination of the bimonthly ECM record in GISP2 indicates two peaks embedded in the 1458/1459 sulphur event. One possible interpretation of the 1450s data is that the first GISP2 ECM peak represents the∼12 month delayed arrival of the Kuwae (16◦S) sulphur plume, while the second
peak represents perhaps a high latitude eruption, such as Aniachak (Alaska, VEI = 4+, corrected date 1528±72, www.volcano.si.edu/). We therefore conclude that our interpretation is entirely consistent with the revised date estimated by Plummer et al. (2012).
http://hurricane.ncdc.noaa.gov/pls/paleox/f?p=519:1::::: P1 STUDY ID:14168
Acknowledgements. This paper is dedicated to scientists and as-sistants at the Smithsonian Institution Global Volcanism Program, whose compilations and website have been of immense value to working scientists. We also thank scientists at NASA/Goddard Institute for Space Studies for their valuable website providing satellite information on recent volcanic eruptions. We also thank reviewers for their comments. This research was conducted without any aid from public or private funding sources.
Edited by: O. Eisen und J. Martin-Torres
References
Bigler, M., Wagenbach, D., Fischer, H., Kipfstuhl, J., Miller, H., Sommer, S., and Stauffer, B.: Sulphate record from a northeast Greenland ice core over the last 1200 years based on continuous flow analysis, Ann. Glaciol., 35, 250–256, doi:10.3189/172756402781817158, 2002.
Budner, D. and Cole-Dai, J. H.: The number and magnitude of large explosive volcanic eruptions between 904 and 1865 A.D.: Quan-titative evidence from a new South Pole ice core, in: Volcanism and the Earth’s Atmosphere, edited by: Robock, A. and Oppen-heimer, C., AGU, Washington, DC, 165–176, 2003.
Castellano, E., Becagli, S., Hansson, M., Hutterli, M., Petit, J. R., Rampino, M. R., Severi, M., Steffensen, J. P., Traversi, R., and Udisti, R.: Holocene volcanic history as recorded in the sulfate stratigraphy of the European Project for Ice Coring in Antarc-tica Dome C (EDC96) ice core, J. Geophys. Res., 110, D06114, doi:10.1029/2004JD005259, 2005.
Clausen, H. B. and Hammer, C. U.: The Laki and Tambora erup-tions as revealed in Greenland ice cores from 11 locaerup-tions, Ann. Glaciol., 10, 16–22, 1988.
Clausen, H. B., Hammer, C. U., Hvidberg, C. S., Dahl-Jensen, D., Steffensen, J. P., Kipfstuhl, J., and Legrand, M. R.: A comparison of the volcanic records over the past 4000 years from the Green-land Ice Core Project and Dye 3 GreenGreen-land ice cores, J. Geophys. Res., 102, 26707–26723, 1997.
Cole-Dai, J. H., Mosley-Thompson, E., and Thomason, L.: An-nually resolved Southern Hemisphere volcanic history from two Antarctic ice cores, J. Geophys. Res., 102, 16761–16771, doi:10.1029/97JD01394, 1997.
Cole-Dai, J. H., Mosley-Thompson, E., Wight, S. P., and Thoma-son, L.: A 4100-year record of explosive volcanism from an East Antarctica ice core, J. Geophys. Res., 105, 24431–24441, doi:10.1029/2000JD900254, 2000.
Crowley, T. J.: Causes of climate change over the last 1000 years, Science, 289, 270–277, 2000.
Crowley, T. J., Christe, T. A., and Smith, N. R.: Reassessment of Crete (Greenland) ice core acidity/volcanism link to climate change, Geophys. Res. Lett., 20, 209–212, 1993.
Crowley, T. J., Zielinski, G., Vinther, B., Udisti, R., Kreutz, K., Cole-Dai, J., and Castellano, E.: Volcanism and the Little IceAge, PAGES Newslett., 16, 22–23, 2008.
Dixon, D., Mayewski, P. A., Kaspari, S., Sneed, S., and Han-dley, M.: A 200 year sub-annual record of sulfate in West Antarctica, from 16 ice cores, Ann. Glaciol., 39, 545–556, doi:10.3189/172756404781814113, 2004.
Free, M. and Robock, A.: Global warming in the context of the Little Ice Age, Geophys. Res. Lett., 104, 19057–19070, 1999. Gao, C., Robock, A., Self, S., Witter, J. B., Steffenson, J.
P., Clausen, H. B., Siggaard-Andersen, M. L., Johnsen, S., Mayewski, P. A., and Ammann, C.: The 1452 or 1453 AD Kuwae eruption signal derived from multiple ice core records: Greatest volcanic sulfate event of the past 700 years, J. Geophys. Res., 111, D12107, doi:10.1029/2005JD006710, 2006.
196 T. J. Crowley and M. B. Unterman: Development of a 1200 yr proxy index for global volcanism
Gao, C. C., Robock, A., and Ammann, C.: Volcanic forcing of climate over the past 1500 years: an improved ice core-based index for climate models, J. Geophys. Res., 113, D23111, doi:10.1029/2008JD010239, 2008.
Guo, S., Bluth, G. J. S., Rose, W. I., Watson, I. M., and Prata, A. J.: Re-evaluation of SO2 release of the 15 June 1991 Pinatubo erup-tion using ultraviolet and infrared satellite sensors, Geochem. Geophy. Geosy., 5, Q04001, doi:10.1029/2003GC000654, 2004. Hammer, C. U.: Past volcanism revealed by Greenland ice sheet impurities, Nature, 270, 482–486, doi:10.1038/270482a0, 1977. Jungclaus, J. H., Lorenz, S. J., Timmreck, C., Reick, C. H., Brovkin,
V., Six, K., Segschneider, J., Giorgetta, M. A., Crowley, T. J., Pongratz, J., Krivova, N. A., Vieira, L. E., Solanki, S. K., Klocke, D., Botzet, M., Esch, M., Gayler, V., Haak, H., Raddatz, T. J., Roeckner, E., Schnur, R., Widmann, H., Claussen, M., Stevens, B., and Marotzke, J.: Climate and carbon-cycle variability over the last millennium, Clim. Past, 6, 723–737, doi:10.5194/ cp-6-723-2010, 2010.
Keen, R.: Volcanic aerosols and lunar eclipses, Science, 222, 1011– 1013, 1983.
Keen, R.: Volcanic aerosol optical thicknesses derived from lu-nar eclipse observations, Bulletin of the Global Volcanism Net-work, May, http://www.volcano.si.edu/reports/bulletin/contents. cfm?issue=2605; listed under “Atmospheric Effects”, 2001. Kurbatov, A. V., Zielinski, G. A., Dunbar, N. W., Mayewski,
P. A., Meyerson, E. A., Sneed, S. B., and Taylor, K. C.: A 12,000 year record of explosive volcanism in the Siple Dome Ice Core, West Antarctica, J. Geophys. Res., 111, D12307, doi:10.1029/2005JD006072, 2006.
Lanciki, A., Cole-Dai, J., Thiemans, M. H., and Savarino, J.: Sulphur isotope evidence for little or no stratospheric impact by the 1783 Laki volcano, Geophys. Res. Lett., 39, L01806, doi:10.1029/2011GL050075, 2012.
Langway, C. C., Osada, K., Clausen, H. B., Hammer, C. U., and Shoji, H.: A 10-century comparison of prominent bipolar vol-canic events in ice cores, J. Geophys. Res., 100, 16241–16247, doi:10.1029/95JD01175, 1995.
Mayewski, P. A., Lyons, W. B., Spencer, M. J., Twickler, M. S., Buck, C. F., and Whitlow, S.: An ice core record of atmospheric response to anthropogenic sulfate and nitrate, Nature, 346, 554– 556, 1990.
Mosley-Thompson, E., Thompson, L. G., Dai, J., Davis, M., and Lin, P. N.: Climate of the last 500 years: High-resolution ice core records, Quat. Sci. Rev., 12, 419–430, doi:10.1016/ S0277-3791(05)80006-X, 1993.
Newhall, C. G. and Self, S.: The volcanic explosivity index (VEI) :An estimate of explosive magnitude for historical volcanism, J. Geophys. Res., 87, 1231–1238, doi:10.1029/JC087iC02p01231, 1982.
Palmer, A. S., Morgan, V. I., Curran, A. J., Van Ommen, T. D., and Mayewski, P. A.: Antarctic volcanic flux ratios from Law Dome ice cores, Ann. Glaciol., 35, 329–332, 2002.
Pinto, J. P., Turco, R. P., and Toon, O. B.: Self-limiting physical and chemical effects in volcanic eruption clouds, J. Geophys. Res., 94, 11165–11174, doi:10.1029/JD094iD08p11165, 1989. Plummer, C. T., Curran, M. A. J., van Ommen, T D., Rasmussen,
S. O., Moy, A. D., Vance, T. R., Clausen, H. B., Vinther, B. M., and Mayewski, P. A.: An independently dated 2000-yr volcanic record from Law Dome, East Antarctica, including a new
per-spective on the dating of the 1450s CE eruption of Kuwae, Van-uatu, Clim. Past, 8, 1929–1940, doi:10.5194/cp-8-1929-2012, 2012.
Robock, A.: Volcanic eruptions and climate, Rev. Geophys., 38, 191–219, 2000.
Robock, A. and Free, M. P.: Ice cores as an index of global vol-canism from 1850 to the present, J. Geophys. Res., 100, 11549– 11567, 1995.
Robock, A. and Free, M. P.: The volcanic record in ice cores for the past 2000 years, in: Climatic Variations and Forcing Mechanisms of the Last 2000 Years, edited by: Jones, P. and Bradley, R. S., 533–546, Springer, New York, 1996.
Sato, M., Hansen, J. E., McCormick, M. P., and Pollack, J. B.: Stratospheric aerosol optical depths, 1850–1990, J. Geophys. Res., 98, 22987–22994, doi:10.1029/93JD02553, 1993. Schmidt, G. A., Jungclaus, J. H., Ammann, C. M., Bard, E.,
Bra-connot, P., Crowley, T. J., Delaygue, G., Joos, F., Krivova, N. A., Muscheler, R., Otto-Bliesner, B. L., Pongratz, J., Shindell, D. T., Solanki, S. K., Steinhilber, F., and Vieira, L. E. A.: Climate forc-ing reconstructions for use in PMIP simulations of the last mil-lennium (v1.0), Geosci. Model Dev., 4, 33–45, doi:10.5194/ gmd-4-33-2011, 2011.
Sommer, S., Appenzeller, C., Rothlisberger, R., Hutterli, M., Stauf-fer, B., Wagenbach, D., Oerter, H., Wilhelms, F., Miller, D. J., and Mulvaney, R.: Glacio-chemical study spanning the past 2 kyr on three ice cores from Dronning Maud Land, Antarctica: 1. Annually resolved accumulation rates, J. Geophys. Res., 105, 29411–29421, doi:10.1029/2000JD900449, 2000.
Steig, E. J., Morse, D. L., Waddington, E. D., Stuiver, M., Grootes, P. M., Mayewski, P. A., Twickler, M. S., and Whitlow, S. I.: Wis-consinan and Holocene climate history from an ice core at Taylor Dome, western Ross Embayment, Antarctica, Geogr. Ann., 82A, 213–235, 2000.
Stenni, B., Proposito, M., Gragnani, R., Flora, O., Jouzel, J., Falourd, S., and Frezzotti, M.: Eight centuries of volcanic signal and climate change at Talos Dome (East Antarctica), J. Geophys. Res., 107, 4076, doi:10.1029/2000JD000317, 2002.
Stothers, R. B.: Major optical depth perturbations to the stratosphere from volcanic eruptions: Pyrheliometric period, 1881–1960, J. Geophys. Res., 101, 3901–3920, doi:10.1029/95JD03237, 1996. Stothers, R. B.: Major optical depth perturbations to the stratosphere from volcanic eruptions: Stellar extinction period, 1961–1978, J. Geophys. Res., 106, 2993–3003, doi:10.1029/2000JD900652, 2001.
Taylor, K. C., Alley, R. B., Lamorey, G. W., and Mayewski, P. A.: Electrical measurements on the Greenland Ice Sheet Project 2 core, J. Geophys. Res., 102, 26511–26517, 1997.
Timmreck, C., Lorenz, S. J., Crowley, T. J., Kinne, S., Raddatz, T. J., Thomas, M. A., and Jungclaus, J. H.: Limited temperature response to the very large AD1258 volcanic eruption, Geophys. Res. Lett., 36, L21708, doi:10.1029/2009GL040083, 2009. Traufetter, F., Oerter, H., Fischer, H., Weller, R., and Miller, H.:
Spa-tiotemporal variability in volcanic sulphate deposition over the past 2 kyr in snow pits and firn cores from Amundsen, Antarctica, J. Glaciol., 50, 137–146, doi:10.3189/172756504781830222, 2004.
Olsen, J., and Heinemeier, J.: A synchronized dating of three Greenland ice cores throughout the Holocene, J. Geophys. Res., 111, D13102, doi:10.1029/2005JD006921, 2006.