R E S E A R C H A R T I C L E
Open Access
Lineage relationship of prostate cancer cell types
based on gene expression
Laura E Pascal
1,2,3, Ricardo ZN Vêncio
4, Robert L Vessella
1, Carol B Ware
2,5, Eneida F Vêncio
6, Gareth Denyer
7and
Alvin Y Liu
1,2*Abstract
Background:Prostate tumor heterogeneity is a major factor in disease management. Heterogeneity could be due to multiple cancer cell types with distinct gene expression. Of clinical importance is the so-called cancer stem cell type. Cell type-specific transcriptomes are used to examine lineage relationship among cancer cell types and their expression similarity to normal cell types including stem/progenitor cells.
Methods:Transcriptomes were determined by Affymetrix DNA array analysis for the following cell types. Putative prostate progenitor cell populations were characterized and isolated by expression of the membrane transporter ABCG2. Stem cells were represented by embryonic stem and embryonal carcinoma cells. The cancer cell types were Gleason pattern 3 (glandular histomorphology) and pattern 4 (aglandular) sorted from primary tumors, cultured prostate cancer cell lines originally established from metastatic lesions, xenografts LuCaP 35
(adenocarcinoma phenotype) and LuCaP 49 (neuroendocrine/small cell carcinoma) grown in mice. No detectable gene expression differences were detected among serial passages of the LuCaP xenografts.
Results:Based on transcriptomes, the different cancer cell types could be clustered into a luminal-like grouping and a non-luminal-like (also not basal-like) grouping. The non-luminal-like types showed expression more similar to that of stem/progenitor cells than the luminal-like types. However, none showed expression of stem cell genes known to maintain stemness.
Conclusions:Non-luminal-like types are all representatives of aggressive disease, and this could be attributed to the similarity in overall gene expression to stem and progenitor cell types.
Background
Tumor heterogeneity is a major hurdle in effective treat-ment of the disease. This heterogeneity could be due to multiple cancer cell types with distinct gene expression. How do these cell types arise? The cancer stem cell hypothesis states that tumors are propagated by cancer cells with stem-cell characteristics, and that tumor het-erogeneity results from differentiation of these stem-like cells. Tumors from several tissue types have been found to contain specific populations of tumorigenic and non-tumorigenic cells. Breast tumor formation can be initiated by a small number of tumorigenic cells charac-terized as CD44+CD24lo/-, while non-tumorigenic cells
are CD44-CD24+. The latter could be generated from
the former during tumor growth [1]. Tumorigenicity is assayed by xenograft implantation and tumor expansion in immune-compromised hosts. In leukemia, tumori-genic cells share a phenotype of CD34+CD38-with nor-mal hematopoietic stem cells [2]. Tumorigenic or cancer stem cells that are typed CD133+CD44+CD49b+CD29+ have also been reported for prostate tumors [3]. To date, these cluster designation (CD) cell surface mole-cules are the principal markers used to qualify these tumorigenic cells as cancer stem cells, and the fact these cells can apparently undergo differentiation to produce other types.
Prostate cancer is a common cancer in men in the Wes-tern countries, and the second leading cause of cancer mortality [4]. Why the human prostate is prone to devel-oping cancer and what the molecular mechanism of the disease process remain unanswered. In prostate develop-ment, epithelial differentiation is mediated by stromal
* Correspondence: [email protected]
1Department of Urology University of Washington, Seattle, WA 98195, USA
Full list of author information is available at the end of the article
mesenchyme induction of stem cells [5]. Thus, epithelial elements containing stem/progenitor cells isolated from either the prostate or the bladder can be induced by pro-static stromal cells to produce only prostate-like structures [6]. Presumably, bladder stromal cells would induce blad-der-like structures instead if that experiment was done. This induction could be defective in cancer due to abnor-mal gene expression by the tumor-associated stroabnor-mal cells [7]. The lack of appropriate stromal signaling may lead to abnormal epithelial differentiation giving rise to diseases like cancer. The alternative is that a cancer stem cell emerges after accumulating enough critical somatic DNA mutations over time, and this then differentiates into can-cer epithelial cells (and perhaps the cancan-cer-associated stro-mal cells as well).
In this report, we used cell type-specific transcrip-tomes obtained in our lab to examine possible lineage relationship between prostate cancer cell types and nor-mal cell types including that of stem/progenitor. Our goal was to determine the extent of stem-cell gene expression not only of the CD molecules but also of all others in cancer, and to see how this gene expression was correlated with tumor biology. The cancer cell types included prostate cancer cell lines LNCaP, C4-2, CL1, PC3, DU145, tumor xenografts LuCaP 35 and LuCaP
49, CD26+ Gleason pattern 3 (G3) and pattern 4 (G4)
cancer cells isolated from primary tumors [8]. G3 cancer cells are typical of well-differentiated tumors showing glandular histoarchitecture, while G4 cancer cells are of tumors without glandular differentiation [9]. Tumors with a significant component of G4 are associated with poor outcome. The in vitro cultured cell lines were established from metastasis: lymph node for LNCaP, bone for PC3 and brain for DU145 [10]. C4-2 and CL1 were derived from LNCaP through selection in castrated animals and androgen-depleted growth media, respec-tively. The in vivo maintained LuCaP 35 was derived from a lymph node metastasis and shows features of a prostate-specific antigen (PSA/KLK3)-producing adeno-carcinoma [11]. LuCaP 49 was established from an omentum metastasis and shows features of a PSA non-producing neuroendocrine small cell carcinoma [12]. Thus, a wide spectrum of this disease is covered by these different cell types. In this analysis, stem cell types were represented by the embryonal carcinoma (EC) cell line NCCIT (hyperdiploid, established from a nonsemi-nomatous germ cell tumor) [13], and embryonic stem (ES) cell line H1 (WA01, karyotype 46, XY) [14]. EC and ES cells have been shown to have very similar gene expression [15], and are stained positive for stem cell-specific alkaline phosphatase. We have reported that NCCIT could undergo differentiation with loss of stem cell markers, growth retardation, and altered morphol-ogy under the influence of either prostate or bladder
stromal cells in co-culture [16]. Non-cancer cell types
were represented by sorted CD26+ luminal epithelial,
CD104+ basal epithelial, CD49a+ stromal smooth
mus-cle, CD31+ endothelial cells [17], and prostate cell popu-lations identified and isolated by their expression of the transmembrane ATP-binding cassette transporter
ABCG2 [18]. Isolation of ABCG2+cells was done either
by the use of anti-ABCG2/CDw338 monoclonal in mag-netic cell sorting (MACS) or via flow cytometry of side populations. Side populations are due to the ability of ABCG2 to efflux a DNA dye (which ABCG2-negative cells in the main population cannot), and bone marrow side populations are enriched for marrow graft repopu-lating stem cells. The ABCG2+cells were used to repre-sent adult organ progenitor cells of the prostate whereas ES and EC cells were of germ cells. All transcriptome datasets are available on our public database UESC [19], which is also incorporated in the NCI-EDRN (Early Detection Research Network) website. Data quality of Affymetrix-derived transcriptomes was assessed for cor-respondence between array hybridization signals of CD genes and CD immunostaining results [20]. In general, there was a good fit between the two data types, i.e., immunostained cell types showed array hybridization signals for the corresponding CD genes. For lineage relationship, we employed a principal components ana-lysis of array datasets to characterize the relatedness between cell types as defined by their transcriptomes, i. e., the entire repertoire of expressed genes.
Materials and methods
Prostate cancer cell lines and xenografts
DNA array analysis
Quality and concentration of RNA prepared from cells or xenografts were determined by Agilent 2100 Bioana-lyzer and RNA Labchip (Agilent Technologies, Santa Clara, CA). Human Genome U133 Plus 2.0 GeneChips (Affymetrix, Santa Clara, CA) were used for expression profiling. The U133 array contained probesets represent-ing 54,675 genes, splice variants, and ESTs. The Gene-Chips were prepared, hybridized, and scanned according to the protocols provided by Affymetrix (P/N 702232 Rev. 2) [23]. RNA prepared from LuCaP 35, LuCaP 49 and H1 were reverse transcribed with poly (dT)/T7 pro-moter primer, and the cDNA was made double-stranded. In vitro transcription was performed with bio-tinylated ribonucleotides, and the biotin-labeled cRNA was hybridized to the GeneChips. The chips were washed and stained with streptavidin-PE using FS-450 fluidics station (Affymetrix). Data was collected with Affymetrix GeneChip Scanner 3000. All five samplings of each xenograft at different passages were analyzed.
Prostate cell type-specific transcriptomes
Previously determined cell type-specific transcriptomes were downloaded from UESC [19]. The sorted cell populations were isolated from prostate tissue speci-mens obtained from patients undergoing radical prosta-tectomy [8,17,18]. Both cancer and non-cancer samples were digested by collagenase for cell isolation by MACS.
Transcriptomes were obtained for CD104+basal, CD26+
luminal, CD49a+ stromal, CD31+ endothelial, ABCG2+
(5D3) or side-population (SP) progenitor, CD26+ cancer cells of Gleason 3+3 (G3) and 4+4 (G4) primary tumors. Transcriptomes were also available for the prostate can-cer cell lines LNCaP, C4-2, CL1, DU145, PC3 as well as those of NCCIT and H1.
Computational analysis of datasets
For differential gene expression, datasets were analyzed by HTself, a self-self based statistical method for low replication microarray data, specifically those obtained from isolated cancer cell types [8]. To apply this method, all possible combination of pair-wise compari-sons among experiments were taken to create sets of ratios. Gene expression level was defined as the normal-ized and summarnormal-ized intensities of each GeneChip
pro-beset, and was presented as its logarithmic value: X =
log2(Normalized intensity). This step was carried out using the standard robust multi-array average (RMA) method [25], implemented in the analysis pipeline SBEAMS [26]. The strength of differential expression
between any pair of experiments was estimated by Mi=
log2(ratio) =Xi-Xa, where arepresented one particular
cell type and i represented each given cell type in the set. A probeset was considered significantly differentially
expressed if at least 80% of its log-ratio combinations were outside the 99.9% credibility intensity-dependent cutoff. Moreover, an average greater than 8-fold differ-ence in expression level was chosen.
In principal components analysis (PCA) of the tran-scriptome datasets, a gene expression subspace was obtained that highlighted the principal sources of varia-bility among transcriptomes of the different prostate cell types. This space was created with transcriptomes of the four cell types isolated from the prostate: luminal L, basal B, stromal S and endothelial E. A rotation matrix was obtained by using averages ofXL, XB,XS, andXE, and these were plotted as projections on the principal compo-nents graph (see Supplemental File 1, http://labpib.open-wetware.org/PCA.html). The other transcriptomes were then projected into this PCA-generated subspace, which could be rotated freely to visualize spatial separation of the individual datapoints denoting the cell types. The
fol-lowing datasets were thus analyzed: CD26+ luminal,
CD49a+ stromal, CD104+ basal, CD31+ endothelial,
ABCG2+progenitor (5D3), SP, CD26+G3 cancer, CD26+
G4 cancer, LNCaP, C4-2, CL1 (and subclones), DU145, PC3, LuCaP35, LuCaP49, NCCIT and H1.
Results
Relatedness between prostate progenitor cells and stem cells
The prostate SP was isolated due to its slower uptake of Hoechst 33342 due to ABCG2. SP was collected from cells pre-selected by MACS using anti-CD44 since ABCG2+cells were detected in the CD44+ basal epithe-lium of the prostate. They constituted a minor popula-tion (< 1%) and differed from ABGC2+endothelial cells of capillaries by expression of the basal marker CD138/
SDC1 [18]. In addition to SP, the ABCG2+ cells were
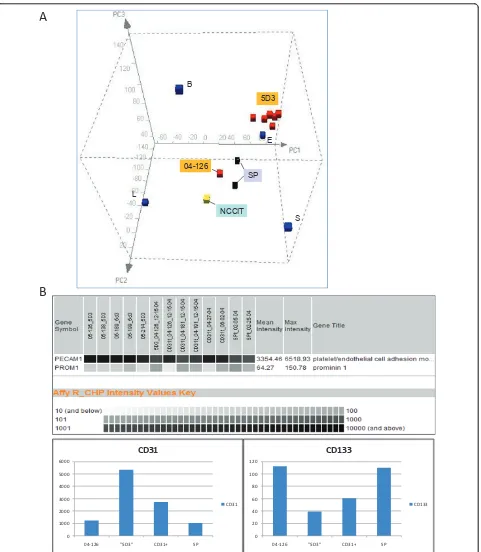
sorted from sizable benign tissue specimens using the ABCG2 antibody clone 5D3, and labeled as 5D3 popula-tions [18]. Figure 1A shows a PCA subspace defined by the transcriptomes of basal, luminal, stromal, and endothelial. These four differentiated cell types are dis-tinct in gene expression, and are widely separated in this three dimensional plot. The distance between any two datapoints is a measure of the extent of differential gene expression. Transcriptomes of the SP and 5D3
cells were then projected into this “human prostate”
PCA subspace plus the transcriptome of NCCIT used as that of human pluripotent stem cells.
First, a majority of 5D3 cell sorts were clustering near the endothelial cells. In our sorting scheme, CD31/ PECAM1 antibody was first used as a means to purge
CD31+ABCG2+ endothelial cells in the tissue digests
before sorting by the 5D3 antibody. However, significant amounts of any residual endothelial cells in the
E
NCCIT
B
L
S
04-126
SP 5D3
0 1000 2000 3000 4000 5000 6000
04-126 "5D3" CD31+ SP CD31
CD31
0 20 40 60 80 100 120
04-126 "5D3" CD31+ SP CD133
CD133
A
B
skew the expression profile towards E given the rarity of progenitor cells. Nevertheless, one particular 5D3 popu-lation obtained from specimen 04-126, plotted closer to NCCIT apart from the other 5D3 sorts, might represent a progenitor population with less endothelial contamina-tion. The array signal intensity value for the CD31 gene in 04-126 was 1235 compared to 5336 (average of five) for the other 5D3 populations, 2719 (average of five) for the CD31-sorted endothelial populations, and 1049 (average of two) for SP. The signal value for CD133 in 04-126 was 113 compared to 40 for the other 5D3 sorts and 61 for the CD31 sorts, and 110 for SP (Figure 1B). For the expression of these two markers, the 5D3 of 04-126 and SP were similar, and both populations (isolated by different methodologies) were found plotted near the EC cells. Some of the differences could be attributed to genes involved in cell proliferation since the EC cells were harvested from in vitro cultures. Second, although ABCG2+ cells and basal cells share CD specificities (e.g., CD44, CD49f, CD138), the 04-126/SP cluster was distal
from the ABCG2- basal B signifying that the overall
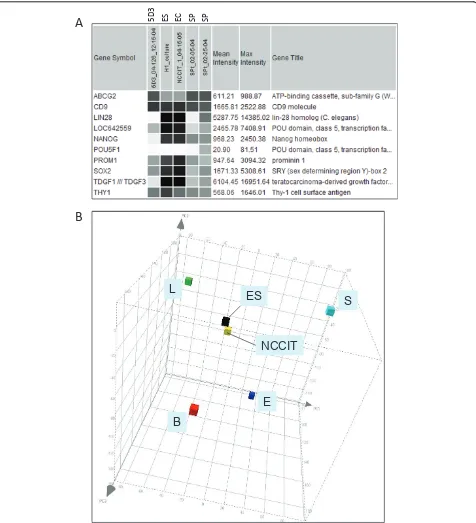
gene expression was significantly different between these cell types. Based on this transcriptome analysis, basal cells did not appear to represent a possible progenitor population of secretory cells, which was postulated by some investigators (see ref. [27]), by showing less gene expression overlap with EC cells than the ABCG2+cells. Dataset comparison was carried out between SP, 5D3 (04-126) and EC, ES. The expression pattern of several genes in these populations is shown in Figure 2A. First, note the similarity between EC and ES cells in the expres-sion levels of stem cell markers SOX2, LIN28, NANOG, POU5F1/LOC642559, TDGF1 (CRIPTO) and PROM1 (CD133). In addition, stem cell marker could also be con-sidered for CD9 [28] and THY1 (CD90) [29]. Figure 2B shows the proximity of ES (H1) and EC (NCCIT) in gene expression by PCA. For POU5F1 (OCT4), two Affymetrix probesets (235842_at, 238997_at) produced no signal while two others, LOC642559 (210265_x_at) and LOC645682 (210905_x_at), gave strong signals. Both SP and 5D3 cells showed low expression levels of these stem cell genes. NCCIT was negative for ABCG2 expression [18], so were the ES cells in contrast to SP and 5D3, which were obtained based on ABCG2 expression. Despite these differences, the overall gene expression of the 5D3 and SP populations was more similar to that of stem cells than to any of the differentiated cell types (i.e., L, S, B, E) as indi-cated by PCA. There were 13,413 genes with signal inten-sity values > 100 expressed in common by all three (> 80%); 15,899 between ES and EC; 14,404 between ES and 5D3; 14,913 between EC and 5D3. The common pool for SP and ES/EC was 13,122, and 16,300 between 5D3 and SP. Accordingly, the PCA display could be viewed as a cell differentiation space in which the undifferentiated stem/
progenitor cells appeared to occupy a more interior posi-tion and the differentiated cell types were posiposi-tioned towards the periphery. Relatedness between cell types was indicated by the separation of the datapoints. Thus, the gene expression difference between the epithelial cell types (luminal and basal) was almost as large as that between epithelial and stromal cells. These three prostate cell types have their individual complement of CD molecules [30].
2. Prostate cancer cell types as defined by transcriptome
The cancer cell types analyzed were cells sorted from tumor tissue specimens, cancer cell lines cultured in vitro, and xenografts grown in vivo. Array results for the LuCaP xenografts at various passages showed minimal gene expression changes during serial transplantation in mice, from p64 to p99 for LuCaP 35 and p40 to p59 for LuCaP 49. There was no evidence in enrichment of CD stem cell markers over time, e.g., CD44 in LuCaP 35 (Figure 3). These tumor cells appeared to maintain their expression profile during long-term growth as indicated by the relative array signal levels of the genes in Figure 3. Dataset query confirmed that LuCaP 49 was negative for androgen receptor (AR), KLK3, whereas LuCaP 35 was positive for these two markers. Furthermore, data
query showed that LuCaP 49 was CD57+ (B3GAT1; a
marker associated with cells showing neuroendocrine differentiation), CD44-, CD107b+ (LAMP2, expressed by many prostate cancer cell types [31]), CD10-, CD133+; LuCaP 35 was CD57-, CD44-, CD107b+, CD10+, CD133 -. These CD reactivities had been verified by flow cyto-metry analysis and immunostaining [12,32].
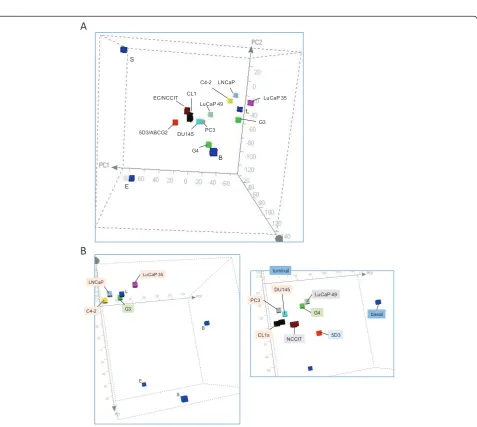
The PCA plot shown in Figure 4A incorporated the transcriptomes of LNCaP, C4-2, CL1, PC3, DU145, LuCaP 35, LuCaP 49, G3 cancer (specimen 05-179) and G4 cancer (specimen 08-032), plus NCCIT as a cancer stem cell type. For the cell lines, C4-2 was derived from LNCaP, and their transcriptomes have been shown by us to be very similar with 90% of the genes detected [23], and this was indicated by PCA. One notable
differ-ence was CD26 (Table 1). A small CD26+ population
could be detected and expanded after CD26 sorting
from overall CD26-LNCaP cultures. This subpopulation
could be related to the CD26+ C4-2 [32]. This result
cells. The CD44-CD133-LuCaP 35 could be propagated in mice equally successfully as the CD44-CD133+LuCaP 49, although whether small numbers of these tumor cells could form tumors has not been tested. LuCaP 35, like LNCaP, was derived from a lymph node metastasis.
Thus, not surprisingly, the CD10+ LNCaP, C4-2, and
LuCaP 35 were positioned near each other; LuCaP 35 and LNCaP were not exactly alike. LuCaP 49, being a neuroendocrine tumor type, was quite unlike any other in PCA. The G4 was also unlike any other. For the
EC
ES
5D
3
SP SP
A
B
NCCIT
ES
L
S
E
B
LuCaP 49
LuCaP 35
Figure 3LuCaP xenograft gene expression. Displayed are the expression patterns of selected genes (listed in the first column) in the two LuCaP xenografts with individual datasets identified by their passage numbers p.
A
B
EC/NCCIT
5D3/ABCG2 CL1
DU145 PC3 LuCaP 49
LNCaP
LuCaP 35
G3 C4-2
G4
L
B
E S
LNCaP
C4-2 G3
LuCaP 35
L
E
S B
LuCaP 49 PC3
DU145
G4
CL1s
NCCIT 5D3
basal luminal
primary tumor cells, G3 was plotted closer to luminal L than G4, not unexpected since tumors with G4 cells do not display a glandular morphology. The small separa-tion for G3 and L amounted to ~200 genes with > 8-fold difference in expression between the two [8]. The G3 cancer could be described as luminal-like. Luminal-like is here intended to mean that the cancer transcrip-tome is like that of luminal cells, i.e., luminal and G3
cells share many genes. In contrast, G4 and luminal cells share far fewer genes.
In PCA, a subgrouping can be seen for G3, LNCaP, C4-2 and LuCaP 35 about L (Figure 4B, left panel). Unlike the other three, the G3 cancer was immunotyped as CD10 negative (luminal is positive) [8]. Again, this analysis did not account for the genes involved in cellu-lar proliferation, an important difference between sorted cells and cultured cell. A second subgrouping contained G4, CL1, DU145, PC3 and LuCaP 49 (Figure 4B, right panel). The 5D3 progenitor cell type could also be included in it. This subgrouping was positioned closer to the stem cell domain with CL1, PC3 and DU145 occupying a sub-domain. One may consider that G4 cells could represent a less differentiated cell type (i.e., closer to stem/progenitor) in the luminal epithelial line-age than G3 cells. These less luminal-like more stem-like cancer cell types are generally considered to have a higher malignant potential and represent advanced dis-eases. Outside some shared CD molecules, their overall gene expression was quite dissimilar to basal cells as well. The two groupings could be labeled as luminal-like and non-luminal-like (Table 2).
3. Candidate prostate cancer stem cells
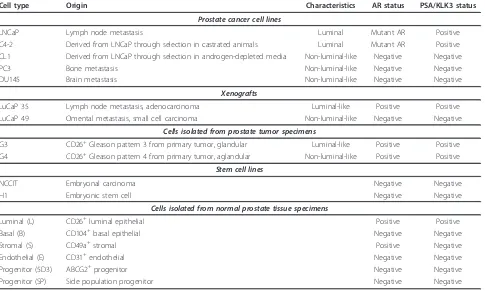
Like 5D3 and SP cells, the different non-luminal-like prostate cancer cell types showed little expression of Table 1 Cancer cell CD phenotyping
Cell type CD57 CD44 CD107b CD10 CD133 CD26
Luminal + - + + - +
Basal - + -/+ - -
-5D3 - + -/+ - +
-G3 + - + - - +
G4 + - + - - +
LNCaP - - + + -
-C4-2 - - + + - +
CL1 - + + - - +
DU145 - + + - -
-PC3 - + + - - +
LuCaP35 - - + + -
-LuCaP49 + - + - +
-Non-luminal-like types are all representatives of aggressive disease, and this could be attributed to the similarity in overall gene expression to stem and progenitor cell types.
Table 2 Prostate cells, stem cells, cancer cell lines and xenografts
Cell type Origin Characteristics AR status PSA/KLK3 status
Prostate cancer cell lines
LNCaP Lymph node metastasis Luminal Mutant AR Positive
C4-2 Derived from LNCaP through selection in castrated animals Luminal Mutant AR Positive CL1 Derived from LNCaP through selection in androgen-depleted media Non-luminal-like Negative Negative
PC3 Bone metastasis Non-luminal-like Negative Negative
DU145 Brain metastasis Non-luminal-like Negative Negative
Xenografts
LuCaP 35 Lymph node metastasis, adenocarcinoma Luminal-like Positive Positive LuCaP 49 Omental metastasis, small cell carcinoma Non-luminal-like Negative Negative
Cells isolated from prostate tumor specimens
G3 CD26+Gleason pattern 3 from primary tumor, glandular Luminal-like Positive Positive
G4 CD26+Gleason pattern 4 from primary tumor, aglandular Non-luminal-like Positive Positive
Stem cell lines
NCCIT Embryonal carcinoma Negative Negative
H1 Embryonic stem cell Negative Negative
Cells isolated from normal prostate tissue specimens
Luminal (L) CD26+luminal epithelial Positive Positive
Basal (B) CD104+basal epithelial Negative Negative
Stromal (S) CD49a+stromal Positive Negative
Endothelial (E) CD31+endothelial Negative Negative
Progenitor (5D3) ABCG2+progenitor Negative Negative
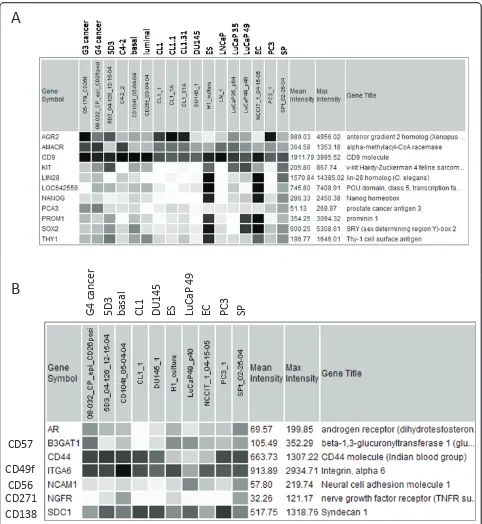
LIN28, POU5F1, NANOG, SOX2 (Figure 5A). This was not unexpected for the luminal-like types. The cancer cells (except LuCaP49) could be distinguished by their expression of any one of the cancer genes AMACR, PCA3, AGR2; their expression levels were variable. LuCaP 49 had signals for KIT (CD117) and SOX2 in
addition to PROM1. Both 5D3 and SP also showed expression of KIT. A single cell type with this marker was reported to be capable of generating a prostate [33]. Figure 5B shows the expression pattern of several other genes in these cancer cell types. Except for G4, AR expression was minimal in the other non-luminal-like
A
B
PC3
EC
LuCaP 49
ES
DU145
CL1
basal
5D
3
G4 c
ancer
SP
CD57
CD49f
CD56
CD271
CD138
types and the progenitor cells. CD44, CD49f, CD271, CD138 are basal cell markers, and some could be detected in the cancer cells. Note the lower expression of CD44, by comparison, in the ES and EC cells. LuCaP 49 showed markers of neuroendocrine differentiation CD56 and CD57, and was unique in that regard.
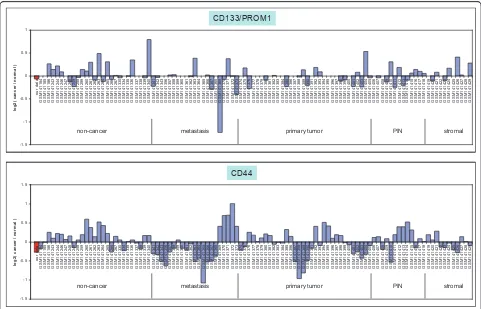
To gauge the frequency of CD44-positive or CD133-positive prostate tumors, a large publicly available prostate
cancer dataset [34] was queried. The CD44-CD133-G3
cancer transcriptome was included for comparison (Figure 6). As can be seen, cancer expression of CD133 in these laser-capture microdissected tumor cell specimens was very infrequent. There was more cancer CD44 expression in both primary tumors and metastases. Low frequencies of tumors positive for CD133 (< 1% primary, < 4% bone metastasis) and CD44 (< 10% metastasis) by immunostain-ing were recently reported by Eatonet al. [35]. CD44 and CD133 expression detected in non-cancer could be due to basal or other cell types as total prostate RNA was used as non-cancer in that analysis [34].
Discussion
Transcriptome comparison between prostate cancer cells isolated from a Gleason 3+3 tumor and normal cell types
has shown relatedness between CD26+cancer and CD26+
luminal cells [8]. Gleason pattern 3 cells are thought to represent the disease at an early, well-differentiated, stage. Several possibilities could account for the luminal-like cancer phenotype. One, cancer cells may originate from a human equivalent of the so-called bipotent castration-resistant Nkx3.1-positive mouse luminal cell type (CARN) upon loss of Pten function [36]. Two, cancer cells may arise from a human equivalent of the Cd49f-positive mouse basal cell type under the influence of activated Akt, Fgf10, Erg1 and Ar. The resultant cancer cells would show a luminal phenotype as basal cells are the progenitors of secretory cells [37]. Three, cancer cells may result from luminal differentiation of a neoplastic progenitor-like cell type containing genetic alterations such as the TMPRSS2: ERG fusion [38]. ERG1 was one of the genes with increased expression in this G3 cancer cell type [8], and its expression could result from a gene fusion event placing it under the control of the androgen regulated TMPRSS2 [39]. This tumor-initiating cell type could, as postulated, both renew and propagate tumor formation. These models and others (e.g., the TRAMP mouse engineered with an activatable SV40 T antigen [40]) of prostate carcinogenesis invariably involve oncogene activation. An alternative to
CD44 -1.5 -1 -0.5 0 0.5 1 1.5 ou r dat a G S M141 184 GS M 14 11 85 GS M 14 11 86 GS M 14 12 43 GS M 14 12 44 G S M141 24 6 GS M 14 12 47 G S M1 412 48 G S M 141 24 9 GS M 14 12 58 GS M 14 12 59 GS M 14 12 60 G S M141 261 GS M 14 12 62 G S M1 41 263 GS M 14 12 64 GS M 14 12 65 GS M 14 12 66 GS M 14 12 67 G S M141 330 G S M141 33 4 GS M 14 13 35 GS M 14 13 36 G S M 141 33 7 G S M141 338 GS M 14 13 39 G S M1 41 340 G S M141 341 GS M 14 13 42 GS M 14 13 43 GS M 14 13 56 G S M141 357 G S M141 35 8 GS M 14 13 59 GS M 14 13 60 G S M 141 36 1 G S M141 36 2 GS M 14 13 63 G S M1 41 364 G S M141 365 GS M 14 13 66 GS M 14 13 67 GS M 14 13 68 G S M141 369 G S M141 37 0 GS M 14 13 71 G S M1 413 72 GS M 14 13 73 G S M141 37 4 GS M 14 13 75 G S M1 413 76 G S M141 377 GS M 14 13 78 G S M1 41 379 GS M 14 13 80 G S M141 381 GS M 14 13 82 GS M 14 13 83 G S M141 384 GS M 14 13 85 GS M 14 13 86 GS M 14 13 87 G S M1 413 88 G S M141 38 9 GS M 14 13 90 G S M1 41 391 G S M 141 39 2 GS M 14 13 93 GS M 14 13 94 G S M1 41 395 G S M141 396 GS M 14 13 97 GS M 14 13 98 GS M 14 13 99 G S M141 400 G S M141 40 1 GS M 14 14 02 G S M1 41 403 G S M 141 40 4 GS M 14 14 05 GS M 14 14 06 G S M1 41 407 G S M141 408 GS M 14 14 09 GS M 14 14 10 GS M 14 14 11 GS M 14 14 12 G S M141 41 3 GS M 14 14 14 G S M1 414 15 G S M 141 41 6 GS M 14 14 17 GS M 14 14 18 G S M 141 41 9 G S M141 420 GS M 14 14 21 G S M1 41 422 GS M 14 14 23 GS M 14 14 24 GS M 14 14 25 GS M 14 14 26 G S M141 427 GS M 14 14 28 GS M 14 14 29 lo g 2( c an ce
r / n
o
rm
al
)
CD44
non-cancer metastasis primary tumor PIN stromal
PROM1 -1.5 -1 -0.5 0 0.5 1 ou r dat a G S M141 184 GS M 14 11 85 GS M 14 11 86 GS M 14 12 43 GS M 14 12 44 G S M141 24 6 GS M 14 12 47 G S M1 412 48 G S M 141 24 9 GS M 14 12 58 GS M 14 12 59 GS M 14 12 60 G S M141 261 GS M 14 12 62 G S M1 41 263 GS M 14 12 64 GS M 14 12 65 GS M 14 12 66 GS M 14 12 67 G S M141 330 G S M141 33 4 GS M 14 13 35 GS M 14 13 36 G S M 141 33 7 G S M141 338 GS M 14 13 39 G S M1 41 340 G S M141 341 GS M 14 13 42 GS M 14 13 43 GS M 14 13 56 G S M141 357 G S M141 35 8 GS M 14 13 59 GS M 14 13 60 G S M 141 36 1 G S M141 36 2 GS M 14 13 63 G S M1 41 364 G S M141 365 GS M 14 13 66 GS M 14 13 67 GS M 14 13 68 G S M141 369 G S M141 37 0 GS M 14 13 71 G S M1 413 72 GS M 14 13 73 G S M141 37 4 GS M 14 13 75 G S M1 413 76 G S M141 377 GS M 14 13 78 G S M1 41 379 GS M 14 13 80 G S M141 381 GS M 14 13 82 GS M 14 13 83 G S M141 384 GS M 14 13 85 GS M 14 13 86 GS M 14 13 87 G S M1 413 88 G S M141 38 9 GS M 14 13 90 G S M1 41 391 G S M 141 39 2 GS M 14 13 93 GS M 14 13 94 G S M1 41 395 G S M141 396 GS M 14 13 97 GS M 14 13 98 GS M 14 13 99 G S M141 400 G S M141 40 1 GS M 14 14 02 G S M1 41 403 G S M 141 40 4 GS M 14 14 05 GS M 14 14 06 G S M1 41 407 G S M141 408 GS M 14 14 09 GS M 14 14 10 GS M 14 14 11 GS M 14 14 12 G S M141 41 3 GS M 14 14 14 G S M1 414 15 G S M 141 41 6 GS M 14 14 17 GS M 14 14 18 G S M 141 41 9 G S M141 420 GS M 14 14 21 G S M1 41 422 GS M 14 14 23 GS M 14 14 24 GS M 14 14 25 GS M 14 14 26 G S M141 427 GS M 14 14 28 GS M 14 14 29 log2 ( ca nc er / nor ma l ) CD133/PROM1
non-cancer metastasis primary tumor PIN stromal
this involves cell-cell signaling. Cancer differentiation takes place because tumor-associated stromal cells are function-ally defective due to their down-regulated expression of certain organ-restricted genes and genes in smooth muscle cell differentiation [7]. Stromal cells in normal tissue are characterized as smooth muscle cells. Organ-specific stro-mal induction of epithelial differentiation could be attribu-ted to the genes differentially expressed between prostate and, say, bladder stromal cells. Stem/progenitor cells dif-ferentiate in response to the cues provided by the stromal elements. In this model, a prostate cancer stem cell type is not required. As these cues from tumor-associated stromal cells are different, functional luminal differentiation can-not be achieved resulting, for example, in the absent expression of luminal CD10 and CD13 [8]. These mem-brane peptidase enzymes are likely important in proces-sing signaling protein/peptide molecules. Furthermore, depending on the extent of stromal defect, different cancer cell types, e.g., G3 or G4, may arise. Our study with co-cultures of tumor-associated stromal cells and NCCIT has shown difference in the induced gene expression of treated NCCIT cells by these stromal cells compared to that by normal tissue stromal cells [41].
Compared to the luminal-like types, the non-lumi-nal-like cancer cells show less features of secretory dif-ferentiation such as decreased expression of KLK3 and AR, and expression of markers associated with more primitive cell types. This is supported by the “
migra-tion” of their transcriptomes away from luminal
towards stem/progenitor. Some have gained perhaps certain functional properties of stem cells, which was reported for PC3 [42] and DU145 [43]. Whether they would show response to stromal induction is yet to be demonstrated with full transcriptome analysis. As hor-mone influence plays an important role in prostate cytodifferentiation [5], lack of androgen may also lead to increased expression of progenitor cell markers (CD133, CD44, CD117, ABCG2) in cancer cells [44]. However, based on our data analysis and data reported in the literature, stem cell marker expression in pros-tate cancer cells appears haphazard. Some markers, for example, like CD49f/ITGA6 could be detected fre-quently in metastases while others like nestin could not [35]. Thus, there is no hard evidence for the exis-tence of a cancer stem cell type with gene expression similar to ES (or EC) cells in prostate cancer. Based on overall gene expression, the closest appears to be the trio of PC3, DU145 and CL1.
In breast cancer, a luminal-type is also known, and a basal-type has been described to be more aggressive than the luminal-type [45]. Although a number of basal CD molecules are found, none of the prostate cancer cell types show similarity to basal cells in gene
expression. Basal cells, and not luminal cells, can be cul-tured and transformed into immortalized cell lines. Many experiments have used these cells as a model for normal prostate epithelial cells. They can be induced by carcinoma-associated fibroblasts (CAF) to produce highly malignant progeny (i.e., the non-luminal type) [46]. The large transcriptome difference between basal cells and stem cells as shown by PCA suggests that basal cells are not likely to possess functional properties of stem cells. Perhaps, the expression signature of basal-derived cancer cells would turn out to be distinct from the ones analyzed here.
If a cancer stem cell is not necessarily needed for tumor development, then can a normal prostate stem cell be programmed to produce tumor cells? The exis-tence of a stem cell population in the prostate was inferred from animal studies, in which castration leads to involution of the gland, and hormone administra-tion produces recovery [47]. Androgen removal has a deleterious effect on the AR-positive luminal cells but a minimal one on the AR-negative basal cells. Pro-genitor cells that could repopulate the gland might therefore reside in the basal epithelium. Work on the epidermis estimated the stem cell population to be 10% of cells in the basal layer [48]. About 3% of the basal cells show rapid adhesion to type I collagen and have a 4-fold higher colony forming efficiency than non-adherent cells. The adherent cells also form glands in a mouse host when co-transplanted with human stromal cells [49]. The ABCG2 population as represented by the 04-126 sort could be the prostate
progenitor. These ABCG2+
CD31-CD138+ (and CD117
+
) cells were estimated to comprise about < 1% of the cells in the basal epithelium. The SP cells showed a
close gene expression to the ABGC2+ cells, and were
negative for AR expression [18]. Therefore, it is possi-ble that this cell type could give rise to either normal or cancer cell types depending on the stromal signal-ing. We are trying to determine if a cell line can be established from cells isolated by the 5D3 antibody. The technical challenge is the frequent co-isolation of endothelial cells.
Conclusions
Transcriptomics can identify luminal-like and non-lumi-nal-like prostate cancer cell types. A putative progenitor cell population could be isolated by methods based on
the expression of ABCG2. The ABCG2+ cells and the
studies, none of the cancer cell types show a basal-like gene expression signature.
Abbreviations
ABCG2: ATP-binding cassette, sub-family G (white), member 2; AMACR:α -methylacyl-CoA racemase; AGR2: anterior gradient 2; AR: androgen receptor; B: prostate basal epithelial cells; B3GAT1 (CD57):β-1,3-glucuronyltransferase 1; CD: cluster designation; CD26/DPP4: dipeptidyl peptidase 4; E: endothelial cells of blood capillaries; EC: embryonal carcinoma; ERG1: early growth response 1; ES: embryonic stem; EST: expressed sequence tag; G3: Gleason pattern 3; G4: Gleason pattern 4; ITGA6/CD49f: integrinα6; KIT/CD117:v-kit Hardy-Zuckerman 4 feline sarcoma viral oncogene homolog; L: prostate luminal epithelial cells; LAMP2/CD107b: lysosomal-associated membrane protein 2; LIN28: lin-28 homolog (C.elegans); MACS: magnetic cell sorting; MME/CD10: membrane metallo-endopeptidase; NANOG: Nanog homeobox; NCAM1/CD56: neural cell adhesion molecule 1; NGFR/CD271: nerve growth factor receptor: PCA: principal components analysis; PCA3: prostate cancer antigen 3 (non-protein coding); PECAM1/CD31: platelet/endothelial cell adhesion molecule; POU5F1/OCT4: POU class 5 homeobox 1; PROM1/CD133: prominin 1; PSA/KLK3: prostate-specific antigen/kallikrein-related peptidase 3; S: prostate stromal smooth muscle cells; SDC1/CD138: syndecan 1; SOX2: SRY (sex determining Y)-box 2; SP: side population; TDGF1: teratocarcinoma-derived growth factor 1; THY1/CD90: thymus cell antigen 1; TMPRSS2: transmembrane protease, serine 2; TRAMP: transgenic adenocarcinoma of the mouse prostate.
Acknowledgements
This research was funded by CA111244 (NCI-EDRN) and DK63630 from the National Institutes of Health. We thank Julio C.O. Garcia for performing some of the principal components analyses.
Author details
1Department of Urology University of Washington, Seattle, WA 98195, USA. 2Institute for Stem Cell and Regenerative Medicine, University of Washington,
Seattle, WA 98195, USA.3University of Pittsburgh Medical Center,
Department of Urology, Pittsburgh, PA 15232, USA.4Genetics Department,
University of São Paulo’s Medical School at Ribeirão Preto, Brazil.
5Department of Comparative Medicine, University of Washington, Seattle,
WA 98195, USA.6Department of Pathology, Federal University of Goias, Goiania, Brazil.7Department of Biochemistry, The University of Sydney,
Sydney, Australia.
Authors’contributions
LEP and AYL designed research; LEP, AYL performed research; LEP, RZNV, EFV, GD and AYL analyzed data; RLV provided the xenografts; CBW provided the ES cells; LEP and AYL wrote the manuscript with contribution from the coauthors. All authors read and approved the final manuscript.
Competing interests
The authors declare that they have no competing interests.
Received: 11 October 2010 Accepted: 23 May 2011 Published: 23 May 2011
References
1. Al-Hajj M, Wicha MS, Benito-Hernandez A, Morrison SJ, Clarke MF:
Prospective identification of tumorigenic breast cancer cells.Proc Natl
Acad Sci USA2003,100(7):3983-3988.
2. Bonnet D, Dick JE:Human acute myeloid leukemia is organized as a hierarchy that originates from a primitive hematopoietic cell.Nature
Medicine1997,3(7):730-737.
3. Collins AT, Berry PA, Hyde C, Stower MJ, Maitland NJ:Prospective identification of tumorigenic prostate cancer stem cells.Cancer Res2005,
65(23):10946-10951.
4. Greenlee RT, Murray T, Bolden S, Wingo PA:Cancer statistics, 2000.CA: A
Cancer Journal for Clinicians2000,50(1):7-33.
5. Cunha GR, Alarid ET, Turner T, Donjacour AA, Boutin EL, Foster BA:Normal and abnormal development of the male urogenital tract. Role of
androgens, mesenchymal-epithelial interactions, and growth factors.
Journal of Andrology1992,13(6):465-475.
6. Aboseif S, El-Sakka A, Young P, Cunha G:Mesenchymal reprogramming of adult human epithelial differentiation.Differentiation1999,65(2):113-118. 7. Pascal LE, Goo YA, Vencio RZ, Page LS, Chambers AA, Liebeskind ES,
Takayama TK, True LD, Liu AY:Gene expression down-regulation in CD90+
prostate tumor-associated stromal cells involves potential organ-specific genes.BMC Cancer2009,9:317.
8. Pascal LE, Vencio RZ, Page LS, Liebeskind ES, Shadle CP, Troisch P, Marzolf B, True LD, Hood LE, Liu AY:Gene expression relationship between prostate cancer cells of Gleason 3, 4 and normal epithelial cells as revealed by cell type-specific transcriptomes.BMC Cancer2009,9:452. 9. Epstein JI:An update of the Gleason grading system.J Urol2010,
183(2):433-440.
10. Sobel RE, Sadar MD:Cell lines used in prostate cancer research: a compendium of old and new lines–part 1.J Urol2005,173(2):342-359. 11. Corey E, Quinn JE, Buhler KR, Nelson PS, Macoska JA, True LD, Vessella RL:
LuCaP 35: a new model of prostate cancer progression to androgen independence.Prostate2003,55(4):239-246.
12. True LD, Buhler K, Quinn J, Williams E, Nelson PS, Clegg N, Macoska JA, Norwood T, Liu A, Ellis W,et al:A neuroendocrine/small cell prostate carcinoma xenograft-LuCaP 49.Am J Pathol2002,161(2):705-715. 13. Damjanov I, Horvat B, Gibas Z:Retinoic acid-induced differentiation of the
developmentally pluripotent human germ cell tumor-derived cell line, NCCIT.Lab Invest1993,68(2):220-232.
14. Ware CB, Nelson AM, Blau CA:A comparison of NIH-approved human ESC lines.Stem cells2006,24(12):2677-2684.
15. Sperger JM, Chen X, Draper JS, Antosiewicz JE, Chon CH, Jones SB, Brooks JD, Andrews PW, Brown PO, Thomson JA:Gene expression patterns in human embryonic stem cells and human pluripotent germ cell tumors.Proc Natl Acad Sci USA2003,100(23):13350-13355. 16. Pascal LE, Vencio RZ, Goo YA, Page LS, Shadle CP, Liu AY:Temporal
expression profiling of the effects of secreted factors from prostate stromal cells on embryonal carcinoma stem cells.Prostate2009,
69(12):1353-1365.
17. Oudes AJ, Campbell DS, Sorensen CM, Walashek LS, True LD, Liu AY:
Transcriptomes of human prostate cells.BMC Genomics2006,7:92. 18. Pascal LE, Oudes AJ, Petersen TW, Goo YA, Walashek LS, True LD, Liu AY:
Molecular and cellular characterization of ABCG2 in the prostate.BMC Urol2007,7:6.
19. Pascal LE, Deutsch EW, Campbell DS, Korb M, True LD, Liu AY:The urologic epithelial stem cell database (UESC) - a web tool for cell type-specific gene expression and immunohistochemistry images of the prostate and bladder.BMC Urol2007,7:19.
20. Pascal LE, True LD, Campbell DS, Deutsch EW, Risk M, Coleman IM, Eichner LJ, Nelson PS, Liu AY:Correlation of mRNA and protein levels: cell type-specific gene expression of cluster designation antigens in the prostate.BMC Genomics2008,9:246.
21. Freedland SJ, Pantuck AJ, Paik SH, Zisman A, Graeber TG, Eisenberg D, McBride WH, Nguyen D, Tso CL, Belldegrun AS:Heterogeneity of molecular targets on clonal cancer lines derived from a novel hormone-refractory prostate cancer tumor system.Prostate2003,55(4):299-307. 22. Freedland SJ, Seligson DB, Liu AY, Pantuck AJ, Paik SH, Horvath S,
Wieder JA, Zisman A, Nguyen D, Tso CL,et al:Loss of CD10 (neutral endopeptidase) is a frequent and early event in human prostate cancer.
Prostate2003,55(1):71-80.
23. Oudes AJ, Roach JC, Walashek LS, Eichner LJ, True LD, Vessella RL, Liu AY:
Application of Affymetrix array and Massively Parallel Signature Sequencing for identification of genes involved in prostate cancer progression.BMC Cancer2005,5:86.
24. Ellis WJ, Vessella RL, Buhler KR, Bladou F, True LD, Bigler SA, Curtis D, Lange PH:Characterization of a novel androgen-sensitive, prostate-specific antigen-producing prostatic carcinoma xenograft: LuCaP 23.Clin
Cancer Res1996,2(6):1039-1048.
25. Irizarry RA, Hobbs B, Collin F, Beazer-Barclay YD, Antonellis KJ, Scherf U, Speed TP:Exploration, normalization, and summaries of high density oligonucleotide array probe level data.Biostatistics2003,4(2):249-264. 26. Marzolf B, Deutsch EW, Moss P, Campbell D, Johnson MH, Galitski T:
27. Bonkhoff H, Remberger K:Differentiation pathways and histogenetic aspects of normal and abnormal prostatic growth: a stem cell model.
Prostate1996,28(2):98-106.
28. Oka M, Tagoku K, Russell TL, Nakano Y, Hamazaki T, Meyer EM, Yokota T, Terada N:CD9 is associated with leukemia inhibitory factor-mediated maintenance of embryonic stem cells.Mol Biol Cell2002,13(4):1274-1281. 29. Dennis JE, Esterly K, Awadallah A, Parrish CR, Poynter GM, Goltry KL:
Clinical-scale expansion of a mixed population of bone-marrow-derived stem and progenitor cells for potential use in bone-tissue regeneration.
Stem cells2007,25(10):2575-2582.
30. Liu AY, True LD:Characterization of prostate cell types by CD cell surface molecules.Am J Pathol2002,160(1):37-43.
31. Liu AY, Roudier MP, True LD:Heterogeneity in primary and metastatic prostate cancer as defined by cell surface CD profile.Am J Pathol2004,
165(5):1543-1556.
32. Liu AY, Brubaker KD, Goo YA, Quinn JE, Kral S, Sorensen CM, Vessella RL, Belldegrun AS, Hood LE:Lineage relationship between LNCaP and LNCaP-derived prostate cancer cell lines.Prostate2004,60(2):98-108. 33. Leong KG, Wang BE, Johnson L, Gao WQ:Generation of a prostate from a
single adult stem cell.Nature2008,456(7223):804-808.
34. Tomlins SA, Mehra R, Rhodes DR, Cao X, Wang L, Dhanasekaran SM, Kalyana-Sundaram S, Wei JT, Rubin MA, Pienta KJ,et al:Integrative molecular concept modeling of prostate cancer progression.Nat Genet
2007,39(1):41-51.
35. Eaton CL, Colombel M, van der Pluijm G, Cecchini M, Wetterwald A, Lippitt J, Rehman I, Hamdy F, Thalman G:Evaluation of the frequency of putative prostate cancer stem cells in primary and metastatic prostate cancer.Prostate2010,70(8):875-882.
36. Wang X, Kruithof-de Julio M, Economides KD, Walker D, Yu H, Halili MV, Hu YP, Price SM, Abate-Shen C, Shen MM:A luminal epithelial stem cell that is a cell of origin for prostate cancer.Nature2009,
461(7263):495-500.
37. Lawson DA, Zong Y, Memarzadeh S, Xin L, Huang J, Witte ON:Basal epithelial stem cells are efficient targets for prostate cancer initiation.
Proc Natl Acad Sci USA2010,107(6):2610-2615.
38. Guzman-Ramirez N, Voller M, Wetterwald A, Germann M, Cross NA, Rentsch CA, Schalken J, Thalmann GN, Cecchini MG:In vitro propagation and characterization of neoplastic stem/progenitor-like cells from human prostate cancer tissue.Prostate2009,69(15):1683-1693. 39. Tomlins SA, Rhodes DR, Perner S, Dhanasekaran SM, Mehra R, Sun XW,
Varambally S, Cao X, Tchinda J, Kuefer R,et al:Recurrent fusion of TMPRSS2 and ETS transcription factor genes in prostate cancer.Science
2005,310(5748):644-648.
40. Hurwitz AA, Foster BA, Allison JP, Greenberg NM, Kwon ED:The TRAMP mouse as a model for prostate cancer.InCurrent protocols in immunology
Edited by: John E Coligan, et al 2001,Chapter 20(Unit 20):25.
41. Pascal LE, Ai J, Vêncio RZN, Vêncio EF, Zhou Y, Page LS, True LD, Wang Z, Liu AY:Differential inductive signaling of prostate tumor-associated stromal cells compared to normal tissue stromal mesenchyme cells.
Cancer Microenvironment2011,4(1):51-59.
42. Li H, Chen X, Calhoun-Davis T, Claypool K, Tang DG:PC3 human prostate carcinoma cell holoclones contain self-renewing tumor-initiating cells.
Cancer Res2008,68(6):1820-1825.
43. Wei C, Guomin W, Yujun L, Ruizhe Q:Cancer stem-like cells in human prostate carcinoma cells DU145: the seeds of the cell line?Cancer Biology
& Therapy2007,6(5):763-768.
44. Tang Y, Hamburger AW, Wang L, Khan MA, Hussain A:Androgen deprivation and stem cell markers in prostate cancers.International
Journal of Clinical and Experimental Pathology2009,3(2):128-138.
45. Birnbaum D, Bertucci F, Ginestier C, Tagett R, Jacquemier J, Charafe-Jauffret E:Basal and luminal breast cancers: basic or luminous? (review).
Int J Oncol2004,25(2):249-258.
46. Olumi AF, Grossfeld GD, Hayward SW, Carroll PR, Tlsty TD, Cunha GR:
Carcinoma-associated fibroblasts direct tumor progression of initiated human prostatic epithelium.Cancer Res1999,59(19):5002-5011. 47. Walensky LD, Coffey DS, Chen TH, Wu TC, Pasternack GR:A novel M(r)
32,000 nuclear phosphoprotein is selectively expressed in cells competent for self-renewal.Cancer Res1993,53(19):4720-4726. 48. Slack JM:Stem cells in epithelial tissues.Science2000,
287(5457):1431-1433.
49. Collins AT, Habib FK, Maitland NJ, Neal DE:Identification and isolation of human prostate epithelial stem cells based on alpha(2)beta(1)-integrin expression.Journal of Cell Science2001,114(Pt 21):3865-3872. Pre-publication history
The pre-publication history for this paper can be accessed here: http://www.biomedcentral.com/1755-8794/4/46/prepub
doi:10.1186/1755-8794-4-46
Cite this article as:Pascalet al.:Lineage relationship of prostate cancer cell types based on gene expression.BMC Medical Genomics20114:46.
Submit your next manuscript to BioMed Central and take full advantage of:
• Convenient online submission
• Thorough peer review
• No space constraints or color figure charges
• Immediate publication on acceptance
• Inclusion in PubMed, CAS, Scopus and Google Scholar
• Research which is freely available for redistribution