R E S E A R C H
Open Access
DNA methylation signatures for 2016 WHO
classification subtypes of diffuse gliomas
Yashna Paul
†, Baisakhi Mondal
†, Vikas Patil and Kumaravel Somasundaram
*Abstract
Background:Glioma is the most common of all primary brain tumors with poor prognosis and high mortality. The
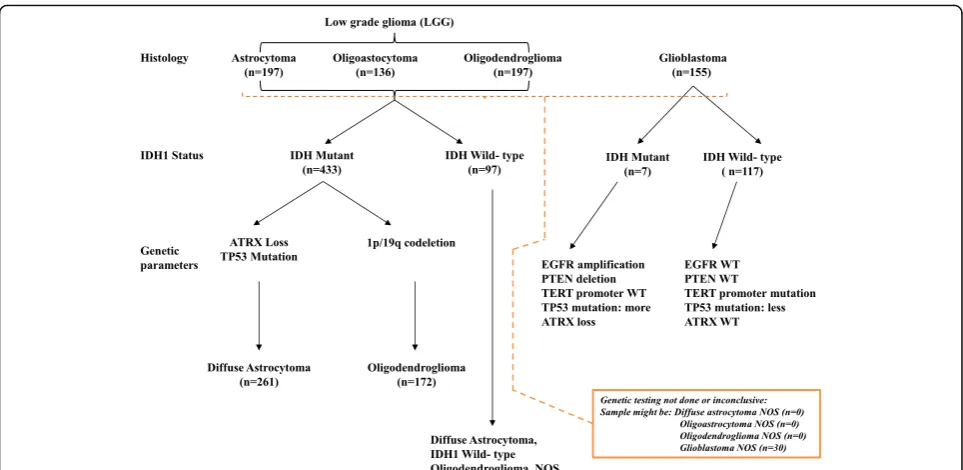
2016 World Health Organization classification of the tumors of central nervous system uses molecular parameters in addition to histology to redefine many tumor entities. The new classification scheme divides diffuse gliomas into low-grade glioma (LGG) and glioblastoma (GBM) as per histology. LGGs are further divided into isocitrate
dehydrogenase (IDH) wild type or mutant, which is further classified into either oligodendroglioma that harbors 1p/ 19q codeletion or diffuse astrocytoma that has an intact 1p/19q loci but enriched for ATRX loss and TP53 mutation. GBMs are divided into IDH wild type that corresponds to primary or de novo GBMs and IDH mutant that
corresponds to secondary or progressive GBMs. To make the 2016 WHO subtypes of diffuse gliomas more robust, we carried out Prediction Analysis of Microarrays (PAM) to develop DNA methylation signatures for these subtypes. Results:In this study, we applied PAM on a training set of diffuse gliomas derived from The Cancer Genome Atlas (TCGA) and identified DNA methylation signatures to classify LGG IDH wild type from LGG IDH mutant, LGG IDH mutant with 1p/19q codeletion from LGG IDH mutant with intact 1p/19q loci and GBM IDH wild type from GBM IDH mutant with an accuracy of 99–100%. The signatures were validated using the test set of diffuse glioma samples derived from TCGA with an accuracy of 96 to 99%. In addition, we also carried out additional validation of all three signatures using independent LGG and GBM cohorts. Further, the methylation signatures identified a fraction of samples as discordant, which were found to have molecular and clinical features typical of the subtype as identified by methylation signatures.
Conclusions:Thus, we identified methylation signatures that classified different subtypes of diffuse glioma
accurately and propose that these signatures could complement 2016 WHO classification scheme of diffuse glioma.
Keywords:Glioma, DNA methylation classification signature, IDH1/IDH2 mutation, 2016 WHO, PAM, PCA
Background
The neoplasia of non-neuronal glial cells in the brain is re-ferred to as glioma and is the most common type of pri-mary central nervous system (CNS) tumors [1]. The different histological subtypes of glioma are as follows: astrocytoma being the most common, accounting for 70% of all cases, while oligodendroglioma comprises 9% which includes classic oligodendrogliomas as well as mixed oli-goastrocytomas and ependymoma comprises 6% [2].
Over the past decades, classification of brain tumors was based on the histopathological and microscopic fea-tures in hematoxylin- and eosin-stained sections, like
cell type, level of differentiation, identifying necrotic le-sions, and presence of lineage-specific markers. Accord-ing to the WHO 2007-based classification, grade II/ diffused astrocytoma (DA) was described as low grade while high-grade glioma comprised of grade III/anaplas-tic astrocytoma (AA) and grade IV/glioblastoma (GBM) [3]. The vast majority of GBM develop de novo in eld-erly patients with no prior clinical or histological evi-dence and are referred to as primary GBM. Secondary GBM progresses through low-grade diffuse astrocytoma or anaplastic astrocytoma and is manifested in younger patients. Several studies have shown that glioma is highly heterogeneous which indicates that tumors of same grade have diverse genetic and epigenetic molecu-lar aberrations [4–9]. With the invent of new technolo-gies, many high-throughput studies have reported
* Correspondence:[email protected];[email protected]
†Equal contributors
Department of Microbiology and Cell Biology, Indian Institute of Science, Bangalore 560012, India
different molecular signatures based on glioma CpG island methylator phenotype (GCIMP), expression-based studies for mRNA, miRNA, and lncRNA in GBM [10–13]. One of the most exciting and clinically relevant observations was the discovery that a high percentage of grade II/III and grade IV secondary glioblastoma harbor mutations in the genes isocitrate dehydrogenase 1 and 2 [2]. Growing data indicate that these mutations play a causal role in gliomagen-esis, have a major impact on tumor biology, and also have clinical and prognostic importance [2].
Nearly 12% of GBM patients have been identified to have point mutation in codon 132 (R132H) of the isocitrate dehydrogenase 1 (IDH1) gene located in the chromosome locus 2q33 [14]. IDH1 codes for a cyto-solic protein that controls oxidative cellular damage [14, 15]. Several studies showed that the IDH1 muta-tion is inversely associated with grade in diffuse glial tumors, affecting 71% of grade II, 64% of grade III, and 6% of primary glioblastomas [14]. Interestingly, IDH mutation is found to be present in the secondary glioblastoma (76%) probably because these tumors have been derived from the lower grade gliomas [16]. IDH1 is an enzyme and it catalyzes the oxidative de-carboxylation of isocitrate to produce α-ketoglutarate (α-KG) [17].
IDH mutation has been shown to be associated with alterations in the methylome thus being suffi-cient to establish glioma hypermethylator phenotype [18]. At present, 2016 WHO CNS tumor classification has included both molecular markers along with histological features to identify and classify different subtypes of diffuse glioma which includes the WHO grade II and grade III astrocytic tumors, the grade II and III oligodendrogliomas, and the grade IV glio-blastomas. The low-grade gliomas (LGGs), which in-clude the WHO grade II and grade III astrocytic tumors and the grade II and III oligodendrogliomas, are classified based on IDH mutation status. The LGG IDH mutant subtype is further classified based on the codeletion of 1p/19q where LGG IDH mutant patients harboring 1p/19q codeletion is termed as oligodendrogliomas (ODG) while LGG IDH mutant patients having intact 1p/19q loci are termed as dif-fuse astrocytoma which may be enriched in TP53 mutation/ATRX loss. The other axis is the glioblast-oma (GBM) which, similar to LGG, is further classi-fied into IDH WT and mutant. The deficiency in this classification is that factors like intra-tumoral hetero-geneity and insufficient molecular information could result in our ability to classify certain samples to any specific categories. In such cases, signatures based on whole tumor studies to classify the glioma subtypes might further complement 2016 WHO classification.
In the present study, we investigated the altered methylation pattern among the different subtypes of dif-fuse gliomas as per 2016 WHO CNS tumor classification [19] and derived methylation-based classification signa-ture for distinguishing different subtypes. Our study sets up the premise of using methylation signature in com-bination to the 2016 WHO classification system with a higher precision of classification of the diffuse glioma patients, thereby helping better diagnosis and appropri-ate treatment therapy.
Result
The overall work flow of methylation-based signatures to distinguish diffuse glioma subtypes of 2016 WHO classification
To develop methylation-based signatures to distinguish diffuse glioma subtypes as per 2016 WHO CNS tumor classification (Fig. 1), we subjected the 450K DNA methylation data of The Cancer Genome Atlas (TCGA) diffuse glioma samples (https://cancergenome.nih.gov/) to various statistical tools and validation steps (Fig. 2). The methylation signatures were developed to distin-guish LGG IDH mutant from LGG IDH WT, LGG IDH mutant with 1p/19q codeletion (oligodendrogli-oma) from LGG IDH mutant with intact 1p/19q loci (diffuse astrocytoma) and GBM IDH mutant (progres-sive GBM) from GBM IDH WT (de novo GBM). The TCGA samples were classified into these groups as per 2016 WHO classification scheme (Fig. 1). For methylation signature development, to begin with, we performed a Wilcoxon-rank sum test between differ-ent diffuse glioma subtypes to iddiffer-entify a list of signifi-cantly differentially methylated CpG probes, which were further subjected to a differential β value (Δβ) of 0.4 between groups. The TCGA samples were then divided randomly into two equal groups as training and test sets (Additional file 1: Table S1). The train-ing set was subjected to Prediction Analysis of
Micro-arrays (PAM) [20] to identify the methylation
14 CpG methylation signatures to distinguish LGG IDH mutant from LGG IDH wild type (WT): identification and validation
PAM analysis of differentially methylated CpGs
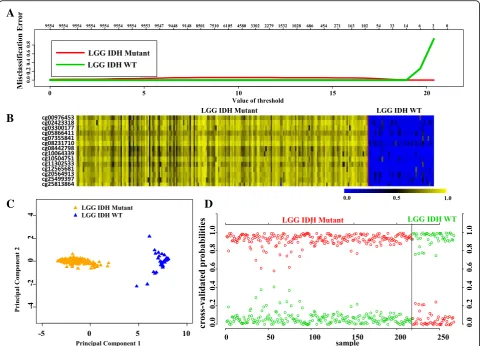
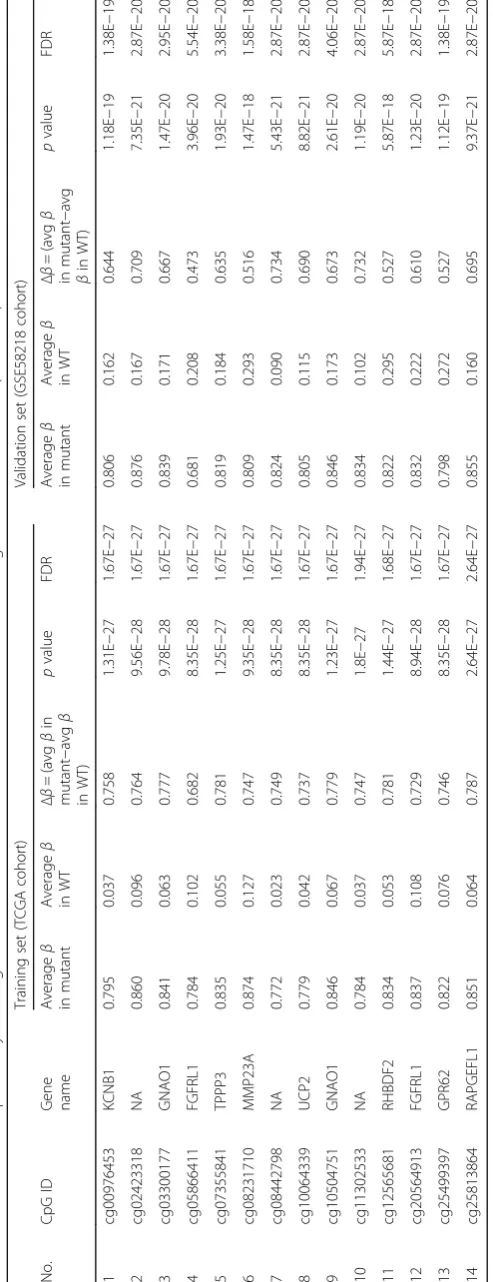
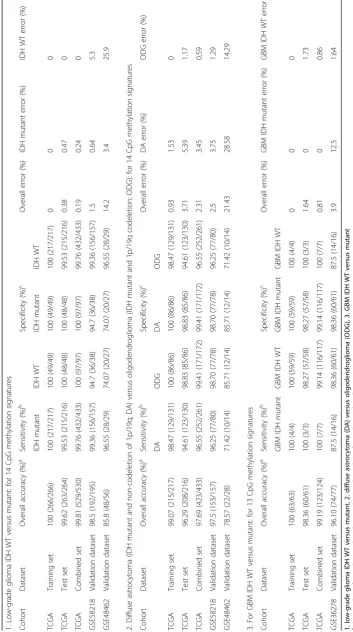
(Additional file 1: Table S2) in the training (TCAG) set (Additional file 1: Table S1) identified a set of 14 CpGs to distinguish IDH mutant from IDH WT in LGG at a threshold value of 18.9 with least error (Fig. 3a, Additional file 2: Figure S1A). The robustness of this probe set was tested by internal cross-validation using SVM, which gave a classification accuracy of 100% and subset validation with an accuracy of 100% (Additional file 2: Figure S2A and B respectively; see the Methods section for more details). The CpG probes of the signature were found to be hypermethylated in IDH mutant LGGs com-pared to IDH WT LGGs (Fig. 3b and Table 1). Further, upon subjecting the 14 CpG probes to PCA, the two prin-cipal components were able to form two distinct clusters for IDH mutant and IDH WT LGGs (Fig. 3c). Predic-tion accuracy estimaPredic-tion by 10-fold cross-validaPredic-tion using PAM showed that the 14 CpG probe methyla-tion signatures predicted all LGG IDH mutant sam-ples accurately with no error (Fig. 3d). Similarly, all LGG IDH WT samples were rightly predicted to be LGG with WT IDH samples based on the 14 CpG probe methylation signatures (Fig. 3d). Thus, the 14 CpG DNA methylation signatures were able to dis-criminate LGG IDH mutant from LGG IDH WT with an overall classification accuracy of 100%. The sensi-tivity and specificity of the signature for IDH mutant and WT in LGG are 100% (Table 2).
Next, we validated the strength of 14 CpG methylation signatures using the test set (Additional file 1: Table S1). The 14 discriminatory probes were observed to be differ-entially methylated between LGG IDH mutant and LGG IDH WT in the test set also (Additional file 2: Figure S3A and Additional file 1: Table S3A). The PCA demonstrated that the probes were able to distinguish IDH mutant from the WT group as two distinct clusters (Additional file 2: Figure S3B). Prediction accuracy estimation by 10-fold cross-validation using PAM showed that the 14 CpG probe methylation signatures predicted all IDH mutant LGG samples accurately except one with an error rate of 0.004 (Additional file 2: Figure S3C). Among IDH WT LGG samples, all of them were accurately predicted by the signature (Additional file 2: Figure S3C). Thus, the 14 CpG methylation signatures were able to discriminate between IDH mutant and WT LGG samples with an overall diagnostic accuracy of 99.62% in the test set. The sensitivity of the signature for IDH mutant LGG is 99.53% while for IDH WT LGG is 100%, and the specificity for IDH mutant is 100% whereas for those of the IDH WT, it is 99.53% (Table 2). The 14 CpG methylation signatures, as identified in the training set and validated in the test set, were also used to classify the entire set of TCGA LGG. We found that the 14 discriminatory probes distin-guished two groups (Additional file 2: Figure S4A, B, and C) with an overall accuracy of 99.81% (Table 2).
Next, we have also carried out additional validation of 14 CpG methylation signatures using two independent external LGG cohorts (GSE58218 [22] and GSE48462 [23]). In GSE58218, the 14 CpG methylation signatures
Fig. 1Overview of the 2016 WHO CNS tumor classification-based algorithm with the number of patients from TCGA dataset that is used in the
were able to discriminate IDH mutant from WT LGG samples with an overall diagnostic accuracy of 98.5% (Tables 1 and 2; Fig. 4a–c). Similarly, the 14 CpG methyla-tion signatures were able to discriminate IDH mutant from WT LGG samples with an overall diagnostic accuracy of 85.8% in GSE48462 (Table 2; Additional file 1: Table S3A; Additional file 2: Figure S5A, B, and C). Thus, from these experiments, we conclude that the 14 CpG methylation signatures developed as above distinguished LGG IDH mutant from WT samples with high accuracy.
14 CpG probe methylation signatures to classify
oligodendrogliomas (ODG) and diffuse astrocytoma (DA): identification and validation
PAM analysis of differentially methylated CpGs
(Additional file 1: Table S4) on the training (TCGA) set (Additional file 1: Table S1) identified a set of 14 CpGs to distinguish IDH mutant with 1p/19q codeletion (desig-nated as oligodendroglioma) from LGG IDH mutant with
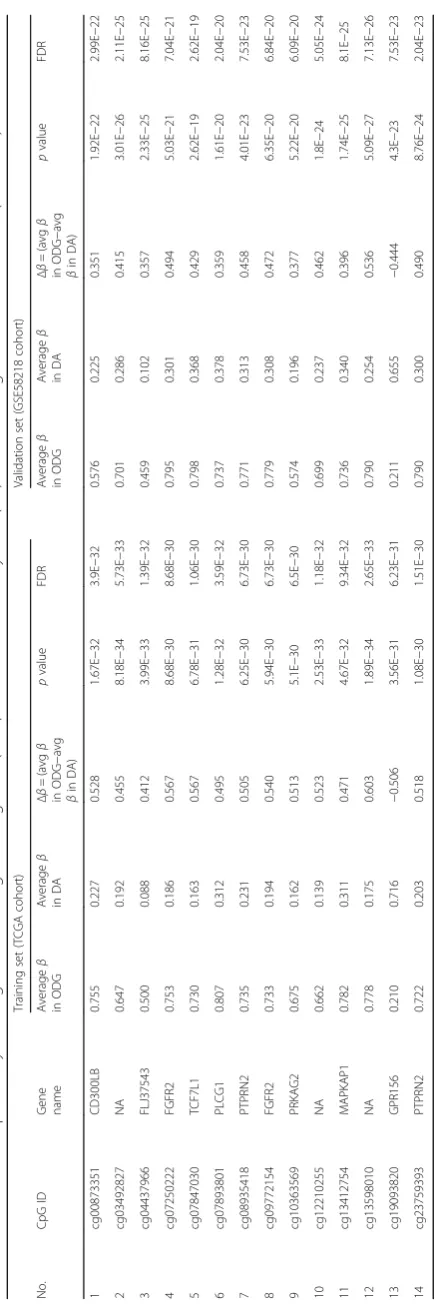
intact 1p/19q loci (designated as diffuse astrocytoma) at a threshold value of 9.491 with minimal error (Fig. 5a, Additional file 2: Figure S1B). The robustness of this probe set was tested by internal cross-validation using SVM, which gave a classification accuracy of 97.67 to 100% and subset validation with an accuracy of 99 to 100% (Additional file 2: Figure S2C and D, respectively; see the Methods section for more detail). The CpG probes that correspond to this signature were found to be hypermethylated in oligodendroglioma compared to diffuse astrocytoma (Fig. 5b and Table 3). Further, upon subjecting the 14 CpG probes to PCA, the two princi-pal components were able to separate these two groups into two distinct clusters (Fig. 5c). Prediction accuracy estimation by 10-fold cross-validation using PAM showed that the 14 CpG probe methylation signatures predicted all oligodendroglioma samples accurately with no error (Fig. 5d). With respect to diffuse astrocy-toma, all samples except two were accurately predicted
Fig. 2The schematic representation of the work flow of statistical analysis. PAM identified 14 discriminatory CpG probes of DNA methylation
to be diffuse astrocytoma based on the 14 CpG probe methylation signatures with an error rate of 0.0153 (Fig. 5d). Thus, the 14 CpG DNA methylation signatures were able to discriminate oligodendroglioma from diffuse astrocy-toma with an overall diagnostic accuracy of 99.07%. The sensitivity of the signature for oligodendroglioma is 100% while for diffuse astrocytoma is 98.47%, and the specificity for oligodendroglioma is 98.47% whereas for those of the diffuse astrocytomas is 100% (Table 2).
Next, we validated the strength of 14 CpG methylation signatures using the test (TCGA) set (Additional file 1: Table S1). The 14 discriminatory probes were observed to be differentially methylated between oligodendrogliomas and diffused astrocytoma similar to as seen in the training set (Additional file 2: Figure S6A and Additional file 1:
Table S3B). The PCA demonstrated that the probes were able to distinguish oligodendrogliomas from diffused astrocytoma as two distinct clusters (Additional file 2: Figure S6B). Prediction accuracy estimation by 10-fold cross-validation using PAM showed that the 14 CpG probe methylation signatures predicted all oligodendrogli-oma samples except one accurately with an error rate of 0.0117 (Additional file 2: Figure S6C). Among diffused as-trocytoma, except seven, all samples were accurately pre-dicted by the signature with an error rate of 0.0539 (Additional file 2: Figure S6C). Thus, the 14 CpG methyla-tion signatures were able to discriminate between oligo-dendroglioma and diffused astrocytoma samples with an overall diagnostic accuracy of 96.29% in the test set. The sensitivity of the signature for oligodendrogliomas is
A
B
C
D
Fig. 3Identification of 14 CpG probe methylation signatures of LGG IDH mutant versus WT in training set (TCGA).aPlot demonstrating classification
98.83% while for diffused astrocytoma, it is 94.61%, and the specificity for oligodendrogliomas is 94.61% whereas for diffused astrocytoma, it is 98.83% (Table 2). The 14 CpG methylation signatures, as identified in the training set and validated in the test set, were also used to classify the entire TCGA LGG IDH mutant samples into oligo-dendroglioma and diffuse astrocytoma samples. We found that the 14 discriminatory probes behaved similar in the classification (Additional file 2: Figure S7A, B and C) with an overall accuracy of 97.69% (Table 2).
In addition, we have also carried out additional valid-ation of 14 CpG methylvalid-ation signatures to distinguish oli-godenroglioma from diffuse astrocytoma using two independent external LGG cohorts (GSE58218 and GSE48462). In GSE58218, the 14 CpG methylation signa-tures were able to discriminate oligodenroglioma from
diffuse astrocytoma samples with an overall diagnostic ac-curacy of 97.5% (Tables 2 and 3; Fig. 6a–c). Similarly, the 14 CpG methylation signatures were also able to discrim-inate oligodenroglioma from diffuse astrocytoma samples with an overall diagnostic accuracy of 78.57% in GSE48462 (Table 2; Additional file 1: Table S3B; Additional file 2: Figure S8A, B and C). Thus, from these experiments, we conclude that the 14 CpG methylation signatures devel-oped as above distinguished oligodenroglioma from diffuse astrocytoma samples with high accuracy.
13 CpG probe methylation signatures to classify IDH mutant from wild type (WT) in glioblastoma (GBM): identification and validation
PAM analysis of differentially methylated CpGs
(Additional file 1: Table S5) in the training (TCGA)
A
B
C
Fig. 4Validation of the 14 CpG methylation signatures of LGG IDH mutant versus WT in an independent validation dataset GSE58218.aHeat
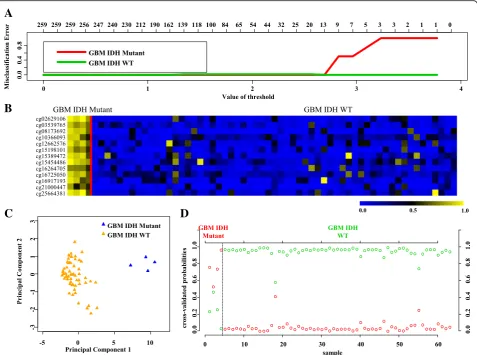
set (Additional file 1: Table S1) identified a set of 13 CpGs to distinguish GBM IDH mutant from IDH WT samples at a threshold value of 2.694 with no error (Fig. 7a, Additional file 2: Figure S1C). The robustness of this probe set was tested by internal cross-validation using SVM, which gave a classification accuracy of 100% and subset validation with an accuracy of 100% (Additional file 2: Figure S2E and F, respectively; see the Methods section for more details). The CpG probes of the signature were found to be hypermethylated in IDH mutant GBMs com-pared to IDH WT GBMs (Fig. 7b and Table 4). Further, upon subjecting the 13 CpG probes to PCA, the two prin-cipal components were able to form two distinct clusters for IDH mutant and IDH WT GBMs (Fig. 7c). Prediction
accuracy estimation by 10-fold cross-validation using PAM showed that the 13 CpG probe methylation signa-tures predicted all the samples accurately with no error (Fig. 7d). Similarly, among GBM IDH wild-type samples, all were rightly predicted by the 13 CpG methylation natures (Fig. 7d). Thus, the 13 CpG DNA methylation sig-natures were able to discriminate GBM IDH mutant from GBM IDH WT with an overall classification accuracy of 100%. The sensitivity and specificity of the signature for IDH mutant and WT in GBM are 100% (Table 2).
Next, we validated the strength of 13 CpG methylation signatures using the test set (Additional file 1: Table S1). The 13 discriminatory probes were observed to be differ-entially methylated between GBM IDH mutant and
A
B
C
D
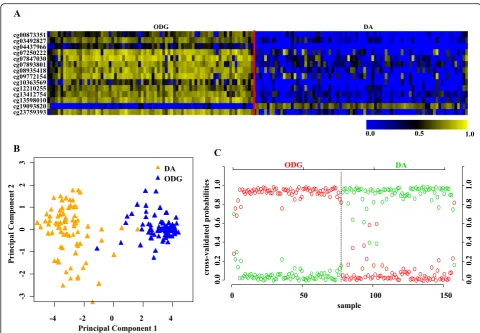
Fig. 5Identification of 14 CpG probe methylation signatures in training set (TCGA) for diffuse astrocytoma (DA) and oligodendroglioma (ODG).
aPlot demonstrating classification error for 2817 CpG probes from PAM analysis in training set. The threshold value of 9.491 corresponded to 14 discriminatory CpG probes which classified DA (LGG IDH Mut with intact 1p/19q;n= 131) and ODG (LGG IDH Mut with 1p/19q codel;n= 86) LGG samples with classification error of 0.93%.bHeat map of the 14 CpG discriminatory probes identified from the PAM analysis between DA and ODG patient samples in the training set (TCGA). Adual color codewas used whereyellowindicates more methylation (hypermethylation) and
blueindicates less methylation (hypomethylation).cPCA was performed using beta (methylation) values of 14 PAM-identified CpG probes between DA (n= 131) and WT (n= 86) LGG samples in training set. A scatter plot is generated using the first two principal components for each sample. The
GBM IDH WT in the test set also (Additional file 2: Figure S9A and Additional file 1: Table S3C). The PCA demonstrated that the probes were able to distinguish IDH mutant from the WT group as two distinct clusters (Additional file 2: Figure S9B). Prediction accuracy esti-mation by 10-fold cross-validation using PAM showed that the 13 CpG methylation signatures predicted all IDH mutant GBM samples accurately with no error rate (Additional file 2: Figure S9C). Among IDH WT GBM samples, all samples except one were accurately pre-dicted by the signature with an error rate of 0.0173 (Additional file 2: Figure S9C). Thus, the 13 CpG methy-lation signatures were able to discriminate IDH mutant from WT GBM samples with an overall diagnostic ac-curacy of 98.36% in the test set. The sensitivity of the signature for IDH mutant GBM is 100% while for IDH WT GBM is 98.27%, and the specificity for IDH mutant
is 98.27% whereas for those of the IDH WT, it is 100% (Table 2). The 13 CpG methylation signatures, as identi-fied in the training set and validated in the test set, were also used to classify the entire set of TCGA GBM set (117 IDH WT samples and 7 IDH mutant samples). We found that the 13 discriminatory probes distinguished two groups (Additional file 2: Figure S10A, B, and C) with an overall accuracy of 99.19% (Table 2). Further, we have also carried out additional validation of 13 CpG methylation signatures to distinguish GBM IDH mutant from WT samples using an independent external GBM cohort (GSE36278 [24]). Analysis revealed that the 13 CpG methylation signatures were able to discriminate GBM IDH mutant from WT samples with an overall diagnostic accuracy of 96.10% (Tables 2 and 4; Fig. 8a–c). Thus, from these experiments, we conclude that the 13
CpG methylation signatures developed as above
Fig. 6Validation of the 14 CpG methylation signatures of oligodendroglioma (ODG) versus diffuse astrocytoma (DA) in an independent validation
distinguished GBM IDH mutant from WT samples with high accuracy.
Molecular analysis of discordant samples
While the DNA methylation signatures were able to dis-tinguish different diffuse glioma subtypes, it also identi-fied a fraction of samples as discordant. It is of our interest to find out the accurate molecular nature of these samples in order to assess the true nature of them. While we could use TCGA cohort for this purpose as it had all relevant histological and molecular markers, ex-ternal validation cohorts could not be subjected to mo-lecular discordant analysis as they do not have these features. In the classification of LGG IDH mutant from
IDH WT, the 14 CpG signatures identified one IDH mu-tant LGG sample in the test set as discordant. We car-ried out a careful assessment of the molecular markers of this sample using c-Bioportal (http://www.cbioportal.org/) from the TCGA dataset. For this purpose, we analyzed TP53 mutation, ATRX loss, and 1p/19q codeletion status of all the samples (Additional file 1: Table S6, Table S7 A, B, and C, and Table S8). As per 2016 WHO CNS tumor classification, all LGG IDH mutant samples that have 1p/ 19q codeletion are designated as oligodendroglioma and those with intact 1p/19q loci and enriched for TP53 muta-tion/ATRX loss are designated as diffuse astrocytoma. The LGG IDH mutant discordant sample had intact 1p/ 19q, WT TP53, and ATRX genes indicating that this
A
B
C
D
Fig. 7Identification of 13 CpG probe methylation signatures in training set (TCGA) for IDH Mut and WT in GBM.aPlot demonstrating classification
sample is not an oligodendroglioma. The presence of WT TP53 and ATRX genes raises the possibility of it not being a diffuse astrocytoma. Interestingly, additional analysis re-vealed that the discordant sample is indeed carrying WT IDH as per DNA sequencing even though IDH antibody-based scoring classified it as IDH mutant. Therefore, it ap-pears that IDH mutation scoring by IHC could be an error as evidenced by DNA sequencing and that the 14 CpG methylation signatures are able classify the LGGs more accurately.
In the classification of LGG oligodendroglioma from LGG diffuse astrocytoma, 14 CpG probe methylation signatures identified ten samples as discordant which did not match the WHO 2016 tumor grading. In order to understand the true status of the discordant samples, we analyzed the clinical information and molecular
markers using c-Bioportal (http://www.cbioportal.org/) from the TCGA dataset. For this purpose, we analyzed TP53 mutation, ATRX mutation, and 1p/19q codeletion status in DA, ODG, and discordant samples of LGG (Additional file 1: Table S6, Table S7 A, B, and C, and Table S8). Based on the WHO 2016 CNS tumor classifi-cation, IDH mutant LGGs having intact 1p/19q with an enrichment of TP53 mutation and ATRX loss are classi-fied as diffuse astrocytoma. IDH mutant LGG samples with 1p/19q codeletion are classified as oligodendrogli-oma. The analysis of discordant samples for the molecu-lar markers and histological features revealed some interesting findings. While the single ODG discordant sample had 1p/19q codeletion and WT TP53/ATRX genes, this sample was identified as oligoastrocytoma as per histology. Among nine DA discordant samples, while
A
B
C
Fig. 8Validation of the 13 CpG methylation signatures of GBM IDH mutant versus WT in an independent validation dataset GSE36278.aHeat
all of them had intact 1p/19q loci, a majority of them were found to have WT TP53/ATRX genes.
In the classification of GBM IDH mutant from IDH WT, the 13 CpG probe methylation signatures identified one GBM IDH WT sample as discordant. In order to understand the true nature of the discordant sample, we analyzed the clinical information and molecular markers using c-Bioportal (http://www.cbioportal.org/) from the TCGA dataset (Additional file 1: Table S6, Table S8, and Table S9 A and B). The discordant GBM IDH WT sam-ple had WT IDH gene as per both immunohistochemi-cal staining and DNA sequencing. However, this sample had no amplification of EGFR locus with an intact PTEN gene, unlike what is expected for a IDH WT GBM sample.
Discussion
Glioma is the most common and highly malignant pri-mary brain tumor. The 2007 WHO classification of the glioma tumors was majorly based on microscopic ap-pearance of cell type and histopathological markers largely segregating into three subtypes such as astrocy-toma, oligodendroglioma, and oligoastrocytoma (mixed) [3]. With the advent of the high-throughput technolo-gies, comprehensive understanding of the heterogeneous genetic and epigenetic landscape of both glioblastoma and the low grades became vibrant [25, 26]. The histo-pathological grading of glioma tumors could be sub-jected to inter-observer variation which would lead to misclassification with a potential possibility of not pro-viding the right kind of treatment [27]. To combat this shortcoming, several groups including work from our laboratory carried out extensive studies and have identi-fied several prognostic markers and molecular signatures based on mRNA, miRNA, and DNA methylation that would aid in better classification and identifying best choice of therapy [10–13, 15, 28–31].
The meeting by the International Society of Neuro-pathology held in Haarlem, Netherland, established guidelines for how to incorporate molecular findings into brain tumor diagnosis thereby setting the platform for a major revision of the 2007 CNS WHO classifica-tion [32]. The current updated version is summarized in the 2016 CNS WHO classifications [19]. In this study, using TCGA 450K DNA methylation data, we developed methylation signatures that could distinguish different classes of diffuse glioma with high accuracy. The signa-tures developed in this study using TCGA data are also validated extensively using TCGA data as well as inde-pendent datasets.
Infinium HumanMethylation450K BeadChip array
data for astrocytoma (grade II, III, and IV/GBM), oligo-dendroglioma, and oligoastrocytoma tumor samples from TCGA dataset was used in this study. By using
PAM, we have successfully developed and validated DNA methylation signatures to distinguish LGG IDH mutant from LGG IDH wild-type samples, LGG IDH mutant samples into diffuse astrocytoma and IDH mu-tant GBM from the IDH WT GBMs. The signatures classified these groups with very high accuracy and also validated successfully in multiple independent datasets. We also used PCA to test the ability of signatures to div-ide the two groups in comparison into two distinct clas-ses. Further, the 10-fold cross-validation using PAM identified the discordant samples, which upon further analysis revealed that majority of misclassified samples were indeed due to inadequacies of the current methods used for classification.
Thus, the present study enabled us to identify DNA methylation fingerprint for each of the groups in com-parison (LGG IDH1 WT versus mutant, ODG versus DA, and GBM IDH mutant versus WT). The 2016 WHO classification system fails to classify some samples accurately in occasions like absence of certain molecular markers, errors due to antibody-based scoring, and intra-tumoral heterogeneity. We believe that DNA methylation signatures based on whole tumor developed in this study could complement the 2016 WHO classifi-cation of diffuse glioma subtypes.
Conclusions
In conclusion, we were able to classify diffuse glioma subtypes with high accuracy. The discordant samples identified by the methylation signature were found to be either due to technical errors or mixed histological types. More importantly, we believe that the high levels of intra-tumoral heterogeneity reported in glioma could also be a reason for their misclassification [7, 27]. Col-lectively, our study indicates that the methylation-based molecular profiles in combination with the revised 2016 WHO CNS tumor classification guidelines might be able to classify the samples more precisely.
Methods
Tumor samples and clinical details
mutant). The clinical information for the same was also procured from TCGA.
With an aim to identify methylation differences be-tween the diffuse glioma subtypes (based on IDH muta-tion and 1p/19q codelemuta-tion status) of each group, a supervised machine learning approach through PAM (Prediction Analysis of Microarrays) [20] was used. For this purpose, the first step was to identify significantly differentially methylated CpG probes between lower grade glioma IDH WT and mutant, between DA and ODG, and between GBM IDH mutant and WT which are described in details below.
Identification of differentially methylated CpGs
In this study, three different comparisons were carried out—1. LGG: IDH mutant versus WT, 2. LGG IDH mu-tant: 1p/19q codel (ODG) versus non-codel (DA), and 3. GBM: IDH mutant versus WT. For the first comparison between LGG IDH mutant and WT, we have performed a Wilcoxon-rank sum test between IDH mutant and WT which yielded 269,442 CpG probes significantly (FDR≤0.0001) differentially methylated in mutant versus WT. Next, a stringent cutoff of 0.4 absolute Δβ value was applied that showed 9,554 significantly differentially methylated (26 CpGs were hypomethylated and 9528 CpGs were hypermethylated in IDH mutant LGG; Additional file 1: Table S2) CpG probes in mutant as compared to WT IDH LGG patients. Firstly, the TCGA 450K human methylation dataset for LGG patients with
IDH mutation (n= 433) and LGG patients with WT
IDH (n= 97) was randomized and 50% of each of the two classes formed the training set, and the remaining 50% was used as the test set. We randomized TCGA dataset ten times to obtain ten different training sets and their corresponding test sets. After performing PAM on each of the ten training sets, the training set that gave least error with minimum number of CpGs was selected for further studies. This process gave a set of 14 discrim-inatory CpG probes which were further tested through SVM and subset analysis before testing on the test set and external validation sets (Fig. 2; Table 1).
Similarly, analysis was carried out for LGG IDH mu-tant cohort with and without 1p/19q codeletion (ODG and DA, respectively) patients (Fig. 2). For this compari-son, between LGG IDH mutant 1p/19q codel (ODG) and non-codel (DA), we have performed a Wilcoxon-rank sum test which yielded 160,288 CpG probes signifi-cantly differentially methylated in ODG versus DA. Next, a stringent cutoff of 0.2 absolute Δβ value was applied that showed 2817 significantly differentially methylated (627 CpGs were hypomethylated and 2190 CpGs were hypermethylated in ODG; Additional file 1: Table S4) CpG probes in mutant as compared to WT IDH LGG patients. The TCGA 450K human methylation
dataset for LGG patients with 1p/19q codel (n= 172) and non-codel (n= 261) was randomized and 50% of each of the two classes formed the training set, and the remaining 50% was used as the test set. We randomized TCGA dataset ten times to obtain ten different training sets and their corresponding test sets. After performing PAM on each of the ten training sets, the training set that gave least error with minimum number of CpGs was selected for further studies. This process gave a set of 14 discriminatory CpG probes which were further tested through SVM and subset analysis before testing on the test set and external validation set (Fig. 2; Table 3).
Likewise, the same work flow was followed to identify a methylation-based signature that could distinguish the GBM IDH WT from mutant samples (Fig. 2). In this comparison, between GBM IDH mutant and WT patient samples, we have performed a Wilcoxon-rank sum test which yielded 69,669 CpG probes significantly differen-tially methylated in mutant versus WT. Next, a stringent cutoff of 0.2 absolute Δβvalue was applied that showed 259 significantly differentially methylated (33 CpGs were hypomethylated and 226 CpGs were hypermethylated in mutant; Additional file 1: Table S5) CpG probes in mu-tant as compared to WT IDH GBM patients. The TCGA 450K human methylation dataset for GBM patients with IDH mutation (n= 7) and WT (n= 117) was randomized and 50% of each of the two classes formed the training set, and the remaining 50% was used as the test set. We randomized TCGA dataset ten times to obtain ten dif-ferent training sets and their corresponding test sets. After performing PAM on each of the ten training sets, the training set that gave least error with minimum number of CpGs was selected for further studies. This process gave a set of 13 discriminatory CpG probes which were further tested through SVM and subset ana-lysis before testing on the test set and external validation set (Fig. 2; Table 4).
Prediction Analysis of Microarray (PAM)
the two classes formed the training set, and the
remaining 50% was used as the test set. This
randomization was performed ten times which resulted into ten different compositions of training set and their corresponding test set. Thereafter, each of these ten training sets was subjected to PAM analysis that uses 10-fold cross-validation to identify a predictive signature. Ten different training sets that were used to construct the PAM classifier resulted in ten non-identical predict-ive signatures, one for each iteration. The most promis-ing signature which had the maximum trainpromis-ing and test set accuracies was chosen. We also performed an in-ternal cross-validation on the training set of the most promising signature as predicted by PAM.
Internal cross-validation using Support Vector Machine (SVM) and random subset sampling
For internal cross-validation, we have used Support Vector Machine (SVM) [21]. Many prediction methods use SVM for classification of dataset into two or more classes. For a given set of binary classes training exam-ples, SVM can map the input space into higher dimen-sional space and seek a hyperplane to separate the positive data examples from the negative ones with the largest margin. SVM-based internal cross-validation is used for the training sets of 1. LGG IDH mutant versus WT, 2. diffuse astrocytoma versus oligodendroglioma, and 3. GBM IDH mutant versus WT. For each of the abovementioned cases, the samples were divided ran-domly into five subgroups containing equal number of the respective samples. These five subgroups of each cases, example LGG IDH mutant and WT, were made into five groups where each group contained one sub-group of LGG IDH mutant and one subsub-group of LGG IDH WT samples. Consequently, one group of LGG IDH WT plus LGG IDH mutant was considered as a test set while the rest four groups were considered as training set and this is referred to as a “fold.” In this way, SVM models were built five times to give fivefolds, wherein every group was considered as a test set and the remaining groups as training set. The accuracy for each fold was checked by this method.
The predictive accuracy of the three signatures was also analyzed in a subset of the following cases: 1. LGG IDH mutant (217) versus WT (n= 49), 2. diffuse astrocy-toma (n= 131) versus oligodendroglioma (n= 86), and 3. GBM IDH mutant (n= 4) versus WT (n= 59) by random subset sampling. PAM was used to predict the respective accuracies in the random subset sampling.
Principal component analysis
Principal component analysis (PCA) uses orthogonal transformation to convert a set of variables into a set of values of linearly uncorrelated variables that are called
principal components. The number of principal compo-nents can be less than or equal to the number of original variables. The first two principal components account for the largest possible variation in the dataset. PCA was performed using R package (version 3.1.0), on the train-ing and test sets to know how well the identified methy-lation signature classifies LGG IDH mutant and WT.
This process was repeated for identifying a methyla-tion signature between IDH mutant DA and ODG and between GBM IDH mutant and WT (a cutoff of 0.2 ab-solute Δβ was used here to identify significantly differ-ently methylated probes between the two classes).
Additional files
Additional file 1: Table S1.Sample size and diffuse glioma subsets of
various cohorts used in this study.Table S2.List of differentially methylated CpGs between LGG IDH mutant and WT used as PAM input in the training (TCGA) set.Table S3A.List of the 14 CpG methylation signatures for LGG IDH mutant versus IDH WT in the test set (TCGA) and validation set (GSE48462).Table S3B.List of the 14 CpG methylation signatures for oligodendroglioma (ODG) versus diffuse astrocytoma (DA) in the test set (TCGA) and validation set (GSE48462).Table S4.List of differentially methylated CpGs between oligodendroglioma and diffuse astrocytoma used as PAM input in the training (TCGA) set.Table S5.List of 259 differentially methylated CpG probes between GBM IDH mutant and WT used as PAM input in the training (TCGA) set.Table S6.
Molecular analysis of discordant samples identified by CpG methylation signatures.Table S7A.Molecular status for IDH, TP53, ATRX, and 1p/19q in LGG samples from TCGA used in this study.Table S7B.Molecular status for IDH, TP53, ATRX, and 1p/19q in LGG samples from GSE58218 used in this study.Table S7C.Molecular status for IDH, TP53, ATRX, and 1p/19q in LGG samples from GSE48462 used in this study.Table S8.
Patient IDs of the discordant samples derived from all datasets used in this study.Table S9A.Molecular status of IDH, TP53, ATRX, EGFR, and PTEN in GBM samples from TCGA dataset used in this study.Table S9B.
Molecular status of IDH, TP53, ATRX, EGFR, and PTEN in GBM samples from GSE38278 dataset used in this study. (ZIP 1601 kb)
Additional file 2:Has ten additional figures and their corresponding
figure legends. (PPTX 830 kb)
Abbreviations
AA:Anaplastic astrocytoma; DA: Diffuse astrocytoma; GBM: Glioblastoma; IDH: Isocitrate dehydrogenase; ODG: Oligodendroglioma; PAM: Prediction Analysis of Microarray; PCA: Principal component analysis; SVM: Support Vector Machine; TCGA: The Cancer Genome Atlas; WHO: World Health Organization
Acknowledgements
The results published here are in whole or part based upon data generated by The Cancer Genome Atlas (TCGA) pilot project established by the NCI and NHGRI. Information about TCGA and the investigators and institutions which constitute the TCGA research network can be found at http:// cancergenome.nih.gov. We also acknowledge the use of GSE58218, GSE48462, and GSE36278 in this study. Infrastructure support by funding from DST-FIST, DBT grant-in-aid, and UGC (Centre for Advanced Studies in Molecular Microbiology) to MCB is acknowledged. KS thanks DBT, Government of India for financial support. KS is a JC Bose Fellow of the Department of Science and Technology.
Funding
Availability of data and materials
Information about TCGA methylation data are made publically available at http://cancergenome.nih.gov.
Authors’contributions
KS coordinated the study. KS and BM conceived and wrote the paper. KS and BM designed while YP performed the analysis of the TCGA dataset for all the experiments. VP performed all the data analysis related to the SVM, subset analysis, statistical analysis, and preparation of the revised manuscript. All authors read and approved the final manuscript.
Competing interests
The authors declare that they have no competing interests.
Consent for publication
Not Applicable.
Ethics approval and consent to participate
Not Applicable.
Publisher’s Note
Springer Nature remains neutral with regard to jurisdictional claims in published maps and institutional affiliations.
Received: 29 September 2016 Accepted: 20 March 2017
References
1. Ostrom QT, Gittleman H, Fulop J, Liu M, Blanda R, Kromer C, Wolinsky Y, Kruchko C, Barnholtz-Sloan JS. CBTRUS statistical report: primary brain and central nervous system tumors diagnosed in the United States in 2008– 2012. Neuro Oncol. 2015;17 Suppl 4:iv1–iv62.
2. Cohen AL, Holmen SL, Colman H. IDH1 and IDH2 mutations in gliomas. Curr Neurol Neurosci Rep. 2013;13(5):345.
3. Louis DN, Ohgaki H, Wiestler OD, Cavenee WK, Burger PC, Jouvet A, Scheithauer BW, Kleihues P. The 2007 WHO classification of tumours of the central nervous system. Acta Neuropathol. 2007;114(2):97–109.
4. Dunn GP, Rinne ML, Wykosky J, Genovese G, Quayle SN, Dunn IF, Agarwalla PK, Chheda MG, Campos B, Wang A, et al. Emerging insights into the molecular and cellular basis of glioblastoma. Genes Dev. 2012;26(8):756–84. 5. Holland EC. Glioblastoma multiforme: the terminator. Proc Natl Acad Sci U S
A. 2000;97(12):6242–4.
6. Meyer M, Reimand J, Lan X, Head R, Zhu X, Kushida M, Bayani J, Pressey JC, Lionel AC, Clarke ID, et al. Single cell-derived clonal analysis of human glioblastoma links functional and genomic heterogeneity. Proc Natl Acad Sci U S A. 2015;112(3):851–6.
7. Patel AP, Tirosh I, Trombetta JJ, Shalek AK, Gillespie SM, Wakimoto H, Cahill DP, Nahed BV, Curry WT, Martuza RL, et al. Single-cell RNA-seq highlights intratumoral heterogeneity in primary glioblastoma. Science. 2014;344(6190): 1396–401.
8. Scherer HJ. A critical review: the pathology of cerebral gliomas. J Neurol Psychiatry. 1940;3(2):147–77.
9. Stupp R, Reni M, Gatta G, Mazza E, Vecht C. Anaplastic astrocytoma in adults. Crit Rev Oncol Hematol. 2007;63(1):72–80.
10. Noushmehr H, Weisenberger DJ, Diefes K, Phillips HS, Pujara K, Berman BP, Pan F, Pelloski CE, Sulman EP, Bhat KP, et al. Identification of a CpG island methylator phenotype that defines a distinct subgroup of glioma. Cancer Cell. 2010;17(5):510–22.
11. Shukla S, Pia Patric IR, Thinagararjan S, Srinivasan S, Mondal B, Hegde AS, Chandramouli BA, Santosh V, Arivazhagan A, Somasundaram K. A DNA methylation prognostic signature of glioblastoma: identification of NPTX2-PTEN-NF-kappaB nexus. Cancer Res. 2013;73(22):6563–73.
12. Srinivasan S, Patric IR, Somasundaram K. A ten-microRNA expression signature predicts survival in glioblastoma. PLoS One. 2011;6(3):e17438. 13. Verhaak RG, Hoadley KA, Purdom E, Wang V, Qi Y, Wilkerson MD, Miller CR,
Ding L, Golub T, Mesirov JP, et al. Integrated genomic analysis identifies clinically relevant subtypes of glioblastoma characterized by abnormalities in PDGFRA, IDH1, EGFR, and NF1. Cancer Cell. 2010;17(1):98–110. 14. Cairns RA, Mak TW. Oncogenic isocitrate dehydrogenase mutations:
mechanisms, models, and clinical opportunities. Cancer Discov. 2013; 3(7):730–41.
15. Parsons DW, Jones S, Zhang X, Lin JC, Leary RJ, Angenendt P, Mankoo P, Carter H, Siu IM, Gallia GL, et al. An integrated genomic analysis of human glioblastoma multiforme. Science. 2008;321(5897):1807–12.
16. Yan H, Parsons DW, Jin G, McLendon R, Rasheed BA, Yuan W, Kos I, Batinic-Haberle I, Jones S, Riggins GJ, et al. IDH1 and IDH2 mutations in gliomas. N Engl J Med. 2009;360(8):765–73.
17. Zhao S, Lin Y, Xu W, Jiang W, Zha Z, Wang P, Yu W, Li Z, Gong L, Peng Y, et al. Glioma-derived mutations in IDH1 dominantly inhibit IDH1 catalytic activity and induce HIF-1alpha. Science. 2009;324(5924):261–5.
18. Turcan S, Rohle D, Goenka A, Walsh LA, Fang F, Yilmaz E, Campos C, Fabius AW, Lu C, Ward PS, et al. IDH1 mutation is sufficient to establish the glioma hypermethylator phenotype. Nature. 2012;483(7390):479–83.
19. Louis DN, Perry A, Reifenberger G, von Deimling A, Figarella-Branger D, Cavenee WK, Ohgaki H, Wiestler OD, Kleihues P, Ellison DW. The 2016 World Health Organization classification of tumors of the central nervous system: a summary. Acta Neuropathol. 2016;131(6):803–20.
20. Tibshirani R, Hastie T, Narasimhan B, Chu G. Diagnosis of multiple cancer types by shrunken centroids of gene expression. Proc Natl Acad Sci U S A. 2002;99(10):6567–72.
21. Cortes C, Vapnik V. Support-vector networks. Mach Learn. 1995;20(3):273–97. 22. Wiestler B, Capper D, Sill M, Jones DT, Hovestadt V, Sturm D, Koelsche
C, Bertoni A, Schweizer L, Korshunov A, et al. Integrated DNA methylation and copy-number profiling identify three clinically and biologically relevant groups of anaplastic glioma. Acta Neuropathol. 2014;128(4):561–71.
23. van den Bent MJ, Erdem-Eraslan L, Idbaih A, de Rooi J, Eilers PH, Spliet WG, den Dunnen WF, Tijssen C, Wesseling P, Sillevis Smitt PA, et al. MGMT-STP27 methylation status as predictive marker for response to PCV in anaplastic oligodendrogliomas and oligoastrocytomas. A report from EORTC study 26951. Clin Cancer Res. 2013;19(19):5513–22.
24. Sturm D, Witt H, Hovestadt V, Khuong-Quang DA, Jones DT, Konermann C, Pfaff E, Tonjes M, Sill M, Bender S, et al. Hotspot mutations in H3F3A and IDH1 define distinct epigenetic and biological subgroups of glioblastoma. Cancer Cell. 2012;22(4):425–37.
25. Brennan CW, Verhaak RG, McKenna A, Campos B, Noushmehr H, Salama SR, Zheng S, Chakravarty D, Sanborn JZ, Berman SH, et al. The somatic genomic landscape of glioblastoma. Cell. 2013;155(2):462–77.
26. Frattini V, Trifonov V, Chan JM, Castano A, Lia M, Abate F, Keir ST, Ji AX, Zoppoli P, Niola F, et al. The integrated landscape of driver genomic alterations in glioblastoma. Nat Genet. 2013;45(10):1141–9.
27. Coons SW, Johnson PC, Scheithauer BW, Yates AJ, Pearl DK. Improving diagnostic accuracy and interobserver concordance in the classification and grading of primary gliomas. Cancer. 1997;79(7):1381–93.
28. Nijaguna MB, Patil V, Hegde AS, Chandramouli BA, Arivazhagan A, Santosh V, Somasundaram K. An eighteen serum cytokine signature for discriminating glioma from normal healthy individuals. PLoS One. 2015; 10(9):e0137524.
29. Rao SA, Srinivasan S, Patric IR, Hegde AS, Chandramouli BA,
Arimappamagan A, Santosh V, Kondaiah P, Rao MR, Somasundaram K. A 16-gene signature distinguishes anaplastic astrocytoma from glioblastoma. PLoS One. 2014;9(1):e85200.
30. Hegi ME, Diserens AC, Gorlia T, Hamou MF, de Tribolet N, Weller M, Kros JM, Hainfellner JA, Mason W, Mariani L, et al. MGMT gene silencing and benefit from temozolomide in glioblastoma. N Engl J Med. 2005;352(10):997–1003.
31. Colman H, Zhang L, Sulman EP, McDonald JM, Shooshtari NL, Rivera A, Popoff S, Nutt CL, Louis DN, Cairncross JG, et al. A multigene predictor of outcome in glioblastoma. Neuro Oncol. 2010;12(1):49–57.