R E S E A R C H A R T I C L E
Open Access
Sleep quality, BDNF genotype and gene
expression in individuals with chronic abdominal
pain
Swarnalatha Y Reddy
1, Nat A Rasmussen
1, Nicolaas H Fourie
1, Rebecca S Berger
1, Angela C Martino
1, Jessica Gill
1,
Ryan Longchamps
1, Xiao Min Wang
1, Margaret M Heitkemper
2and Wendy A Henderson
1*Abstract
Background:Sleep quality and genetics may contribute to the etiology of gastrointestinal (GI) symptoms. Individuals with impaired sleep often have a number of associated symptoms including chronic abdominal pain (CAP). The current study examined the interactions of brain-derived neurotrophic factor (BDNF) genotype with sleep quality in persons with CAP and healthy controls. In addition, associations among sleep quality, BDNF genotype, and gene expression were explored in the participants.
Methods:Data were collected on 59 participants (46% male, 61% White, 26.9 ± 6.6 years; CAP (n=19) and healthy controls (n=40)). Participants with CAP reported poorer sleep quality compared to healthy controls. BDNF genotype, categorized as Val/Val homozygotes versus the Met carriers.
Results:Microarray analysis found twenty-four differentially expressed genes by a two-fold magnitude in participants with poor sleep quality compared to good sleep quality, and seven differentially expressed genes comparing CAP to healthy control. Three specific genes in the pain group overlap with sleep quality, including insulin-like growth factor 1 (IGF1), spermatogenesis associated serine-rich 2-like (SPATS2L), and immunoglobulin heavy constant gamma 1 or mu (IGHG1/// IGHM). BDNF was shown to have an interaction effect with GI and sleep symptoms.
Conclusions:Participants with CAP reported poor sleep quality compared to healthy controls. The role of the BDNF Met allele on differential gene expression was not distinct as main factor, but impacted interactions with sleep quality and CAP. Down-regulation of IGF1, SPATS2L, and IGHG1 expression may be related to the etiology of poor sleep quality and CAP.
Trial registration:Clinicaltrial.gov # NCT00824941
Keywords:Sleep, Gene expression, BDNF, Chronic abdominal pain
Background
Chronic abdominal pain (CAP) affects an estimated 15− 20% of people worldwide [1,2], and is a symptom common to functional gastrointestinal (GI) disorders [3-5] such as irritable bowel syndrome (IBS). GI disorders are estimated to cost the United States approximately $30 billion annually related to lost productivity and medical care [6-8].
Sleep is necessary to health and well-being and, too little or too much sleep may increase the risk of developing chronic conditions [9,10]. Sleep disturbances are also associated with increased IBS symptoms [11-14]. In subjects with IBS, sleep scores are significantly correlated with pain [14].
There is evidence that genetics predispose people to alterations in sleep architecture and pain [9,10,15,16]. Brain-derived neurotrophic factor (BDNF) is encoded by the BDNF gene, which contains a single nucleotide polymorph-ism (SNP) Val66Met (rs6265), where adenine and guanine alleles vary, resulting in a variation of valine to methionine at codon 66. Studies by Bachmann et al. [16] show that BDNF Val66Met polymorphism modulates sleep intensity * Correspondence:[email protected]
1
Division of Intramural Research, National Institute of Nursing of Research, National Institutes of Health, Department of Health and Human Resources, 10 Center Drive, Building 10, 2-1341, Bethesda, MD 20892, USA
Full list of author information is available at the end of the article
in healthy humans. As measured by electroencephalogram the study found pronounced variations in slow wave sleep activity specific to BDNF. Another study indicated that elevated BDNF expression in IBS patients compared to healthy controls is correlated with higher abdominal pain scores [17]. Although there are limited studies involving IBS and BDNF, a 10-biomarker index that included BDNF, was used to differentiate IBS from non-IBS subjects and found to be sensitive and specific [18].
The purpose of this study was twofold: (a) to compare sleep quality between participants with CAP and healthy controls and (b) to explore interactions among sleep qual-ity, BDNF alleles, and gene expression in participants with CAP and healthy controls. It was expected that findings would provide new insights into the role of gene expression in relation to sleep quality and chronic pain conditions.
Methods
Design and setting
The study was approved by the Institutional Review Board and the Office of Human Subjects Research at the NIH. Participants were exclusively recruited to a natural history protocol (09-NR-0064, Clinicaltrial.gov # NCT00824941) conducted at the Hatfield Clinical Research Center, NIH. Details on participant’s recruitment, inclusion and exclusion criteria are provided in Additional file 1. Participants gave written consent and questionnaires were collected for sleep measurements during outpatient visits from January 2009 to July 2011. The peripheral blood samples were collected from fasting participants during the same visit.
Sample demographics and clinical variables
Demographics and clinical characteristics, and the sleep measures of the participants are given in Tables 1 and 2.
Healthy controls met the inclusion criteria for age, menses (females) and had no history of abdominal pain. Also, healthy controls had no other organic disorders or GI dis-eases (e.g., inflammatory bowel disease, celiac disease, bil-iary disorders, bowel resection) and had no cardiac, pulmonary, neurologic, renal, endocrine, or gynecological pathology and had no other exclusions (see Additional file 1). CAP is defined as a self-reported history of greater than 6 months of abdominal pain of unknown origin and no known diagnosed organic cause for the abdominal pain. This information is determined by self-report and confirmed by medical record review.
Gender, race, and age (in years) were collected using the Socio-demographic Questionnaire developed by the Center for Research in Chronic Disorders, University of Pittsburgh School of Nursing (1999) and administered through the Clinical Trials Database. During the clinical visit, the participant’s weight was measured in triplicate and height was measured in duplicate. The average height and weight were used to determine body mass index (BMI), calculated as weight in kilograms divided by height in meters squared (Table 1).
Sleep measurement
Participants rated their sleep quality by using the PSQI [19] questionnaire, which provides a subjective measure of sleep quality over the past month. The questionnaire contains 19 self-reported questions and 5 questions completed by a bed partner. The latter 5 questions are used for clinical information only, not tabulated in the scoring of the PSQI. The 19 self-reported questions are grouped into seven component scores: 1) sleep latency, 2) sleep disturbances, 3) daytime dysfunction, 4) medica-tions to sleep, 5) overall sleep quality, 6) duration of
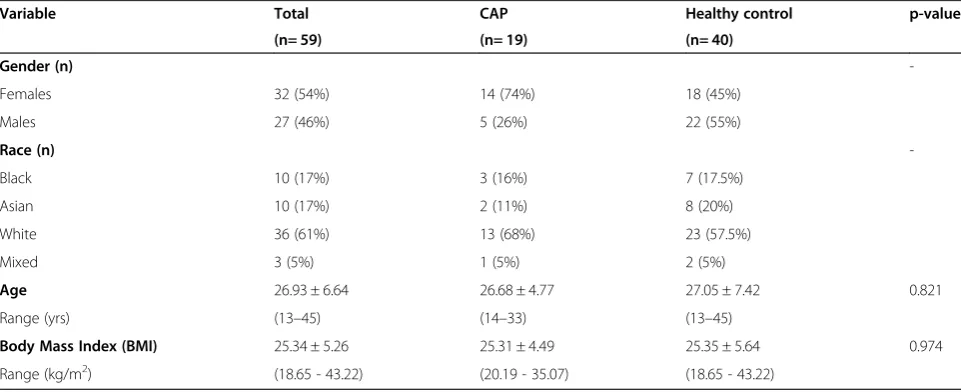
Table 1 Demographics and clinical characteristics of the healthy controls and participants with chronic abdominal pain (CAP)
Variable Total CAP Healthy control p-value
(n= 59) (n= 19) (n= 40)
Gender (n)
-Females 32 (54%) 14 (74%) 18 (45%)
Males 27 (46%) 5 (26%) 22 (55%)
Race (n)
-Black 10 (17%) 3 (16%) 7 (17.5%)
Asian 10 (17%) 2 (11%) 8 (20%)
White 36 (61%) 13 (68%) 23 (57.5%)
Mixed 3 (5%) 1 (5%) 2 (5%)
Age 26.93 ± 6.64 26.68 ± 4.77 27.05 ± 7.42 0.821
Range (yrs) (13–45) (14–33) (13–45)
Body Mass Index (BMI) 25.34 ± 5.26 25.31 ± 4.49 25.35 ± 5.64 0.974
Range (kg/m2) (18.65 - 43.22) (20.19 - 35.07) (18.65 - 43.22)
sleep, and 7) sleep efficiency. The seven component scores were summed to obtain a global PSQI score, ranging from 0–21 (Table 2). Component scores range from 0 (good sleep quality) to 3 (poor sleep quality). Global PSQI score ≤5 is associated with good sleep quality and >5 with poor sleep quality [19]. Buysse and colleagues reported internal consistency reliability for the PSQI for overall component and individual item scores (Cronbach’sα=0.83). Global PSQI scores >5 were reported to have a sensitivity of 89.6% and specificity of 86.5% in comparing poor sleepers to good sleepers [19].
DNA extraction and BDNF genotyping
Peripheral blood was collected from the participants using a yellow top BD Vacutainer® (BD Biosciences, Franklin Lakes, NJ) and frozen immediately at −80°C until the time of extraction. DNA extraction was per-formed on 5 mL of blood using the QIAamp DNA Blood Maxi Kit (Qiagen, Frederick, MD) according to the manufacturer’s instructions. If less than 5 mL of blood was available, phosphate buffered saline was added to bring the total volume to 5 mL. DNA concentration was determined by NanoDrop™1000 spectrophotometer (Thermo Scientific, Wilmington, DE) and, extracted DNA was stored at−20°C prior to genotyping assay.
Sample DNA was dried overnight on a MicroAmp™ op-tical 384-Well reaction plate (in duplicates) at a concentra-tion 5 ng/μL. Per genotyping protocol of the manufacturer, Assay ID: C_11592758_10 (product # 4351379), DNA was subsequently combined with the TaqMan® Universal PCR Master Mix and TaqMan® SNP Genotyping Assay Mix (Applied Biosystems, Foster City, CA). The genotyping assay contains two unlabeled primers (forward and reverse) for amplifying the sequence of interest and two labeled probes for detecting alleles. The probes consist of target-specific oligonucleotides with a reporter dye at the end of each probe, VIC® dye (linked to the 5′-end of the allele 1 probe), 6FAM™dye (linked to the 5′-end of the allele 2 probe). Also, the probes incorporate
nonfluorescent quencher on 3′-end attached to a minor groove binder.
Allelic discrimination PCR reactions (40 cycles) were then performed for BDNF rs6265 on 7900 HT Fast Real-Time PCR System (Applied Biosystems, Foster City, CA). Subsequently, an endpoint fluorescence measurement was obtained with the Sequence Detection Systems (SDS) soft-ware of 7900 HT Fast system (Applied Biosystems, Foster City, CA), to examine the samples for discrimination between the specific alleles.
RNA isolation and amplification
The blood samples (2.5 mL) from each participant were collected in PAXgene (Qiagen, Valencia, CA) tubes and stored at −81°C. Total RNA was extracted and purified from each blood sample using a RNA PAXgene kit (Qiagen, Frederick, MD) according to the manufacture’s protocol and stored at−81°C. The RNA quality and quan-tity were determined by spectrometry and by using the RNA 6000 Nano LabChip kit on a 2100 Bioanalyzer (Agilent Technologies, Santa Clara, CA). Total RNA that passed quality control criteria was used for microarray and qPCR experiments.
Microarray processing
Microarrays were processed by one person at the Labora-tory of Molecular Technology, National Cancer Institute (NIH, Frederick, MD), following standard operating protocol to minimize non-biologic technical bias. The RNA quantity, purity, and integrity were assessed by a NanoDrop™ 1000 spectrophotometer (Wilmington, DE) and Experion electrophoresis station (Bio-Rad Laboratories, Hercules, CA), respectively, or by 2100 Bioanalyzer using the RNA 6000 Nano LabChip kit (Agilent Technologies, Santa Clara, CA). All samples had a high quality score (RIN >9).
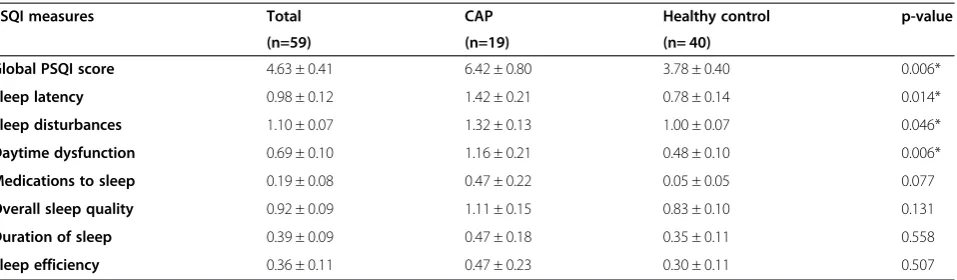
Double-stranded cDNA, was synthesized from 10 ng total RNA followed by a linear isothermal amplification to produce single-strand cDNA, which was direct labeled by Table 2 Sleep quality measures of healthy controls and participants with chronic abdominal pain (CAP)
PSQI measures Total CAP Healthy control p-value
(n=59) (n=19) (n= 40)
Global PSQI score 4.63 ± 0.41 6.42 ± 0.80 3.78 ± 0.40 0.006*
Sleep latency 0.98 ± 0.12 1.42 ± 0.21 0.78 ± 0.14 0.014*
Sleep disturbances 1.10 ± 0.07 1.32 ± 0.13 1.00 ± 0.07 0.046*
Daytime dysfunction 0.69 ± 0.10 1.16 ± 0.21 0.48 ± 0.10 0.006*
Medications to sleep 0.19 ± 0.08 0.47 ± 0.22 0.05 ± 0.05 0.077
Overall sleep quality 0.92 ± 0.09 1.11 ± 0.15 0.83 ± 0.10 0.131
Duration of sleep 0.39 ± 0.09 0.47 ± 0.18 0.35 ± 0.11 0.558
Sleep efficiency 0.36 ± 0.11 0.47 ± 0.23 0.30 ± 0.11 0.507
PSQI: Pittsburgh Sleep Quality Index.
biotin using Ovation Whole Blood Solution kit (NuGEN technologies, Inc., San Carlos, CA) following manufac-turer’s protocol. Biotinylated cDNA (4.4 μg) from each sample was mixed with the control buffer and hybridized on each Human Genome U133 plus 2.0 array (Affymetrix, Santa Clara, CA) at 45°C for 16 hours in a GeneChip Table 3 BDNF genotyping (N= 49 participants) and the
clinical measures of pain and sleep quality
ID BDNF Pain Sleep quality
3 Val/Val Healthy Control Poor quality
6 Val/Val Healthy Control Good quality
7 Val/Val Healthy Control Good quality
11 Val/Val CAP Good quality
12 Val/Val Healthy Control Poor quality
14 Val/Val Healthy Control Good quality
16 Val/Val CAP Poor quality
17 Val/Val Healthy Control Good quality
18 Val/Val Healthy Control Poor quality
20 Val/Val Healthy Control Poor quality
22 Val/Val Healthy Control Good quality
25 Val/Val Healthy Control Good quality
26 Val/Val Healthy Control Good quality
28 Val/Val Healthy Control Poor quality
31 Val/Val Healthy Control Good quality
35 Val/Val Healthy Control Good quality
36 Val/Val Healthy Control Good quality
38 Val/Val CAP Poor quality
39 Val/Val Healthy Control Good quality
40 Val/Val Healthy Control Good quality
41 Val/Val CAP Poor quality
42 Val/Val CAP Good quality
44 Val/Val CAP Good quality
46 Val/Val CAP Good quality
49 Val/Val Healthy Control Good quality
51 Val/Val Healthy Control Good quality
52 Val/Val Healthy Control Good quality
55 Val/Val CAP Good quality
57 Val/Val Healthy Control Good quality
61 Val/Val CAP Poor quality
64 Val/Val CAP Poor quality
65 Val/Val CAP Good quality
66 Val/Val CAP Good quality
69 Val/Val CAP Poor quality
1 Met Carrier Healthy Control Good quality
2 Met Carrier Healthy Control Poor quality
8 Met Carrier Healthy Control Good quality
15 Met Carrier Healthy Control Good quality
24 Met Carrier Healthy Control Good quality
27 Met Carrier CAP Good quality
29 Met Carrier Healthy Control Good quality
32 Met Carrier CAP Poor quality
33 Met Carrier Healthy Control Good quality
Table 3 BDNF genotyping (N= 49 participants) and the clinical measures of pain and sleep quality(Continued)
34 Met Carrier Healthy Control Poor quality
37 Met Carrier Healthy Control Good quality
43 Met Carrier CAP Poor quality
45 Met Carrier CAP Poor quality
53 Met Carrier CAP Poor quality
56 Met Carrier Healthy Control Good quality
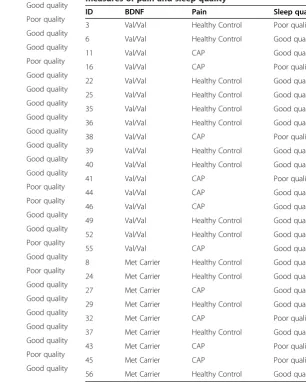
Table 4 Sample cohort (N= 26) for microarray
experiments comprising BDNF genotype and the clinical measures of pain and sleep quality
ID BDNF Pain Sleep quality
3 Val/Val Healthy Control Poor quality
6 Val/Val Healthy Control Good quality
11 Val/Val CAP Good quality
16 Val/Val CAP Poor quality
22 Val/Val Healthy Control Good quality
25 Val/Val Healthy Control Good quality
35 Val/Val Healthy Control Good quality
36 Val/Val Healthy Control Good quality
38 Val/Val CAP Poor quality
39 Val/Val Healthy Control Good quality
40 Val/Val Healthy Control Good quality
41 Val/Val CAP Poor quality
44 Val/Val CAP Good quality
46 Val/Val CAP Good quality
49 Val/Val Healthy Control Good quality
52 Val/Val Healthy Control Good quality
55 Val/Val CAP Good quality
8 Met Carrier Healthy Control Good quality
24 Met Carrier Healthy Control Good quality
27 Met Carrier CAP Good quality
29 Met Carrier Healthy Control Good quality
32 Met Carrier CAP Poor quality
37 Met Carrier Healthy Control Good quality
43 Met Carrier CAP Poor quality
45 Met Carrier CAP Poor quality
hybridization oven at 60 rpm. GeneChip arrays were washed on Fluidics Station 450 using manufacturer’s recommended scripts and scanned on GeneChip Scanner 3000 (Affymetrix, Santa Clara, CA). GeneChip Command Console (AGCC 3.0, Affymetrix) was used to scan the images and for data acquisition.
To enable the comparison between arrays, a global scal-ing factor (target signal to 500) was used across all arrays to minimize the variables caused by sample preparation, hybridization/ staining or from different lots of arrays. Microarray quality control was evaluated for each array by examination of background, noise, average signal, % present, ratio of signal values for probe sets representing the 5′and 3′ends of actin and glyceraldehyde-3-phosphate
dehydrogenase transcripts, and total signal for probesets for BioB, BioC, BioD and CreX.
qPCR experiments
Total RNA (200 ng) was reverse transcribed using the RT2First Strand cDNA Synthesis Kit (Qiagen, Frederick, MD). RT2 PCR Primer Assays and RT2 SYBR Green PCR Master Mix (Qiagen, Frederick, MD) were used to analyze trends in the gene expression of IGF-1, IGHG1, and SPATS2L. These genes were significantly expressed comparing CAP to healthy control, and also comparing poor quality sleep to good sleep quality. All reactions were plated in triplicate and beta actin (known as ACTB) was used as a housekeeping gene. The PCR plate
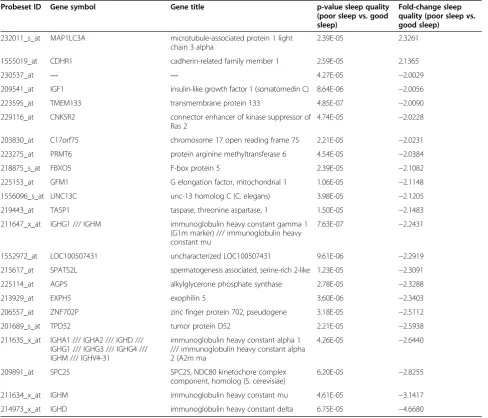
Table 5 Microarray differentially expressed genes for the sleep quality group that passed FDR (5%) and fold change (>2.0 and<−2.0) criteria (subset of 26 participants)
Probeset ID Gene symbol Gene title p-value sleep quality
(poor sleep vs. good sleep)
Fold-change sleep quality (poor sleep vs. good sleep)
232011_s_at MAP1LC3A microtubule-associated protein 1 light chain 3 alpha
2.39E-05 2.3261
1555019_at CDHR1 cadherin-related family member 1 2.59E-05 2.1365
230537_at --- --- 4.27E-05 −2.0029
209541_at IGF1 insulin-like growth factor 1 (somatomedin C) 8.64E-06 −2.0056
223595_at TMEM133 transmembrane protein 133 4.85E-07 −2.0090
229116_at CNKSR2 connector enhancer of kinase suppressor of
Ras 2
4.74E-05 −2.0228
203830_at C17orf75 chromosome 17 open reading frame 75 2.21E-05 −2.0231
223275_at PRMT6 protein arginine methyltransferase 6 4.54E-05 −2.0384
218875_s_at FBXO5 F-box protein 5 2.39E-05 −2.1082
225153_at GFM1 G elongation factor, mitochondrial 1 1.06E-05 −2.1148
1556096_s_at UNC13C unc-13 homolog C (C. elegans) 3.98E-05 −2.1205
219443_at TASP1 taspase, threonine aspartase, 1 1.50E-05 −2.1483
211647_x_at IGHG1 /// IGHM immunoglobulin heavy constant gamma 1 (G1m marker) /// immunoglobulin heavy constant mu
7.63E-07 −2.2431
1552972_at LOC100507431 uncharacterized LOC100507431 9.61E-06 −2.2919
215617_at SPATS2L spermatogenesis associated, serine-rich 2-like 1.23E-05 −2.3091
225114_at AGPS alkylglycerone phosphate synthase 2.78E-05 −2.3288
213929_at EXPH5 exophilin 5 3.60E-06 −2.3403
206557_at ZNF702P zinc finger protein 702, pseudogene 3.18E-05 −2.5112
201689_s_at TPD52 tumor protein D52 2.21E-05 −2.5938
211635_x_at IGHA1 /// IGHA2 /// IGHD /// IGHG1 /// IGHG3 /// IGHG4 /// IGHM /// IGHV4-31
immunoglobulin heavy constant alpha 1 /// immunoglobulin heavy constant alpha 2 (A2m ma
4.26E-05 −2.6440
209891_at SPC25 SPC25, NDC80 kinetochore complex
component, homolog (S. cerevisiae)
6.20E-05 −2.8255
211634_x_at IGHM immunoglobulin heavy constant mu 4.61E-05 −3.1417
214973_x_at IGHD immunoglobulin heavy constant delta 6.75E-05 −4.6680
was stored overnight wrapped in tin foil at 4°C and then run on 7900 HT real-time cycler (Applied Biosystems, Foster City, CA).
Data analysis
Descriptive statistics for all demographic, clinical vari-ables and sleep quality measures were calculated using SPSS Statistics (IBM SPSS Inc., Chicago, IL) (Tables 1 and 2). Comparisons were made for age and BMI be-tween the two levels of pain group (CAP versus healthy control) of the participants using t-tests. For sleep quality measures, a priori p-values <0.05 were considered significant (Table 2).
For the analysis of genotyping data, the threshold for Quality value, which influences the allele call was set to 100 (Additional file 2: Table S1). Chi-square tests were performed to study the associations of BDNF SNP with categorical measures of sleep quality (poor sleep versus good sleep) and pain groups (CAP versus healthy control). The BDNF Met allele has previously been associated and implicated in various behavioral and cognitive processes [20-22]. In order to assess the associations of the Met allele with the sleep, pain and gene expression data, heterozygous and homozygous Met genotypes were grouped together into a Met carrier group (Table 3) for comparison with the homozygous Val genotype (or non-Met carrier group) as is typically done in the study of these alleles due to the low frequency of the homozy-gous Met genotype [20,22].
Microarray data on 26 participants (a subset of 59 sam-ple full cohort, Table 4 and Additional file 2: Table S2) were analyzed for gene expression patterns using Partek Genomics Suite software (Partek Inc., St. Louis, MO). The probe-level robust multichip average background correc-tion, quantile normalization and Log2 transformation
followed by probe-set summarization were performed on gene expression intensity values. Multi-way ANOVA was used to compare the gene expression profiles between the two levels of, Pain: CAP (11) and healthy control (15),
Sleep quality:poor sleep quality(7) andgood sleep quality (19) andBDNF:Val homozygous (17) andMet carriers(9).
Gender (Females 15 and Males 11) was included in the analysis. The interaction terms of sleep quality * pain, sleep quality * BDNF,andpain * BDNF were included in the 4-way ANOVA model. Differentially expressed gene lists were generated for sleep quality and pain groups by a magnitude of 2-fold change (in either direction), and at the false discovery rate (FDR) 0.05 level. The same fold change criteria was used to obtain differentially expressed genes for BDNF groups, but with unadjusted p-values <0.05 as FDR criteria were not fulfilled.
Interactive pathway analysis (Qiagen Systems, Redwood City, CA) was performed on differentially expressed genes between poor sleep quality and good sleep quality to Table 6 Microarray differentially expressed genes for the pain group that passed FDR (5%) and fold change (>2.0 and<−2.0) criteria (subset of 26 participants)
Probeset ID Gene symbol Gene title p-value pain (CAP vs.
healthy control)
Fold-change pain (CAP vs. healthy control)
*215617_at SPATS2L spermatogenesis associated, serine-rich 2-like 4.28E-06 2.5283
*230537_at --- --- 3.41E-06 2.3876
*233398_at --- --- 3.95E-06 2.3134
*209541_at IGF1 insulin-like growth factor 1 (somatomedin C) 2.55E-06 2.1813
236062_at --- --- 2.52E-06 2.1507
*211647_x_at IGHG1 /// IGHM /// LOC100133862
immunoglobulin heavy constant gamma 1 (G1m marker) /// immunoglobulin heavy constant mu
2.81E-06 2.1102
1565874_at --- --- 2.22E-06 2.02869
FDR: False Discovery Rate.
*Probesets (genes) of pain group overlap with Sleep quality group.
Gene List_Sleep quality (poor sleep vs. good sleep)
24
Gene List_Pain (CAP vs. Healthy Control)
7
209541_at: IGF1
211647_x_at: IGHG1 /// IGHM 215617_at: SPATS2L 230537_at
233398_at
236062_at 1565874_at
identify gene networks associated with specific bio-logical functions. Genes were colored based on expression values, up-regulated in red and down-regulated in green, respectively. Connectivity of differentially expressed genes
was made via the molecules added from Ingenuity know-ledge database. A network was generated based on signifi-cant differentially expressed genes of CAP compared to healthy control.
The qPCR data on genes IGF-1, IGHG1, and SPATS2L were uploaded and analyzed with the use of Web Analysis tool (http://www.sabiosciences.com/). Threshold cycle cut-off was set at 35 cycles per literature recommenda-tion and trends in gene expression were analyzed in respect to a 95% confidence interval.
Results and discussion
The sample comprised 59 participants (46% male, 61% White, 26.9 ± 6.6 years), which included individuals with CAP (n=19) and healthy controls (n=40) (Table 1). A com-parison of age and body mass index (BMI) showed no sig-nificant differences between CAP and healthy controls
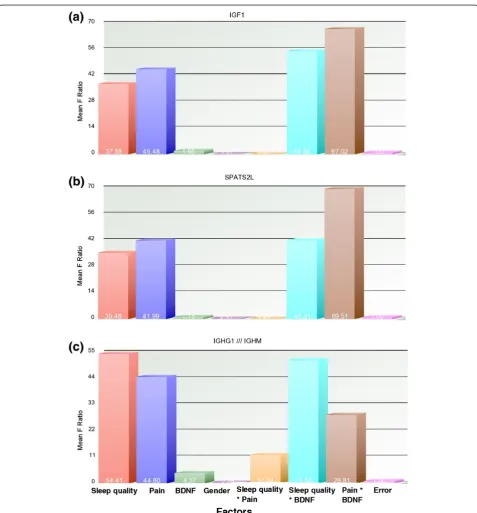
Figure 3Sources of variation of the significant genes.Effect of various factors and the interactions across the differentially expressed genes:
(Table 1). Sleep quality measures [19] of the participants are given in Table 2. As expected, participants with CAP had significantly higher scores than healthy controls on the global Pittsburgh Sleep Quality Index (PSQI), sleep la-tency, sleep disturbances, and daytime dysfunction scores. Higher sleep scores on the PSQI scale equate to poorer sleep quality. Also, there was a trend toward higher scores for medications to sleep and overall sleep quality in partic-ipants with CAP compared to healthy controls (Table 2). However, there were no significant differences in measures of duration of sleep or sleep efficiency between the two groups. These results are consistent with studies reported in literature on relationships between sleep quality and IBS [14,23,24].
Genotyping studies were employed to explore BDNF SNP (rs6265) on the sleep quality (poor sleep versus good sleep) and pain (CAP versus healthy control) groups. The raw data from genotyping experiment processed on 59
samples is given in Additional file 2: Table S1. The Quality value reflects the probability of the genotype call or Val66-Met polymorphism. Data were dichotomized as the homozygous Val group (i.e., Val/Val; GG alleles) and Met carriers consisting of genotypes supporting the Met allele (i.e., Val/Met (GA alleles) and Met/Met (AA alleles). Depending on the detection of SNPs, data on 49 samples were used for analysis, given in Table 3. There were no significant associations observed with regard to BDNF SNP with sleep quality or pain grouping.
Details of the cases and healthy controls of the sample cohort used for microarray experiments are given in Table 4. Also, the demographics of the microarray sample cohort are provided in Additional file 2: Table S2. There were no significant differences between the microarray cohort and the full cohort with regard to gender, age, or BMI. The dis-tribution of BDNF genotypes are known to vary among races [25-28]. Our study included a substantial Caucasian
cohort which was selected as a statistically viable group for an analysis of both SNP and gene expression data while controlling for the possible effects of race.
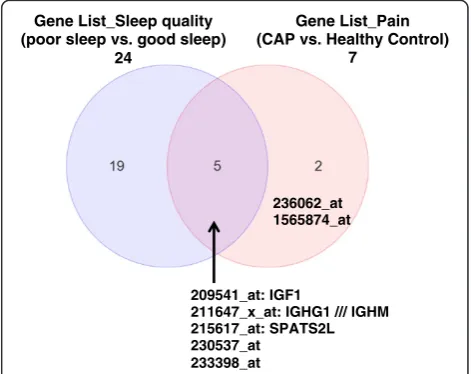
Gene expression studies by microarray showed majority of differentially expressed genes comparing poor sleep quality to good sleep quality group were down-regulated (by a two-fold magnitude, Table 5). Interestingly, for the pain group, the CAP had increased gene expression (>2.0 fold) compared to healthy controls (Table 6). Three specific named genes overlap in the sleep quality (poor sleep versus good sleep) and pain (CAP versus healthy control) groups: insulin-like growth factor 1 (IGF1), spermatogenesis asso-ciated, serine-rich 2-like (SPATS2L), and immunoglobulin heavy constant gamma 1 or mu (IGHG1//IGHM). Also, two unnamed genes (probesets 230537_at and 233398_at) overlap between sleep quality and pain groups (Figure 1).
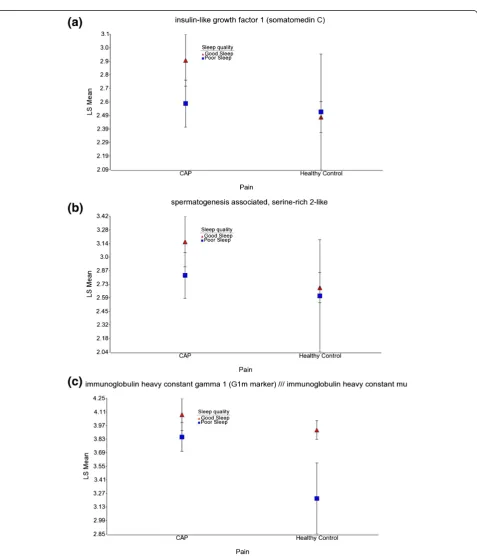
The intensity of specific genes such as IGF1, SPATS2L, and IGHG1 /// IGHM are shown across the two groups of pain and sleep quality (Figure 2). An examination of gene expression profiles associated with CAP showed decreased values for poor sleep quality compared to good sleep quality. In healthy controls, the difference in gene expression was minimal based on sleep quality for IGF1 and SPATS2L genes (Figures 2a and 2b).
Differentially expressed genes for BDNF group, compar-ing Val homozygous to Met carriers are given in Additional file 2: Table S3. The most prominent down-regulated genes are human leukocyte antigen, major histocompatibility complex, class II, DQ alpha 1(HLA-DQA1) and urotension
2 (UTS2). HLA-DQA1 plays an important role in immune system and is expressed in antigen presenting cells. Varia-tions of HLA-DQA1 gene have been associated with an increased risk of celiac disease. UTS2, a neuropeptide expressed only in brain tissue, is implicated in regulation of sleep stages [29]. Differentially expressed genes of BDNF groups are found to have no overlap with differen-tially expressed genes of either pain group or sleep quality group. An examination of the main factors (BDNF, sleep quality, and pain) and their interactions on differential gene expression of IGF1, SPATS2L, and IGHG1/// IGHM (Figure 3) indicates that BDNF has an indirect effect, which is additive to the model.
Real time PCR was used to validate the microarray results. Participants with CAP had up-regulation in the expression of IGF1, IGHG1 and SPATS2L (2.83-fold, 1.36-fold and 1.05-fold respectively) compared to healthy controls. The three genes showed fold change by a factor of 0.252, 0.735, and 0.950 for IGF1, IGHG1 and SPATS2L, respectively (95% CI: 0.00001, 2.64; 0.00001, 5.18; 0.00001, 6.42).
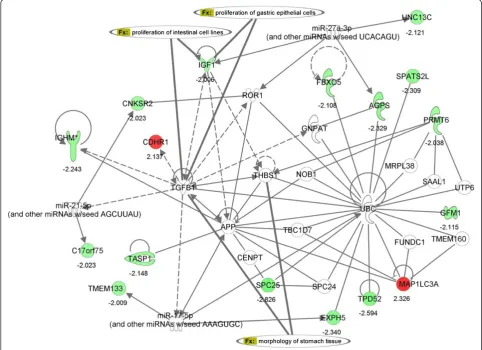
Interactive pathway analysis (IPA) (Qiagen Ingenuity Systems, Inc., Redwood City, CA) on differential expressed genes comparing poor sleep quality to good sleep quality resulted in a network associated with functions such as cellular development, hematopoiesis, and tissue morph-ology. A schematic diagram of functional gene network is shown in Figure 4, of which some have a role in gas-trointestinal diseases. Differentially expressed genes are
colored (up-regulated in red and down-regulated in green). The genes uncolored are absent in the differentially expressed gene list, but have relationships as shown in the network. The growth factor IGF1 appears pivotal, involved with the proliferation of intestinal cell lines and gastric epithelial cells (Figure 4).
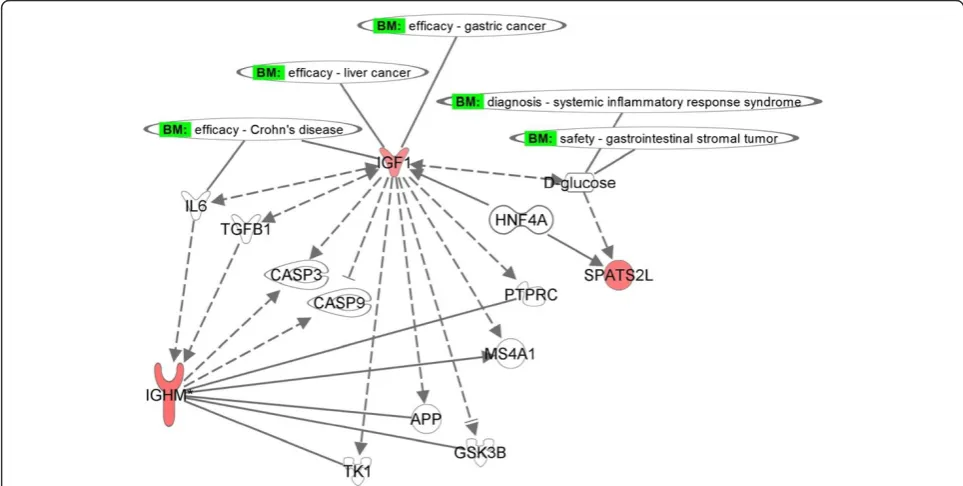
Molecular paths generated based on the most significant genes of pain group, IGF1, SPATS2L, and IGHM are shown in Figure 5. SPATS2L is a gene of unknown func-tion, involved in protein-protein interactions, binding to Ubiquitin (UBC) protein (Figures 4), and regulated by D-glucose [30]. SPATS2L, along with IGF1, have a direct interaction with a nuclear receptor, hepatocyte nuclear factor 4 alpha (HNF4A) and an indirect interaction with D-glucose (Figure 5). Mutant LOC26010 (SPATS2L) gene with SNP substitution, allelic variation: A/G (rs2881745) was shown to be associated with arthritis in humans [31]. Another significant gene, IGHM is a trans-membrane re-ceptor and has an important role in B cell development and signaling [32]. IGHM has a direct interaction with amyloid-βprecursor protein (APP), the latter in indirect interaction with IGF1 (Figures 4 and 5).
Of the 3 genes of interest, more has been published on the relationship between IGF1 and sleep [33-35]. Growth hormone is important, because reductions in this neuro-peptide are associated with increased sleep latency, as well as increases in wakening, and reduced duration of sleep [34]. Decreased levels of serum IGF1 are associated with excessive daytime sleepiness [33], and sleep apnea [34,35] in patients compared to healthy controls.
A growing number of studies show subclinical inflam-mation in IBS, therefore potentially relating to similar findings of a reduction of serum IGF1 in inflammatory bowel diseases [36,37]. The results of our study are rele-vant in that IGF1 is an important initiator of cellular repair processes, induces intestinal and linear growth, and may be linked to chronic inflammatory gastro-intestinal pathway [38,39]. Also, IGF1 was shown to have a protective effect against inflammation in the bowel [40] and found to be therapeutic in patients with inflam-matory bowel disease [40-42].
Conclusions
Participants with CAP reported poor sleep quality com-pared to healthy controls. The role of the BDNF Met allele as main effect on gene expression is not obvious although sleep and pain have an influence on differential gene expression. However, the interactions of Met allele with sleep quality or pain impacts differential gene expression. Poor sleep quality in those with CAP may be related to the down-regulation of IGF1, SPATS2L, and IGHG1. A larger sample size with balanced study designs in future studies is needed to better delineate the relationships between BDNF and sleep quality or BDNF and pain. Future research
targeting the associations of sleep quality in participants with co-morbid GI conditions is imperative.
Additional files
Additional file 1:Inclusion and Exclusion Criteria of Study Participants in Clinical Protocol.
Additional file 2: Table S1.Raw data on genotyping of BDNF (rs6265) processed on 384-Well reaction plate for 59 participants.Table S2.
Demographics and clinical characteristics of the sample cohort used for microarray experiments.Table S3.Microarray differentially expressed genes for the BDNF group with fold change criteria (>2.0 and < -2.0) and unadjusted p-values (< 0.05) for a subset of 26 participants.
Abbreviations
ACTB:β−ACTin; APP: Amyloid-βPrecursor Protein; BDNF: Brain-Derived Neurotrophic Factor; cDNA: Complementary DNA; CAP: Chronic Abdominal Pain; FDR: False Discovery Rate; GI: Gastrointestinal; HNF4A: Hepatocyte Nuclear Factor 4 Alpha; IBS: Irritable Bowel Syndrome; IGF1: Insulin-like Growth Factor 1; IGHG1: Immunoglobulin Heavy Constant Gamma 1 or Mu; IL-6: Interleukin 6; IPA: Interactive Pathway Analysis; mL: Milliliter;μL: Microliter;μg: Microgram; ng: Nanogram; PSQI: Pittsburgh Sleep Quality Index; qPCR: Quantitative real-time polymerase chain reaction; rhIGF1: Recombinant Human Insulin-like Growth Factor 1; rpm: Revolutions Per Minute; SNP: Single Nucleotide Polymorphism; SPATS2L: Spermatogenesis Associated, Serine-rich 2-like; SPSS: Statistical Product and Service Solution.
Competing interests
The authors declare that they have no competing interests.
Note:The opinions expressed herein and the interpretation and reporting of these data are the responsibility of the author(s) and in no way should be seen as an official recommendation, interpretation, or policy of the National Institutes of Health (NIH) or the United States Government.
Authors’contributions
WAH, MMH, ACM and SYR: study supervision, administrative, data collection and intellectual contributions. SYR: performed microarray data analysis, pathway analysis and interpretation. RSB, RL and NHF: data collection and conducted experiments. All authors contributed to manuscript development. All of the authors had approved the final, submitted draft of the manuscript.
Acknowledgements
The protocol (09-NR-0064) was approved by the Institutional Review Board at the National Institutes of Health. Clinicaltrial.gov # NCT00824941. We acknowledge the support and maintenance of Clinical Trials Database at NIH. Support was provided by the Intramural Research Program, National Institute of Nursing Research (to W.A.H., 1ZIANR000018-01-04, Summer Internship Program Awardee to R.S.B. and Intramural Research Training Award to R.L. and N.H.F.), National Institutes of Health, Department of Health and Human Services, Bethesda, Maryland, United States of America. We thank the assistance received from Benjamin Majors, Nayan Patel, Drs. R. Michael Peace, Arseima del Valle-Pinero, Dan Wang and Hyung-Suk Kim. We appreciate the comments on the manuscript from Drs. Joan K. Austin and Ann Cashion.
Author details
1Division of Intramural Research, National Institute of Nursing of Research,
National Institutes of Health, Department of Health and Human Resources, 10 Center Drive, Building 10, 2-1341, Bethesda, MD 20892, USA.2University of Washington, School of Nursing, Seattle, WA, USA.
Received: 8 August 2013 Accepted: 9 October 2014
References
2. Russo MW, Gaynes BN, Drossman DA:A national survey of practice patterns of gastroenterologists with comparison to the past two decades.J Clin Gastroenterol1999,29(4):339–343.
3. Drossman DA:The functional gastrointestinal disorders and the Rome III process.Gastroenterology2006,130(5):1377–1390.
4. Melotti RM, Samolsky-Dekel BG, Ricchi E, Chiari P, Di Giacinto I, Carosi F, Di Nino G:Pain prevalence and predictors among inpatients in a major Italian teaching hospital. A baseline survey towards a pain free hospital. Eur J Pain (London, England)2005,9(5):485–495.
5. Vallano A, Malouf J, Payrulet P, Banos JE:Prevalence of pain in adults admitted to Catalonian hospitals: a cross-sectional study.Eur J Pain (London, England)2006,10(8):721–731.
6. Thompson WG, Longstreth GF, Drossman DA, Heaton KW, Irvine EJ, Muller-Lissner SA:Functional bowel disorders and functional abdominal pain.Gut1999,45(Suppl 2):1143–1147.
7. Ashburn TT, Gupta MS:The IBS market.Nat Rev Drug Discov2006, 5(2):99–100.
8. Spinelli A:Irritable bowel syndrome.Clin Drug Investig2007,27(1):15–33. 9. Buxton OM, Marcelli E:Short and long sleep are positively associated with
obesity, diabetes, hypertension, and cardiovascular disease among adults in the United States.Social Sci Med (1982)2010,71(5):1027–1036. 10. Cirelli C, Tononi G:Is sleep essential?PLoS Biol2008,6(8 - e216):1605–1611. 11. Nicholl BI, Halder SL, Macfarlane GJ, Thompson DG, O’Brien S, Musleh M,
McBeth J:Psychosocial risk markers for new onset irritable bowel syndrome–results of a large prospective population-based study. Pain2008,137(1):147–155.
12. Maneerattanaporn M, Chey WD:Sleep disorders and gastrointestinal symptoms: chicken, egg or vicious cycle?Neurogastroenterol Motil2009, 21(2):97–99.
13. Heitkemper M, Charman AB, Shaver J, Lentz MJ, Jarrett ME:Self-report and polysomnographic measures of sleep in women with irritable bowel syndrome.Nurs Res1998,47(5):270–277.
14. Chen CL, Liu TT, Yi CH, Orr WC:Evidence for altered anorectal function in irritable bowel syndrome patients with sleep disturbance.Digestion2011, 84(3):247–251.
15. Roehrs TA:Does effective management of sleep disorders improve pain symptoms?Drugs2009,69(2 Suppl):5–11.
16. Bachmann V, Klein C, Bodenmann S, Schafer N, Berger W, Brugger P, Landolt HP:The BDNF Val66Met polymorphism modulates sleep intensity: EEG frequency- and state-specificity.Sleep2012,35(3):335–344. 17. Yu YB, Zuo XL, Zhao QJ, Chen FX, Yang J, Dong YY, Wang P, Li YQ:
Brain-derived neurotrophic factor contributes to abdominal pain in irritable bowel syndrome.Gut2012,61(5):685–694.
18. Lembo AJ, Neri B, Tolley J, Barken D, Carroll S, Pan H:Use of serum biomarkers in a diagnostic test for irritable bowel syndrome. Aliment Pharmacol Ther2009,29(8):834–842.
19. Buysse DJ, Reynolds CF 3rd, Monk TH, Berman SR, Kupfer DJ:The Pittsburgh sleep quality index: a new instrument for psychiatric practice and research.Psychiatry Res1989,28(2):193–213.
20. Alexopoulos GS, Glatt CE, Hoptman MJ, Kanellopoulos D, Murphy CF, Kelly RE Jr, Morimoto SS, Lim KO, Gunning FM:BDNF val66met polymorphism, white matter abnormalities and remission of geriatric depression.J Affect Disord2010,125(1–3):262–268.
21. Bath KG, Lee FS:Variant BDNF (Val66Met) impact on brain structure and function.Cogn Affect Behav Neurosci2006,6(1):79–85.
22. Teo JT, Bentley G, Lawrence P, Soltesz F, Miller S, Wille D, McHugh S, Dodds C, Lu B, Croft RJ, Bullmore ET, Nathan PJ:Late cortical plasticity in motor and auditory cortex: role of met-allele in BDNF Val66Met polymorphism.Int J Neuropsychopharmacol2014,17(5):705–713. 23. Bellini M, Gemignani A, Gambaccini D, Toti S, Menicucci D, Stasi C, Costa F,
Mumolo MG, Ricchiuti A, Bedini R, Bardoli ND, Marchi S:Evaluation of latent links between irritable bowel syndrome and sleep quality.World J Gastroenterol2011,17(46):5089–5096.
24. Elsenbruch S, Harnish MJ, Orr WC:Subjective and objective sleep quality in irritable bowel syndrome.Am J Gastroenterol1999,94(9):2447–2452. 25. Cargill M, Altshuler D, Ireland J, Sklar P, Ardlie K, Patil N, Shaw N, Lane CR,
Lim EP, Kalyanaraman N, Nemesh J, Ziaugra L, Friedland L, Rolfe A, Warrington J, Lipshutz R, Daley GQ, Lander ES:Characterization of single-nucleotide polymorphisms in coding regions of human genes. Nat Genet1999,22(3):231–238.
26. Choi MJ, Kang RH, Lim SW, Oh KS, Lee MS:Brain-derived neurotrophic factor gene polymorphism (Val66Met) and citalopram response in major depressive disorder.Brain Res2006,1118(1):176–182.
27. Shimizu E, Hashimoto K, Iyo M:Ethnic difference of the BDNF 196G/A (val66met) polymorphism frequencies: the possibility to explain ethnic mental traits.Am J Med Genet B Neuropsychiatr Genet2004,126B(1):122–123. 28. Tsai SJ, Cheng CY, Yu YW, Chen TJ, Hong CJ:Association study of a
brain-derived neurotrophic-factor genetic polymorphism and major depressive disorders, symptomatology, and antidepressant response.Am J Med Genet B Neuropsychiatr Genet2003,123B(1):19–22.
29. Nunez A, Rodrigo-Angulo ML, Andres ID, Garzon M:Hypocretin/Orexin neuropeptides: participation in the control of sleep-wakefulness cycle and energy homeostasis.Curr Neuropharmacology2009,7(1):50–59. 30. Danielsen JM, Sylvestersen KB, Bekker-Jensen S, Szklarczyk D, Poulsen JW,
Horn H, Jensen LJ, Mailand N, Nielsen ML:Mass spectrometric analysis of lysine ubiquitylation reveals promiscuity at site level.Mol Cell Proteomics 2011,10(3):M110 003590.
31. Consortium WTCC:Genome-wide association study of 14,000 cases of seven common diseases and 3,000 shared controls.Nature2007, 447(7145):661–678.
32. Polyak MJ, Li H, Shariat N, Deans JP:CD20 homo-oligomers physically associate with the B cell antigen receptor. Dissociation upon receptor engagement and recruitment of phosphoproteins and calmodulin-binding proteins.J Biol Chem2008,283(27):18545–18552.
33. Barcelo A, Barbe F, de la Pena M, Martinez P, Soriano JB, Pierola J, Agusti AG:Insulin resistance and daytime sleepiness in patients with sleep apnoea.Thorax2008,63(11):946–950.
34. Makino S, Fujiwara M, Handa H, Fujie T, Aoki Y, Hashimoto K, Terada Y, Sugimoto T:Plasma dehydroepiandrosterone sulphate and insulin-like growth factor I levels in obstructive sleep apnoea syndrome. Clin Endocrinol (Oxf )2012,76(4):593–601.
35. Lanfranco F, Motta G, Minetto MA, Ghigo E, Maccario M:Growth hormone/ insulin-like growth factor-I axis in obstructive sleep apnea syndrome: an update.J Endocrinol Invest2010,33(3):192–196.
36. Katsanos KH, Tsatsoulis A, Christodoulou D, Challa A, Katsaraki A, Tsianos EV: Reduced serum insulin-like growth factor-1 (IGF-1) and IGF-binding protein-3 levels in adults with inflammatory bowel disease.Growth Horm IGF Res2001,11(6):364–367.
37. Street ME, de’Angelis G, Camacho-Hubner C, Giovannelli G, Ziveri MA, Bacchini PL, Bernasconi S, Sansebastiano G, Savage MO:Relationships between serum IGF-1, IGFBP-2, interleukin-1beta and interleukin-6 in inflammatory bowel disease. Hormone Res2004,61(4):159–164.
38. Bortvedt SF, Lund PK:Insulin-like growth factor 1: common mediator of multiple enterotrophic hormones and growth factors.Curr Opin Gastroenterol2012,28(2):89–98.
39. Theiss AL, Fruchtman S, Lund PK:Growth factors in inflammatory bowel disease: the actions and interactions of growth hormone and insulin-like growth factor-I.Inflamm Bowel Dis2004,10(6):871–880.
40. Fordjour L, D’Souza A, Cai C, Ahmad A, Valencia G, Kumar D, Aranda JV, Beharry KD:Comparative effects of probiotics, prebiotics, and synbiotics on growth factors in the large bowel in a rat model of formula-induced bowel inflammation.J Pediatr Gastroenterol Nutr2010,51(4):507–513. 41. Eivindson M, Gronbaek H, Skogstrand K, Thorsen P, Frystyk J, Flyvbjerg A,
Dahlerup JF:The insulin-like growth factor (IGF) system and its relation to infliximab treatment in adult patients with Crohn’s disease.Scand J Gastroenterol2007,42(4):464–470.
42. Savage MO:Growth-promoting hormone therapy in inflammatory bowel disease.J Pediatr Gastroenterol Nutr2010,51(Suppl 3):S135–S136.
doi:10.1186/s12920-014-0061-1