economicS, and management StudieS (SJBem)
DOI: 10.12816/0051207 VOL. 6, NO. 9, 2018
10
NBL Research Article www.singaporeanjbem.com Research Article
How to measure banks’ efficiency? Application of data
envelopment approach and frontier efficiency analysis: An
overview
Fentaw Leykun Assist. Professor
Accounting And Finance Department, Bahir Dar University, Ethiopia
Abstract
The aim of this paper is to review why and how banks' performance could be measured by observing the findings of different scholars from national and international journal articles. It has been observed that the rationale of measuring bank performance is not questionable because the main reason for the establishment of banks is to mobilize the scarce resources of a given economy from surpluses to deficit areas to maintain the smooth, efficient and effective accomplishment of economic activities. Thus, different tools are being applied by different scholars to measure the banks' efficiency which includes; the traditional financial accounting ratio analysis and frontier efficiency analysis. Studies on the area suggest that financial accounting measures are very primitive and are being obsolete as it lacks to incorporate the risk factor, industry and macroeconomic factors which severely affect the performance of banks. Virtually these deficiencies are currently resolved by the application of frontier analysis, especially data envelopment and stochastic frontier analysis with their own merits and demerits. It is also recommended that scholars can use either of these approaches with their own logical preference and circumstances as well.
Keywords: efficiency, chance-constrained data envelopment analysis, data envelopment analysis, stochastic frontier analysis
1. Introduction
11
violated constraints. Besides (Tsionas, 2003, 2012) argued that Stochastic frontier models and data envelopment analysis (DEA) models have proved extremely useful in the measurement of the technical efficiency of production units. The two approaches are traditionally thought to be competing. Stochastic frontier models make assumptions about the functional form of production or cost functions and can deal effectively with the presence of noise in the data, whereas DEA models make no assumptions about the functional forms but cannot deal effectively with measurement error. DEA methods are organized around linear programming, while stochastic frontier models require econometric estimation, either frequentist or Bayesian (Anderson et al., 1999; George Assaf, 2012; Odeck & Bråthen, 2012; Odukoya, 2007). Efficiency measurement with stochastic frontier models is troublesome in many situations because decomposing the overall error term into a two-sided and a one-two-sided disturbance terms may be problematic. The reason is that when the noise-to-signal ratio is relatively high, the overall error term would appear to be approximately symmetric in which case identification of the efficiency component would be problematic. See Tsionas (1999) for an analysis in the context of stochastic frontiers with gamma distributed inefficiency. Thus, the purpose of this paper is to comprehensively and critically review the existing theoretical and empirical literature on how to measure bank efficiency, which of the rudimentary models mentioned here above is appropriate and in which context?
2. the objective of the review
The objective of the review on this area is mainly to simplify the following dilemmas:
The rationale for measuring bank efficiency?
How can we measure banks’ efficiency?
o Frontier efficiency analysis/measurement
Non-parametric approach: Data envelopment analysis (DEA)
Parametric approach: Stochastic frontier analysis (SFA)
3. Methodology
Since the main aim of this paper is to critically review theoretical and empirical studies on the two common bank efficiency measurement modalities, DEA & SFA, and justify their customization, basically the paper relies on the information from theories and empirical literature from the existing stock of knowledge. Here, quality is maintained via focusing on those materials from reliable sources such as reputable journals and Book repositories.
4. Theoretical overview: Banking efficiency
4.1 Theoretical foundations of bank efficiency
12
of different social classes. According to Marxists, productivity growth without simultaneous wage rise increases the extraction of surplus value from the working class.
Apart from above-mentioned theories, the focus on economic efficiency is also given by welfare economics, which attempts to maximize social welfare by examining the economic activities of the individuals. The first fundamental theorem of this theory is that competitive markets are efficient and lead to a unique and optimal allocation of resources (allocative efficiency). Pareto efficiency as a measure of social welfare is used by many scholars as their efficiency goal. According to this measure, a situation is optimal only if no individuals can be made better off without making someone else worse off. Contrary, situations are considered to have distributive efficiency when goods are distributed to those individuals who can gain the most utility from them. Reading of Samuelson and Nordhaus (1995) confirms that competition of the market mechanism assures efficiency and everyone’s welfare. They admit, however, that a perfect and absolutely efficient competitive mechanism has never existed and never will.
Looking specifically at banks there is a wide range of definitions of efficiency in the literature. The term is approached from various angles. Efficiency also measures the use of the specific goals as the basis for determining efficiency. Efficiency is analyzed from the point of economic theory and organization theory. According to Stepien (2004), it is possible to investigate efficiency at the level of the bank or its organizational units, and for particular bank’s activities. According to Drucker, who explains the difference between efficiency and effectiveness, “efficiency means doing things right, and effectiveness means doing the right things". The pure economic concept of efficiency assumes that efficiency is the ratio of total output goods with respect to input resources. Efficiency is regarded to be higher with the higher level of this ratio. Rose (1997) defines efficiency as an indicator showing the ability of bank managers and its staff to keep the rate of increase in revenues and income at the level that exceeds the rate of increase in operational costs. Up to Jaworski (2006), efficient activities are those activities which not only lead to achieving intended goals but also assure economic benefits higher than inputs.
Literature suggests as different techniques have been employed to estimate efficiency. Most economists generally accept the principle of rational behavior and analyze banks utilizing the neo-classical theory of the firm. Such an approach makes possible to use traditional economic measures of efficiency (inputs, outputs, cost constraints, etc.). However, in the reality banks operate under uncertainty and imperfect information. This suggests that banks should not be assessed on the basis of traditional efficiency measures alone and that assessing their overall performance requires assessing both efficiency and risk factors. Banks strategy goal should be risk-adjusted profit maximization. Capiga (2003) presents different possible views on bank efficiency, which include distinction between: (1) Organizational efficiency which deals with organization goals, its resources, internal and external environment, and business performance through time, (2) Financial efficiency which examines those items that are financial in nature (included in banks financial statements), for example, by use of financial ratios, cost efficiency which determines how close bank’s costs lie to the efficient cost frontier for given inputs and their ratios (technology). Rogowski (1998a) points out those studies on measuring bank efficiency have focused on two alternative approaches: Analysis of technical efficiency and Analysis of scale and scope efficiency. 4.2 The concept of Technical efficiency
13
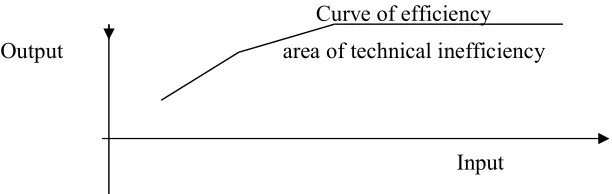
of overall technical efficiency (OTE). The OTE measure helps to determine inefficiency due to the input/output configuration as well as the size of operations. Farrell (1957) defines technical efficiency as a firm’s success in producing maximum output from a given set of inputs (i.e. producing on the technical frontier). The production function can be estimated from sample data employing either non-parametric (mathematical programming) or parametric (econometrics) approach. Technical efficiency is evaluated by the unit's distance from the (best practice) production frontier.
Technical efficiency index can be estimated from 0 to 100%. Index equal to 100% represents full efficiency (the production unit belongs to the production frontier), whereas the score below 100% indicates some relative inefficiency.
Curve of efficiency Output area of technical inefficiency
Input
Figure 1: Efficiency frontier and technical inefficiency area
Rogowski (1998b) marks that there are two measures of technical efficiency, which are primarily used in the literature: output-oriented and input-oriented technical efficiency.
Input-oriented technical efficiency or X-efficiency refers to selecting the appropriate inputs, i.e. the optimal scale and mix of inputs, given the output bundle. One of the most common measures applied is cost X-efficiency. In output-oriented technical efficiency, the focus is on increasing output without changing the inputs used. It is, among others, used for revenue analysis. Measuring technical efficiency is a very popular approach used to estimate firms' efficiency.
4.3 Analysis of scale and scope efficiency
In data envelopment analysis (DEA), OTE measure has been decomposed into two mutually exclusive and non-additive components: pure technical efficiency (PTE) and scale efficiency (SE). This decomposition allows an insight into the source of inefficiencies. The PTE measure is obtained by estimating the efficient frontier under the assumption of variable returns-to-scale. It is a measure of technical efficiency without scale efficiency and purely reflects the managerial performance to organize the inputs in the production process. Thus, PTE measure has been used as an index to capture managerial performance. The ratio of OTE to PTE provides SE measure. The measure of SE provides the ability of the management to choose the optimum size of resources, i.e., to decide on the bank’s size or in other words, to choose the scale of production that will attain the expected production level. Inappropriate size of a bank (too large or too small) may sometimes be a cause of technical inefficiency.
14 5. Why we measure banks’ efficiency?
According to Kumar & Gulati (2008), while dealing with banking efficiency analyses, the very first question which strikes in the mind of the research analysts is that why regulators, customers, managers, and stakeholders bother about the relative efficiency of banks? The answers of this question will be different depending upon the perspectives of interested parties.
From the regulators’ perspective, inefficient banks are riskier and have a higher likelihood of failure. Further, the efficiency of banks is directly linked to the productivity of the economy. Without a sound and efficiently functioning banking system, the economy cannot function smoothly and efficiently. When banking system fails, the whole of a nations’ payments system is in jeopardy. From the point of view of customers, only efficient banks can offer better services at reasonable prices. The standpoint of stakeholders is that only efficient banks ensure reasonable returns. The perspective of bank managers is that in a dynamic and competitive market environment, only efficient banks will survive and maintain their market share, and inefficient ones will eventually be eliminated through Darwinian selection. The efficient banks are better able to compete because of their lower operating costs and can steal business away from less efficient banks.
Berger & Humphrey (1997) assert that the whole idea of measuring bank performance is to separate banks that are performing well from those which are doing poorly. They further indicated that "evaluating the performance of financial institution can inform government policy by assessing the effects of deregulation, mergers and market structure on efficiency". Bank regulators screen banks by evaluating banks' liquidity, solvency and overall performance to enable them to intervene when there is need and to gauge the potential for problems (Casu et al, 2006). On a micro‐level, bank performance measurement can also help improve managerial performance by identifying best and worst practices associated with high and low measured efficiency.
In sum, the relative efficiency of banks is always a matter of serious interest to the regulators, customers, stakeholders, and managers.
6. Empirical studies
6.1determinants of banks’ efficiency
Internal (bank-specific) and external (macroeconomic environment) factors determining banks’
efficiency (Siudek, 2008). According to Almazari (2013), most reviewed studies on bank-specific
characteristics are represented by; size, non performing loan ratio (NPL), capital adequacy, non interest income to total asset, (NII/TA), noninterest expenses to total assets, (NIE/TA), profitability measures indicated by ROA and NIM, similarly all of these bank-specific characteristics were supported by different researchers with contradicting results in relationship with bank efficiency (Raphael, 2013).
The internal factors such as the management decisions on (balance sheets and/or profit and loss accounts), size of the bank, capital, risk management, and expenses management affect the profitability of the bank directly because most of these factors remain confidential. Other internal factors, such as credit or liquidity are considered as bank-specific factors, which closely related to bank management, especially the risk management. The need for risk management in the banking sector is inherent in the nature of the banking business. Low asset quality and poor liquidity are the two major causes of bank failures and represented as the key risk sources in terms of credit and liquidity risk and attracted great attention from researchers to examine their impact on bank profitability.
15
cyclical output, and variables that represent market characteristics such as market concentration, industry size, and ownership status.
6.2Banks’ efficiency measurement proxies
Nowadays, especially in the light of recent financial crisis occurring in some countries, measurement, and assessment of banks' efficiency has become one of the most important issues concerning banks' market-related activities. Globalization of the financial markets and growing competition in the banking sector has posed new challenges in research on the efficiency of financial institutions, including banks (Siudek, 2008). The two common tools (Financial accounting ratios analysis, Frontier efficiency analysis) applied to measure the banks’ efficiency are discussed below.
6.2.1 Financial accounting ratios analysis/ the conventional ratio analysis
The main purpose of this paper is to review how to measure banking efficiency using the common frontier approaches that have been utilized extensively in the applied research on the banking efficiency. Earlier, the regulators, managers, investors, and analysts in the banking sector generally relied on financial accounting ratios to assess the relative efficiency of banks. The main reasons for using ratios as a tool for performance evaluation are to allow comparison among similar-sized banks and to control for sector-specific characteristics permitting the comparison of individual
bank's ratios with some benchmark for the sector (Halkos and Salamouris, 2004). Many different
ratios have been employed to examine various aspects of a bank’s performance. For instance, Intermediation cost, Interest spread, Operating expenditure, Cost to income ratio, Return on Assets, Return on Equity, Business per employee, Income per employee and Business per branch, among others are some commonly used accounting ratios for assessing the financial performance of the banking units.
Though financial accounting ratios are simple to use and relatively easy to understand, but their use to measure bank performance is subject to many criticisms. The financial ratios don't take account the differences in the business undertaken by different banks, which will, in turn, be reflected in
different combinations of inputs and outputs (Tripe, 2004). DeYoung (1998) suggests that blind
pursuit of accounting based benchmarks might reduce a bank’s cost efficiency by cutting back on those expenditures necessary to run the bank properly. Further, Berger et al. (1993a) note that financial ratios may be misleading because they do not control for product mix or input prices.
On the other hand, the main advantage of FRA is its ability and effectiveness in distinguishing high-performance banks from others and the fact that FRA compensates for disparities and controls for any size effect on the financial variables being studied (Samad, 2004). Additionally, financial ratios can be used to identify a bank's specific strengths and weaknesses as well as providing detailed
information about bank profitability, liquidity, and credit quality policies (Hempel et al, 1994;
Dietrich, 1996). FRA permits a historical sketch of bank returns and risks which Hempel et al,
(1994) suggests presents an opportunity to evaluate the past performance of the bank which is an important step for planning for future performance. Although accounting data in financial statements is subject to manipulation and financial statements are backward looking, they are the only detailed information available on the bank’s overall activities (Sinkey, 2002). Furthermore, they are the only source of information for evaluating the management’s potential to generate satisfactory returns in future.
16
Owing to aforementioned intricacies of the financial accounting ratios, the frontier efficiency analysis gained tremendous popularity in measuring the efficiency of banking industry. Bauer et al. (1998) suggested that frontier efficiency analysis is superior to the financial ratios' analysis. The frontier efficiency approach is based on the recognition that some banks will not be as successful as others in meeting their objectives. The technique measures the performance of each bank in an industry relative to the efficient frontier consisting of dominant banks in the industry. A bank is classified as fully efficient (with efficiency score equals to 1) if it lies on the frontier and inefficient (with efficiency score ranges from 0 to 1) if its outputs can be produced more efficiently by another set of banks. It is significant to note here that each frontier technique involves various models for deriving a measure of best-practice for the sample of banks and then determine how closely individual banks lie relative to this standard. The best practice is usually in the form of an efficient frontier that is estimated using econometric or mathematical programming techniques. The frontier techniques summarize bank performance in a single statistic that controls for the differences among banks in a sophisticated multidimensional framework that has its roots in economic theory. Further, frontier efficiency measures dominate the traditional ratio analysis in terms of developing meaningful and reliable measures of bank performance. Owing to these features of frontier methodology, the conventional ratio analysis is becoming obsolete.
The available frontier efficiency approaches can be grouped into two major estimation techniques: Parametric and Non-parametric approaches.
In parametric approaches, a specific functional form of the production function like Cobb-Douglas and transcendental logarithmic (Tran’s log), etc. is required to specify a priori. The efficiency is then assessed in relation to this function with constant parameters and will be different depending on the chosen functional form. On the other hand, non-parametric approaches do not specify a functional form, but nevertheless require certain assumptions about the structure of production technology (e.g., free disposability1, convexity2, etc.). In the non-parametric approaches, a separate mathematical programming problem is needed to solve for obtaining the efficiency scores for the individual banks included in the sample.
17
I. Figure: Frontier approaches for measuring banking efficiency
6.2.2.1 Non-parametric approach: Data envelopment analysis (DEA)
DEA is a linear (mathematical) programming based method first originated in the literature by Charnes et al. (1978) as a reformulation of the Farrell’s (1957) single-output, single-input radial measure of technical efficiency to the multiple outputs, multiple-input case. DEA calibrates the level of technical efficiency (TE) on the basis of an estimated discrete piecewise frontier (or so-called efficient frontier or best-practice frontier or envelopment surface) made up by a set of Pareto-efficient decision-making units (DMUs). In all instances, these Pareto-Pareto-efficient banks located on the efficient frontier, compared to the others, use minimum productive resources given the outputs (input-conserving orientation), or maximize the output given the inputs size (output-augmenting orientation), and are called the best-practice performers or reference units or peer units within the
Frontier efficiency
measurement approaches
Non-parametric
approach Parametric
approach
Data
envelopment analysis (DEA)
Free disposal hull analysis (FDH)
Stochastic frontier
Thick frontier analysis (TFA)
Distribution-free approach DFA)
18
sample of banks. These Pareto-efficient banks have a benchmark efficiency score of unity that no individual bank's score can surpass. In addition, it is not possible for the Pareto-efficient unit to improve any input or output without worsening some other input or output. It is significant to note that the efficient frontier provides a yardstick against which to measure the relative efficiency of all other banks that do not lie on the frontier. The banks which do not lie on the efficient frontier are deemed relatively inefficient (i.e., Pareto non-optimal banks) and receives a TE score between 0 and 1. The efficiency score of each bank can be interpreted as the radial distance to the efficient frontier. In short, the DEA forms a non-parametric surface frontier (more formally a piecewise-linear convex isoquant) over the data points to determine the efficiency of each bank relative to this frontier.
DEA has an advantage of computing efficiency scores in multiple-inputs and multiple-outputs production setting without specifying any functional form and distribution of the inefficiency term, but makes no room for noise and lacks hypothesis testing.
6.2.2.2 Parametric approach: Stochastic frontier analysis (SFA)
Another widely used frontier efficiency methodological framework used in applied banking efficiency analyses is stochastic frontier analysis (SFA) which was independently proposed by
Aigner et al. (1977) and Meeusen and Broeck (1977). Coelli et al. (2003) listed out the main
advantages of SFA methodology as:
(i) environment variables are easier to deal with,
(ii) it allows us to conduct statistical tests of hypotheses concerning any parameter
restrictions associated with economic theory, and
(iii) Allows an easier identification of outliers. On the other hand, the main disadvantages of
SFA are that estimation results are sensitive to distributional assumptions on the error terms, and it requires large samples for robustness, so it is very demanding regarding data requirements.
The stochastic frontier involves two random components, one associated with the presence of technical inefficiency and the other being a traditional random error. Though the efficiency estimates from SFA accommodate the noise, yet these estimates are very sensitive to the choice of functional form and distribution of the inefficiency term.
7. What determines the best approaches to measure banks’ efficiency?
It has been observed that the frontier efficiency measurement methods made the traditional financial accounting ratios' analysis completely obsolete and outdated. From the deep inspection of literature, I note that data envelopment analysis (DEA) and stochastic frontier analysis (SFA) are the predominant frontier approaches that have attracted many empirical studies. Both the approaches have their distinct advantages and disadvantages. DEA has an advantage of computing efficiency scores in multiple-inputs and multiple-outputs production setting without specifying any functional form and distribution of the inefficiency term, but makes no room for noise and lacks hypothesis testing. On the other hand, though the efficiency estimates from SFA accommodate the noise, yet these estimates are very sensitive to the choice of functional form and distribution of the inefficiency term. In sum, no agreement has been reached on the superiority of one method over the others, and choice of a particular method is primarily guided by the data considerations and an individual preference.
8. Reflections
19
efficiency, improve managerial performance by identifying best and most horrible practices associated with high and low measured efficiency. Hence, all the aforementioned importance of measuring bank efficiency/ performance is possible solely through the application of appropriate measurement tools such as frontier analysis approach as it compromises the deficiency of traditional financial accounting approaches which lacks to consider different combinations of inputs and outputs in view of the fact that banks' efficiency can be affected by both bank specific, industry-specific and macroeconomic variables. The reviewed studies show the existence of significant difference in efficiency scores between CCDEA and Stochastic frontier production function. Thus, a bank is fully efficient (with efficiency score equals to 1) if it lies on the frontier and inefficient (with efficiency score ranges from 0 to 1) if its outputs can be produced more efficiently by another set of banks. It is significant to note here that each frontier technique involves various models for deriving a measure of best-practice for the sample of banks and then determine how closely individual banks lie relative to this standard. But my argument here is that how could it be, 100% efficient bank? Samuelson and Nordhaus (1995) confirm that competition of the market mechanism assures efficiency and everyone’s welfare. They admit, however, that a perfect and absolutely efficient competitive mechanism has never existed and never will. Are the assumptions realistic? How it works on the ground? Is that economically sensible to take the dominate banks frontier/efficiency as benchmark? Though these dilemmas, it is the best measure contrary to the traditional financial accounting ratio analysis, is a new thinking and researchers tend to exploit practically since 1970s.
References
Anderson, R. I., Fish, M., Xia, Y., & Michello, F. (1999). Measuring efficiency in the hotel
industry: A stochastic frontier approach. International Journal of Hospitality Management,
18(1), 45–57. https://doi.org/10.1016/S0278-4319(98)00046-2
Aigner, D.J., C.A.K. Love11 and P. Schmidt, 1977, Formulation and estimation of stochastic frontier production function models, Journal of Econometrics 6, 21-37.
Almazari, A.A.(2013) “Impact of Internal Factors on Bank Profitability:” Journal of Applied Finance & Banking, vol. 4, no. 1,
Approach: International Journal of Business and Management; Vol. 8, No. 4; 2013 ISSN 1833-3850 E-ISSN 1833-8119 Published by Canadian Center of Science and Education
Barros, C.P. & Mascarenhas, M.J. (2005) “Technical and Allocative Efficiency in a Chain of Small Hotels.” Hospitality Management 24(3): 415-36.
Bauer, Paul W., Allen N. Berger, Gary D. Ferrier, and David B. Humphrey, 1998, Consistency Conditions for Regulatory Analysis of Financial Institutions: A Comparison of Frontier Efficiency Techniques, Journal of Economics and Business 50, 85-114.
Berger, A. N., Hunter, W. C., Timme, S. G. (1993). The efficiency of financial institutions: A review and preview of research past, present, and future. Journal of Banking and Finance, vol. 17, p. 221–249
Berger, A.N. and Humphrey, D.B. (1997). Efficiency of financial institutions: international survey and directions for future research. European Journal of Operational Research, Vol 98, pp.175-212.
Bhattacharyya, A., Lovell, C., & Sahay, P. (1997) “The Impact of Liberalization on the Productive Efficiency of Indian Commercial Banks.” European Journal of Operational Research 98(2): 332-345.
Capiga, M. (2003). Ocena dzialalnosci placowki operacyjnej banku: dylematy metodologiczne i praktyczne. Katowice: Wydawnictwo Akademii Ekonomicznej w Katowicach, p. 57–61. Casu, B., Molyneux, P. And Girardone, C. (2006). Introduction to Banking, Prentice Hall/ Financial
20
Charles, A.: Cooper, W. W. & Rhodes, E. (1978). Measuring the efficiency of decision-making units. European Journal of Operational Research. 2. 429-444.
Coelli, T., A. Estache, S. Perelman, and S. Trujillo (2003). A Primer on Efficiency Measurement for Utilities and Transport Regulators. Washington: WBI Development Studies.
Chen, C. F. (2007). Applying the stochastic frontier approach to measure hotel managerial
efficiency in Taiwan. Tourism Management, 28(3), 696–702.
https://doi.org/10.1016/j.tourman.2006.04.023
Chames A and Cooper WW (1959). programming. Mngt Sci 15: 73-79.
Chen, T. Y. (2002). A comparison of chance-constrained idea and stochastic frontier analysis: Bank
efficiency in Taiwan. Journal of the Operational Research Society, 53(5), 492–500.
https://doi.org/10.1057/palgrave.jors.2601318
Dietrich, J. (1996). Financial Services and Financial Institutions: Value Creation in Theory and Practice Prentice Hall.
DeYoung, R. & Hasan, I (1998). The performance of de novo commercial banks: a profit efficiency approach. Journal of Banking and Finance. 22. 565-587.
Farrell, M. J. (1957). the measurement of productive efficiency. Journal of royal statistical society series, 253-81. http://dx.doi.org/10.2307/2343100
Gwahula, R. (2013) "Bank-specific, industry-specific and macroeconomic determinants of bank efficiency in Tanzania:" A two-stage analysis. European Journal of Business and Management Vol.5, No.2, 2013
George Assaf, A. (2012). Benchmarking the Asia Pacific tourism industry: A Bayesian combination
of DEA and stochastic frontier. Tourism Management, 33(5), 1122–1127.
https://doi.org/10.1016/j.tourman.2011.11.021
Glass, A. J., Kenjegalieva, K., & Sickles, R. C. (2016). A spatial autoregressive stochastic frontier
model for panel data with asymmetric efficiency spillovers. Journal of Econometrics, 190(2),
289–300. https://doi.org/10.1016/j.jeconom.2015.06.011
Halkos, G.E., Salamouris, D. S. (2004). Efficiency measurement of the Greek commercial banks with the use of financial ratios: a data envelopment analysis approach. Management Accounting Research, vol. 15, p. 201–224.
Hempel, G., Simonson, D., and Coleman, A. (1994). Bank Management: Text and Cases. 4th
Edition, John Wiley & Sons, Inc.
Jaworski, W. L., Zawadzka, Z. (2006). Bankowosc. Podrecznik Akademicki. Warszawa: Poltext, p. 604–611.
Joseph, P. & Loretta, J. (2008) Efficiency in Banking: Theory, Practice, and Evidence. Hughes Rutgers University and. Master Federal Reserve Bank of Philadelphia and the Wharton School, University of Pennsylvania.
Kumar, S and Gulati, R. (2008). An Examination of Technical, Pure Technical, and Scale Efficiencies in Indian Public Sector Banks using Data Envelopment Analysis. Eurasian Journal of Business and Economics.1 (2): 33-69
Meeusen, W. and J. van den Broeck, 1977, Efficiency estimation from Cobb-Douglas production functions with composed error, International Economic Review 18. 435-444.
Raphael1, G. (2013) Efficiency of Commercial Banks in East Africa: A Non-Parametric
Rogowski, G. (1998a). Metodologia analog efektywnosci i efektu skali bankow. Bank i Kredyt, No. 11, p. 28–37.
Rogowski, G. (1998b). Metody analizy i oceny banku na potrzeby zarządzania strategicznego. Poznań: Wydawnictwo Wyzszej Szkoły Bankowej, Poznan, p. 61–67
Rose, P. (1997). Zarządzanie bankiem komercyjnym: wytwarzanie i sprzedaz uslug finansowych T.1. Warszawa: Zwiazek Banków Polskich, Warszawa, p. 152–154, 418.
Samuelson, P.A., Nordhaus, W.D. (1995). Ekonomia. Warszawa: Wydawnictwo Naukowe PWN. Sathye, M. (2001) “X-Efficiency in Australian Banking: An Empirical Investigation.” Journal of
21
Siudek, T. (2008). Theoretical Foundations of Banks Efficiency and Empirical Evidence from Poland Warsaw University of Life Sciences, Department of Economics and Organization of Enterprises Socialiniai tyrimai / Social Research. 2008. Nr. 3 (13), 150–158 ISSN 1392-3110 Smith, A. (1976). An Inquiry into the Nature and Causes of the Wealth of Nations. Chicago:
University of Chicago Press.
Sinkey, J. (2002). Commercial Bank Financial Management: In the Financial- Services Industry
6th Edition Prentice Hall, Upper Saddle River, NJ.
Stepien, K. (2004). Konsolidacja a efektywnosc bankow w Polsce. CeDeWu, Warszawa, p. 128– 136.
Samad, A. (2004). Bahrain Commercial Bank’s Performance during 1994-2001. Credit and
Financial Management Review 10(1) pp 33-40.
Odeck, J., & Bråthen, S. (2012). A meta-analysis of DEA and SFA studies of the technical efficiency of seaports: A comparison of fixed and random-effects regression models.
Transportation Research Part A: Policy and Practice, 46(10), 1574–1585.
https://doi.org/10.1016/j.tra.2012.08.006
Odukoya, A. O. (2007). Theoretical and Empirical Issues in Privatisation : A Comparative Study of
the British and Nigerian Experience, 14(1), 25–43.
Tripe, D. W. L. (2004). How can we really measure bank efficiency? Paper presented at 9 th AIBF Banking and Finance Conference, Melbourne, 30 September – 1 October.
Tsionas, E. G. (2003). Combining DEA and stochastic frontier models: An empirical Bayes
approach. European Journal of Operational Research, 147(3), 499–510.
https://doi.org/10.1016/S0377-2217(02)00248-5
Tsionas, E. G. (2012). Maximum likelihood estimation of stochastic frontier models by the Fourier
transform, 170, 234–248. https://doi.org/10.1016/j.jeconom.2012.04.001
Zheng, X. Bin, & Park, N. K. (2016). A Study on the Efficiency of Container Terminals in Korea
and China. Asian Journal of Shipping and Logistics, 32(4), 213–220.