www.ijper.org
Formulation and Characterization of Controlled
Release Flurbiprofen Microsponges Loaded in Gels
Ankita Vernekar*, Rajashree Gude, Nidhi Ghadi, Steffi Parab, Akshata Shirodker Department of Pharmaceutics, Goa College of Pharmacy, 18th June Road, Panaji, Goa, INDIA.
ABSTRACT
Objective: The main objective of this study was to formulate transdermal gels containing Flurbiprofen microsponges for controlled drug delivery. Methods: Microsponges containing Flurbiprofen and ethylcellulose were prepared by the quasi-emulsion solvent diffusion method. By varying the amount of drug and the polymer, seven batches of microsponges were formulated. Microsponges formed were characterized for surface morphology, thermal behavior, drug content, particle size, X-ray powder diffraction studies and in vitro drug dissolution studies. Results: SEM confirmed the spherical and the porous nature of the microsponges. Formulation F7 showed highest drug content and in vitro drug release of 92.74% at the end of 8 h and all the formulations followed zero order kinetics. Based on the results of drug content and in vitro release studies, formulation F4 was selected as the optimized batch and was incorporated into a carbopol gel base. The in vitro drug release from the microsponge gel was found to be extended over a longer period of time as compared to that from the marketed Flurbiprofen gel.
Conclusion: Formulating Flurbiprofen in microsponges facilitated the controlled release of drug for long period of time thus eliminating the need of frequent dosing.
Key words: Flurbiprofen, Topical, Porous, Microsponges, Controlled release, Quasi-emulsion solvent diffusion.
DOI: 10.5530/ijper.53.2s.48
Correspondence:
Miss. Ankita Vernekar,
Goa College of Pharmacy, 18th June Road, Panaji- 403001, Goa, INDIA. Phone: +91-8390564502 E-mail: ankita_vernekar@ ymail.com
INTRODUCTION
NSAIDs are the category of drugs used in the long-term treatment of rheumatoid arthritis and osteoarthritis. These drugs, when administered orally cause systemic side effects such as gastric ulceration and irritation; but when administered topically, the systemic side effects are bypassed thereby improving the patient compliance. The conventional topical gels prevent first pass metabolism of the drug and provide delivery of drug at a predetermined rate. However, the excess amount of drug gets accumulated on the skin leading to irritation. The micro-sponge technology is an alternative that releases the active ingredients slowly for the extended period of time thereby reducing the irritation of drugs without reducing their efficacy.1
Submission Date: 24-07-2018;
Revision Date: 31-10-2018;
Accepted Date: 18-01-2019 Flurbiprofen is an NSAID used for the
symptomatic treatment of rheumatoid arthritis. It belongs from BCS Class ΙΙ category which has high permeability and low solubility. The half-life of Flurbiprofen is 4.7 h and requires frequent dosing, but its chronic oral intake can result in systemic side effects such as gastric irritation and gastric bleeding.2
MATERIALS AND METHODS
Materials
Flurbiprofen was obtained as a gift sample from FDC- Roha (Maharashtra, India). Ethylcellulose was obtained as a gift sample from Colorcon, Goa. All the excipients and solvents used were of analytical grade.
Methods
Preparation of microsponges
Microsponges were prepared by quasi-emulsion solvent diffusion technique. The inner phase was prepared by first dissolving ethylcellulose in 5ml of the solvent, followed by an appropriate amount of the drug. Dibutyl phthalate was added as a plasticizer to the inner phase system. The outer phase was prepared by dissolving PVA by application of heat in 50ml of deionized water as the continuous phase. The inner phase was added dropwise to the outer phase slowly under two bladed overhead stirrer rotated at 500rpm for 5 h till the inner solvent was completely diffused out of the system and microsponges were formed. The formed powdered microsponges were then filtered using Whatman filter paper, dried completely and weighed to calculate the production yield. Seven formulations of microsponge systems were formulated as shown in Table 1.4
Characterization and evaluation of microsponge formulations
Visual appearance
All the developed formulations were evaluated for an appearance by visual observation.
Surface morphology by SEM
To illustrate the porous structure of the microsponges, the samples were lightly sprinkled on a double adhesive plate stuck to a metal stub. The stubs were then coated with platinum/palladium alloy and placed in a scanning electron microscope (Zeiss EVO 18). The samples were then scanned randomly at the acceleration voltage of 10.00 kV and photomicrographs were taken.5
Production yield
Production yield was calculated as weight of micro-sponges recovered from each preparation in relation to the weight of the sum of the starting material (theoretical yield). It was calculated using the following
formula:-Percentage yield yield
Theoretical yield drug polyme =
+ Practical
( rr)×100
Entrapment efficiency and drug content
The weighed samples of drug loaded microsponges (equivalent to 10 mg of drug) were dissolved in 100 ml phosphate buffer pH 7.4, under ultrasonication. The samples were filtered using 0.45µ membrane filter and the absorbance of samples was read at 247 nm against blank using UV spectrophotometer (Labindia UV 3092). The actual drug content and entrapment efficiency were calculated as given below. All analyses were carried out in triplicate.6-7
Actual drug content M
M
act
ms
(%)= ×100
Encapsulation efficiency M
M
act
the
(%)= ×100
where, Mact is the actual Flurbiprofen content in a weighed quantity of microsponges; Mms is the weighed quantity of powder of microsponges and Mthe is the theoretical amount of Flurbiprofen in the microsponges calculated from the quantity added in the process. Fourier transform infrared spectroscopy (FTIR)
The IR spectra of the drug, physical mixture of drug and polymer at the ratio of 1:1 and selected microsponge formulation were recorded using Shimadzu Model to check the compatibility of the excipients.
Differential Scanning Calorimetry (DSC)
Thermogram of Flurbiprofen microsponges was taken using differential scanning calorimeter (Shimadzu DSC 60+). Microsponge samples were kept in an aluminum
Table 1: Composition of microsponge formulations.
Formulation Code F1 F2 F3 F4 F5 F6 F7
Drug: Polymer Ratio 1:1 2:1 3:1 4:1 5:1 6:1 7:1
Drug (mg) 50 100 150 200 250 300 350
Ethylcellulose (mg) 50 50 50 50 50 50 50
Ethanol (ml) 5 5 5 5 5 5 5
PVA (mg) 50 50 50 50 50 50 50
Dibutyl Phthalate (ml) q.s q.s q.s q.s q.s q.s q.s
pan, sealed hermetically and heated at a constant rate of 10°C/min, nitrogen flow rate of 50ml/min over the temperature range of 40-250°C.8
Powder X-ray diffraction studies
X-ray diffraction patterns of the drug, ethylcellulose and microsponges were recorded using Ultima ΙV X-ray diffractometer. The instrument was operated at a voltage of 35 kV, current 20mA and heating rate of 3–50°C/min.9
Particle size measurement
Determination of the particle size of the microsponges was done with an Almicro BM-5 optical microscope using a calibrated ocular and a stage micrometer. A minute quantity of microsponge sample was spread on a clean glass slide and the average particle size was calculated by measuring 100 particles of each batch using the formula:
dav= Σnd/Σn
where dav is the average diameter of the particles (µm), n is the number of particles per group and d is the middle value (µm).10
In vitro dissolution studies
The in vitro drug release study from Flurbiprofen microsponges was carried out using Labindia DS8000 dissolution testing apparatus paddle type. Samples equiv-alent to 50 mg of Flurbiprofen were used. The disso -lution test was performed using 900 ml of phosphate buffer pH 7.4. The paddles were rotated at 50 rpm at 32±0.5°C. The samples were collected at specified time intervals (1, 2, 3, 4, 5, 6, 7, 8 h) and immediately replaced with fresh dissolution medium to maintain the sink conditions. The samples were filtered and diluted if necessary with the same dissolution media. The absor-bance of the filtrate was measured by a UV spectropho -tometer at the λmax of Flurbiprofen.11
Kinetic modeling
The in vitro release data was fitted into various kinetic models, to analyze the mechanism of drug release from the microsponges. The models used were zero order, first order, Higuchi model and Korsmeyer Peppas model. The model with the highest regression coefficient was considered as the best-fitted model.12-13
Preparation of microsponge gel
The required quantity of carbomer 934 was weighed, sprinkled slowly in required amount of water and soaked overnight. Once the soaking was complete, carbopol was neutralized with triethanolamine with slow stirring. The optimized microsponge formulation equivalent to
5%w/w of drug was dispersed separately in an appro -priate amount of glycerin and propylene glycol mixture. This drug and solvent blend was added slowly to the carbopol base followed by the addition of preservatives and stirred till uniform gel was obtained.14 The formula of the microsponge gel is given in Table 2.
Evaluation of microsponge gel General appearance
Microsponge gel was evaluated for organoleptic properties such as color, consistency, homogeneity, extrudability and presence of any foreign particles.
Determination of the pH
pH of the gel was checked using a digital pen pH meter. Gels should not cause any irritation on application to the skin and therefore pH plays an important role in topical formulation. 2.5 g of gel was weighed and dispersed in 25 ml of distilled water. The pH was then measured by dipping electrode of pH meter in the gel. Determination of spreadability
Spreadability was expressed in terms of time in seconds taken by two slides to slip off from gel which was placed in between the slides under the direction of certain load. Lesser the time taken for separation of two slides better is the spreadability. It was calculated using the following formula:
S = W×𝐿/T
where, S is the spreadability in gcm/sec, W is the weight tied to upper slide in grams, L is the length of glass slide and T is the time in seconds required by the top slide to cover specified distance.15
Drug content
The drug content of the formulated gel was carried out by dissolving accurately weighed quantity of gel equivalent to 50 mg of drug in a 100 ml volumetric flask and volume was made upto 100 ml with phosphate buffer
Table 2: Composition of microsponge gel formulations.
Sr. No. Ingredients Quantity
1. Microsponges 5%w/w
2. Carbopol 934P 1.5%
3. Propylene Glycol 3ml
4. Glycerine 1.5ml
5. Methyl Paraben 0.0125%
6. Propyl Paraben 0.00625%
7. Triethanolamine q.s.
pH 7.4. The flask was shaken for 2 h in shaker. The solution was then filtered using Whatman filter paper. The filtered solution was then analyzed spectrophoto -metrically for drug content of Flurbiprofen at 247 nm.16 Viscosity
The viscosity holds a major contribution in deciding the drug content and the release of the drug from the prepared gel formulations. This parameter also affects the spreadability and the flowability of the gel. The viscosity of the formulated gel was determined using Brookfield viscometer, spindle L4. Approximately around 100 g of microsponge gel was taken on a long narrow glass beaker. The spindle was then dipped in the gel and spindle was rotated at optimum speed and the reading was taken as displayed on the screen.17
In vitro diffusion studies
The release of Flurbiprofen from optimized micro-sponge gel and from the marketed gel was determined using Franz diffusion technique. 1 g of the gel was taken in a glass tube and was placed in a beaker containing 60 ml of phosphate buffer pH 7.4. The temperature of receptor medium was maintained at 37±1°C, agitated at 100 rpm speed using magnetic stirrer. Aliquots of 5ml sample were withdrawn periodically and after each withdrawal same volume of medium was replaced. The collected samples were diluted as required and analyzed at 247 nm by UV spectrophotometer using phosphate buffer 7.4 as blank.18
Ex vivo diffusion studies
Ex vivo diffusion studies were performed on the optimized microsponge gel formulation using freshly removed goat’s ear skin. The ex vivo study was carried out using modified Franz diffusion cell using phosphate buffer pH 7.4, maintained at 37°C and stirred around 100 rpm on a magnetic stirrer. 5 ml aliquots were with -drawn at hourly intervals and filtered. The concentra -tion of Flurbiprofen in the filtered sample was analyzed using UV spectrophotometer at 247 nm. The obtained data was analyzed to determine percent drug release and mechanism of drug release.
Kinetics of Drug Release
In order to investigate the mechanism of drug release from microsponges gel, the release data obtained from diffusion studies were fitted to various kinetic equations.
Stability study
The microsponge gel formulation was subjected to stability testing as per ICH norms. Gel was subjected to the temperature of 40°C ± 2°C/75% RH ± 5% RH.
Gel was assessed for any signs of instability, polymeric phase separation, drug content and in vitro diffusion studies at the interval of 30 and 60 days.
RESULTS AND DISCUSSION Formulation of microsponges
In the present study, microsponges of Flurbiprofen with different drug and polymer ratio were formulated by quasi-emulsion solvent diffusion method due to feasibility, ease of preparation and reproducibility of the proposed method. Microsponges with desired char-acteristics were obtained with this method.
Characterization and evaluation of microsponge formulations
Visual appearance
All the developed batches of microsponges appeared as white uniform powder.
Surface morphology by SEM
As seen in Figure 1, the microsponges appeared as porous particles with tiny pores on the surface. These pores were induced by the diffusion of the volatile solvent i.e. ethanol from the surface of the microparticles. At higher resolution, drug crystals were seen over the surface of the microparticles. This is because, at a higher drug-polymer ratio, more amount of drug reaches the surface of the microsponges being dissolved in the solvents during diffusion. As the diffusion of the solvents becomes slower with the increase in the amount of drug, there is more time for the formation of drug crystals at the surface.
Production yield.
The production yield of all the batches ranged from 66.25 to 90.4% as seen in Table 3. The variation in the production yield of different batches was due to the
difference in the time taken by ethanol to diffuse out from the inner phase droplets into the external phase.
Entrapment efficiency and drug content
The drug content of the formulations ranged from 50.53% (F1) to 96.56% (F4). Formulations F4 and F5 showed a higher percentage of drug content as well as entrapment efficiency as compared to other batches as seen in Table 3.
Particle size measurement
The average particle size of microsponges should be in the range of 5–300 µm. Visual inspection results of all batches done using an optical microscope as showed in Table 3, that with the decrease in the amount of polymer from F1 to F7, the particle size was found to decrease. This is because, at the higher drug: polymer ratios, the amount of polymer available for the formation of microsponges decreases and small-sized microsponges were produced.
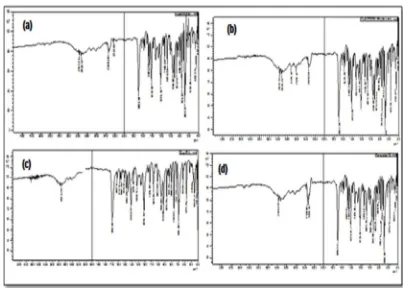
Fourier transform infrared spectroscopy (FTIR)
FTIR was performed to detect any sign of interaction which would be reflected by a change in the position or disappearance of any characteristic peak of Flurbiprofen. IR scans of pure drug Flurbiprofen and physical mixtures of drug + ethylcellulose, drug + PVA and that of microsponge formulation were taken. From the IR spectra shown in Figure 2, it was observed that there was no interaction of the drug with any of the excipients. Differential Scanning Calorimetry (DSC)
A broad peak was observed at 150°C in drug+ ethylcel -lulose mixture which corresponds to the melting point of the ethylcellulose. A broad peak at 230°C in drug+ PVA mixture corresponds to the melting point of PVA.
There was no shift in the position of the sharp peak of Flurbiprofen at 117°C when mixed with the excipient indicating that there was no interaction of the drug with excipients as seen from Figure 3.
Powder X-ray diffraction studies
As observed in Figure 4, numerous sharp and distinct diffraction peaks of high intensity were observed for Flurbiprofen in pure form, indicating the crystalline nature of the drug. Ethylcellulose is amorphous in nature which is indicated by diffraction peaks of low intensity. The microsponges showed typical signals of Flurbiprofen but with low intensity. The decrease in the intensity of the sharp peaks indicates that there was a reduction in the crystallinity of the drug when formulated into microsponges. The appearance or disappearance of new peaks was not observed and hence it confirms that there was no interaction between the drug and the excipients used in the formulation.
Figure 2: FTIR spectra of (a) Flurbiprofen; (b) Flurbiprofen and ethylcellulose physical mixture; (c) Flurbiprofen and PVA
physical mixture and (d) Flurbiprofen microsponges.
Figure 3: DSC thermogram of (a) Flurbiprofen; (b) Flurbiprofen and ethylcellulose physical mixture; (c) Flurbiprofen and PVA
physical mixture and (d) Flurbiprofen microsponges. Table 3: Results of evaluation parameters for micro
-sponges.
Formulation
Code
Percentage Yield (%± S.D)
*
Average
Particle Size (mm±S.D)
*
Drug Content (%± S.D)
*
Entrapment Efficiency (%± S.D)
*
batches of formulations prepared, formulations having drug and polymer in the ratio of 4:1 showed the highest release.
The maximum dissolution rate of F4 was because of the reduction in the particle size and porous nature of the microsponges which provides channels for drug release. Formulation F4 also showed highest entrapment effi -ciency; hence the release given by this formulation was found to be high. Also, the solubility of Flurbiprofen was found to increase when incorporated as micro-sponges.The lowest release was shown by formulation F1 (55.75%) which contains drug and the polymer in the ratio of 1:1. This is because, when the amount of polymer is high, there is an increase in the pathlength through which the drug has to diffuse and hence the release of the drug decreased.
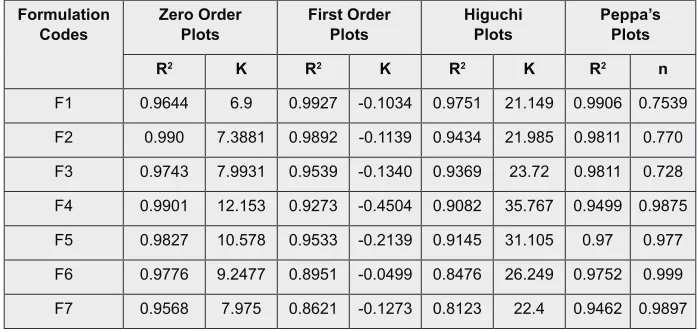
Kinetic modeling
From Table 4, it was observed that the highest R2 value
for zero order plots (0.9901) was found to be close to 1; hence the release of drug from all the formulations followed zero order kinetics. The correlation coefficient of all formulations with Higuchi’s equation ranged from 0.8123-0.9751, with the highest value of 0.9751 that is nearly approaching 1. The results indicated that all microsponge formulations exhibited diffusion mechanism of drug release.
The values of ‘n’ as derived from Peppa’s model for F1, F2 and F3 were 0.753, 0778 and 0.728 respectively i.e. the values of n were in the range of 0.45-0.89. Therefore it was concluded that the drug release from formulations F1, F2 and F3 followed anomalous or non-fickian diffu -sion type. Thus, it was proposed that these formulations delivered the active ingredient by coupled diffusion and erosion. Formulations F4, F5, F6 and F7 showed n
Figure 4: Powder X-Ray diffraction patterns for (a) Flurbiprofen; (b) Ethylcellulose and (c) Flurbiprofen microsponges.
Figure 5: Plot of percent cumulative drug released from microsponges versus time.
Table 4: Results of regression coefficient and kinetics for microsponge formu
-lations.
Formulation
Codes Zero OrderPlots First OrderPlots HiguchiPlots Peppa’sPlots
R2 K R2 K R2 K R2 n
F1 0.9644 6.9 0.9927 -0.1034 0.9751 21.149 0.9906 0.7539 F2 0.990 7.3881 0.9892 -0.1139 0.9434 21.985 0.9811 0.770 F3 0.9743 7.9931 0.9539 -0.1340 0.9369 23.72 0.9811 0.728 F4 0.9901 12.153 0.9273 -0.4504 0.9082 35.767 0.9499 0.9875 F5 0.9827 10.578 0.9533 -0.2139 0.9145 31.105 0.97 0.977 F6 0.9776 9.2477 0.8951 -0.0499 0.8476 26.249 0.9752 0.999 F7 0.9568 7.975 0.8621 -0.1273 0.8123 22.4 0.9462 0.9897 In vitro dissolution studies
values in the range of 0.89-1.0 indicating that they followed case II (zero order) drug release.
Formulation of microsponge gel
Based on the results of evaluation tests performed on all formulation batches, an optimized formulation was selected that gave satisfactory results as compared to others. Formulation F4 was selected as the optimized batch as it showed the highest entrapment efficiency and maximum in vitro drug release. Optimized micro-sponge formulation F4 was incorporated further into the gel.
Evaluation of microsponge gel Appearance
The formulated gel appeared as white, smooth and opaque. No phase separation was seen. The gel was found to be consistent with a homogeneous appear-ance, free from external foreign particles. The gel was extruded smoothly without applying much force. The results of drug content, pH, spreadability and viscosity are displayed in Table 5.
In vitro and ex vivo studies
As seen in Table 6, the ex vivo % cumulative drug release from microsponge gel matrix at the end of 8 h was found to be 69.75% which decreased when compared to the in vitro release (67.01%). The decrease in release may be due to slow diffusion of the drug first through the microsponges followed by slow diffusion through the gel matrix for permeation across the biological mem-brane, indicating sufficient permeability through skin membrane.
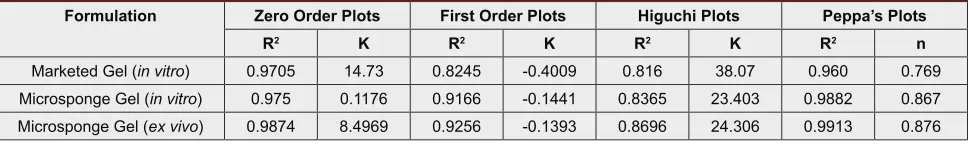
Kinetics of release
From the values of regression coefficient given in Table 7, it was observed that the R2 values of marketed gel (in vitro) and microsponge gel (in vitro, ex vivo) for zero order plot were higher than first order. This indicates that the microsponge gel formulation was best fitted in zero order kinetics and drug release follows zero order kinetics. The result of Higuchi plot indicates a diffusion mechanism of drug release. The values of ‘n’ derived from Peppa’s plot were falling between the ranges 0.45-0.89. This indicated that the drug release follows
Table 5: Results of evaluation parameters for gel.
Formulation pH* Drug content
(%±S.D)* (g.cm/sec ±S.D)*Spreadability (cps ±S.D) *Viscosity
Microsponge gel 5.7±0.012 73.83 ± 1.023 33.33±1.003 14,800 ±0.0127 * Data was expressed as a mean ± S.D. where n=3
Table 6: Results of in vitro and ex vivo release study from gels.
Time (h) %CDR (%)
Marketed gel (in vitro) Microsponge gel (in vitro) Microsponge gel (ex vivo)
1 7.906 6.555 8.218
2 11.890 11.881 14.409
3 25.709 19.163 22.202
4 51.614 26.350 30.549
5 68.602 35.156 38.412
6 82.412 40.586 44.456
7 95.6 58.517 59.715
8 - 67.012 69.756
Table 7: Results of regression coefficient and release kinetics for microsponge gel.
Formulation Zero Order Plots First Order Plots Higuchi Plots Peppa’s Plots
R2 K R2 K R2 K R2 n
non-fickian diffusion type i.e. coupled diffusion and erosion.
Stability Studies
The gels were found to retain uniform and homogenous appearance at the end of 2 months of the study. The drug content and %CDR were found to be decreased in samples stored at room temperature as compared to those stored at refrigerated temperature.
CONCLUSION
In this research project, an attempt was made to deliver Flurbiprofen into the systemic circulation by incorporating it as microsponges in a gel for transdermal delivery. Formulating Flurbiprofen as microsponges extended the release of drug for a long period of time.
Seven batches of Flurbiprofen microsponges were formulated by quasi-emulsion solvent diffusion technique. The release kinetics data showed that the formulations F1, F2 and F3 followed zero order kinetics with non-fickian diffusion controlled release whereas rest of the formulations followed Case ΙΙ transport. Based on the results of evaluation, formulation F4 was considered to be the optimized formulation and was incorporated in carbopol gel base. The in vitro drug release from the formulated microsponge gel was found to be extended over a longer period of time as compared to that of the marketed Flurbiprofen gel. Also, the in vitro release of drug from microsponge gel base was found to be lower than that from the microsponges alone.
ACKNOWLEDGEMENT
The authors would like to thank FDC, Roha, India for providing the gift sample of Flurbiprofen.
CONFLICT OF INTEREST
The authors declare no conflict of interest.
ABBREVIATIONS
BCS: Biopharmaceutics Classification System; PVA:
Polyvinyl Alcohol; %CDR: Percent Cumulative Drug release; R2: Regression Coefficient.
SUMMARY
The ethylcellulose entrapped microsponges systems of Flurbiprofen were formulated and evaluated. They proved beneficial in extending the release of the drug long period of time.
REFERENCES
1. Dasthagiri S, Jagadesh P, Naik SB, Nethravani G. Over review of microsponges -advanced novel technology. World J Pharm Pharm Sci. 2016;5(2):414-26.
2. Tiwari R, Tiwari G. Dissolution Modulating Mechanism of Flurbiprofen Solid Dispersions: Characterization, Physical Stability and in vivo Performance: Formulation Considerations and optimization study. Pharmaceutical Methods. 2017;8(2):127-35.
3. Kumar T, Kaur P. Formulation and Evaluation of Topical Gel of Aceclofenac. Journal of Drug Delivery and Therapeutics. 2013;3(6):51-3.
4. Nokhodchi A, Jelveghari M, Siahi MR, Dastmalchi S. The effect of formulation type on the release of benzoyl peroxide from microsponges. Iranian Journal of Pharmaceutical Sciences. 2005;1(3):131-42.
5. Tile MK, Pawar AY. Microsponges: A Novel Strategy for Drug Delivery. International Journal of Pure and Applied Bio sciences. 2015;3(1):224-35. 6. Kumar JR, Muralidharan S, Ramasamy S. Microsponges enriched gel
(MEGs): A novel strategy for ophthalmic drug delivery system containing ketotifen. J Pharm Sci and Res. 2013;5(4):97-102.
7. Saboji JK, Manvi FV, Gadad AP, Patel BD. Formulation and evaluation of ketoconazole microsponge gel by quassi emulsion solvent diffusion. Journal of Cell and Tissue Research. 2011;11(1):2691-6.
8. Agarwal A, Shukla T, Pandey S, Dhote V. Formulation and development of pantoprazole loaded microsponges for management of GERD. World J Pharm Pharm Sci. 2015;4(12):1114-26.
9. Mahajan AG, Jagtap LS, Chaudhari AL, Swami SP, Mali PR. Formulation and evaluation of microsponge drug delivery using indomethacin. Int Res J Pharm. 2011;2(10):64-9.
10. Prasad MS, Ajay M, Babu BN, Prathyusha P, Audinarayana N, Reddy DK. Microsponge Drug Delivery System: A Review. Journal of Pharmacy Research. 2011;4(5):1381-4.
11. Global research online http://globalresearchonline.net/journalcontents/v42-1/41.pdf
12. Rajab NA, Jawad MS. Formulation and in vitro evaluation of Piroxicam microsponge as a tablet. Int J Pharm Pharm Sci. 2016;8:104-14.
13. Gouda R, Baishya H, Qing Z. Application of Mathematical Models in Drug Release Kinetics of Carbidopa and Levodopa ER Tablets. J Develop Drugs. 2017;6(171):2.
14. Shaikh HK, Kshirsagar RV, Patil SG. Mathematical models for drug release characterization: a review. World J Pharm Pharm Sci. 2015;4(4):324-8. 15. Shah C, Shah D. Design and optimization of fluconazole microsponges
containing ethyl cellulose for topical delivery system using quality by design approach. Pharma Science Monitor. 2014;5(3):95-133.
16. Shetkar M, Potinas V, Shete M. Development and Evaluation of Aceclofenac Gel for Topical Application. American Journal of Pharmacy and Health Research. 2014;2(12).
17. Anju VS, Kuriachan MA. Formulation and Evaluation of Terbinafine
Hydrochloride loaded microsponge based gel for Topical Sustained Delivery. Int J Pharm Pharm Sci. 2017;10(2):69-93.
18. Hussain H, Dhyani A, Juyal D, Bahuguna A. Formulation and evaluation of gel loaded microsponges of diclofenac sodium for topical delivery. The Pharma Innovation. 2016;3(10):58-63.