Geschke Center
Doctor of Nursing Practice (DNP) Projects Theses, Dissertations, Capstones and Projects
Fall 12-11-2013
Influencing Change in Healthcare Providers:
Communication Strategies for a New Era in
Healthcare
Ceonne Raasikh USF, [email protected]
Follow this and additional works at:https://repository.usfca.edu/dnp Part of theNursing Administration Commons
This Project is brought to you for free and open access by the Theses, Dissertations, Capstones and Projects at USF Scholarship: a digital repository @ Gleeson Library | Geschke Center. It has been accepted for inclusion in Doctor of Nursing Practice (DNP) Projects by an authorized administrator of USF Scholarship: a digital repository @ Gleeson Library | Geschke Center. For more information, please [email protected].
Recommended Citation
Raasikh, Ceonne, "Influencing Change in Healthcare Providers: Communication Strategies for a New Era in Healthcare" (2013).
Doctor of Nursing Practice (DNP) Projects. 17.
Influencing Change in Healthcare Providers:
Communication Strategies for a New Era in Healthcare
Ceonne Raasikh
University of San Francisco
Table of Contents
Abstract………...……….………4
Introduction……….…..………...………5
Background Knowledge…………..………5
Local Problem…….……….8
Purpose of Change………..………...12
Review of Evidence….………..12
Conceptual/Theoretical Framework………...……16
Methods……….……..………...18
Ethical Issues………….…………..………..18
Setting……….………...…19
Planning the Intervention………...19
Implementation…...….………..21
Planning the Study of the Intervention…………...………...……22
Methods of Evaluation...…………..……….24
Analysis……..…….………..27
Results………..………..…………..……….30
Program Evaluation/Outcomes..………..……….…30
Discussion….………...……….33
Summary………..……….33
Relation to Other Evidence……….………..34
Barriers To Implementation/Limitations………...35
Conclusions………...….…37
Other Information………..………..………..38
Funding………..………..………..38
Section VII Reference………..………..39
Abstract
Effective provider communication is the key to patient engagement. However, many providers
are not able to effectively communicate with patients, in part due to low health literacy. Evidence
in the literature supports the use of specific strategies aimed at improving communication with
patients. The purpose of this quality initiative was to influence providers to adopt new
communication strategies with their patients. Pharmacists, nurses and physicians were invited to
participate in a free, full-day, educational event. During the event providers were alerted to the
issue of health literacy and provided communication strategies to improve patient comprehension
and engagement. Following the presentation, providers were surveyed and asked if they
intended to change the way they communicated with patients. Six weeks after the event,
providers were administered a follow-up survey to determine if they had in fact changed their
practice as originally intended. This author presents the results of these surveys to understand
which areas providers committed to changing in comparison to those actually changed. Results
showed most providers who committed to change in the areas of communicating with patients,
using teach back and implementing patient follow-up phone calls, subsequently reported they
had in fact changed their practice. Whereas many providers intended to utilize communication
tools with patients, fewer reported actually incorporating this change into their practice. Future
opportunities lie in integrating observations to assess knowledge, along with ongoing
Introduction
Background Knowledge
At the time of this writing, our nation’s healthcare delivery system is embarking upon
phenomenal changes. This time will undoubtedly be marked in history as the largest
transformation in healthcare. In a single legislation, known as the Affordable Care Act, the
healthcare industry, its leaders and practitioners, have scrambled to establish rapid changes to
comply with the numerous, and often complex, mandates. One mandate is to reduce hospital
readmissions, or face lower reimbursements (Centers for Medicare and Medicaid Services, 2013).
Recent data revealed 18.4% of all Medicare patients in 2012 were readmitted to hospitals within
30 days (Gerhardt et al., 2013). Although this is a decrease from prior years, it still represents
billions of dollars in unnecessary costs for the Medicare program (Gerhardt et al., 2013). The
readmissions reduction initiative is designed to shift some of these costs back to hospitals whose
patients are discharged and subsequently readmitted. Components of the program include
reducing 30-day hospital readmissions for patients with heart failure, pneumonia, and myocardial
infarction. In 2014 this will expand to include chronic obstructive pulmonary disease, along with
knee and hip arthroplasty (Centers for Medicare and Medicaid Services, 2013). It is widely
suspected more diagnoses will be added and other payers will begin to emulate similar
reimbursement penalties. In order to be successful with improving the overall quality of care,
patients must partner with healthcare institutions and become engaged in their own health care
(Snowden, 2013).
What is patient engagement and how does one become engaged? Patient engagement,
providers. In a 1975 published study, titled “Good Patients and Problem Patients: Conformity
and Deviance In a General Hospital”, Judith Lorber discusses the idea of patient compliance and
the perceptions of nurses and physicians. The study showed that physicians expected patients to
be passive and submissive, obeying orders without question. Lorber also found the sickest
patients were most compliant and submissive, as they were totally dependent on clinicians for
their health. The educated patients were least “compliant”, as demonstrated by their intense
questioning and interruptions in an established routine. Lorber concluded, as the population gets
better educated on health, “it is likely that patients will probably be asking more questions,
demanding more explicit information about their cases, and insisting on more personalized
attention” (1975). This study serves as an example of how the concept of patient compliance has
transformed over the years, from patients being expected to comply without questioning to one
where patients are encouraged to actively participate in their care, be informed and question
providers anytime information is unclear.
Other authors have attempted to define patient accountability or engagement. In 2004,
Hibbard, Stockard, Mahoney and Tusler conceptualized what they termed patient activation, and
identified four domains critical to its existence: (a) self-management, (b) collaboration with
provider, (c) maintain function/prevent declines, and (d) access to appropriate and high-quality
care. Kemper (2013) described health care’s greatest unrealized resource as the patient, and
asserts patient accountability is the mechanism for patients to maximize their potential. Patient
accountability depends on the patient (a) knowing what is reasonably expected, (b) having the
information, skills and tools to do what is reasonably expected, and (c) economically and socially
accountable to do what is expected (Kemper, 2013). The Center for Advancing Health (2013)
us". The organization lists 43 engagement behaviors for consumers, which are separated into
ten categories, one category being communication with providers. Patient engagement has also
been defined as a process, in which patients grow towards becoming invested in their own care.
It is a natural progression that occurs with regular, focused communication between a patient and
provider (Patient Engagement Systems, 2013).
Throughout the years, a number of expressions have been used to define and explain
patients who choose to adhere to prescribed medical regimens. There is minimal distinction in
the definitions of engagement, compliance and accountability. However, the concepts are all the
same, and each identifies some form of communication and knowledge as being necessary
precursors for patients to become invested, participants in their own health care. For the
purposes of this writing, this behavior will be referred to as patient engagement.
As described earlier, effective communication is essential to building bridges towards
patient engagement. When provider-patient communication is done correctly, it builds trust with
patients, which in turn establishes an environment conducive to building agreements regarding
medical treatments and goals (Wood, 2013). Masterful provider-patient communication is
associated with better patient outcomes and higher patient satisfaction rates (Beach, 2010).
Regrettably, providers have had suboptimal performance in communicating with patients.
Reasons for ineffectual communication are varied and can include language and cultural
differences between the provider and patient, patient disabilities, and low health literacy
(Wilson-Stronks, 2013). Of these barriers, providers are least likely to recognize a patient with
low health literacy since it is not easily identifiable (Powell & Kripalani, 2005). Therefore, the
key to improving provider-patient communication is for providers to understand the issue of
to best communicate with patients, patients are more likely to become engaged in their health
care, and engaged patients have better outcomes and are less recurring hospitalizations (Divi,
Koss, Schmaltz, & Loeb 2007).
Providers at St. Francis Medical Center, an acute care hospital in Lynwood, CA, raised
concerns regarding their inability to effectively manage patients with atrial fibrillation and other
chronic diseases (J. Smith, personal communication, January 27, 2013). Patients with atrial
fibrillation were poorly managing their care; this resulted in repeat hospitalizations and incidents
of preventable stroke. Similar trends could be seen in other chronic illnesses as well. Providers
expressed frustration with the lack of patient engagement and accountability. Hospital leaders
recognized an immediate need for improvement in patient engagement in order to advance the
quality of care being delivered both within the hospital and self-care after discharge.
Local Problem
Health literacy is defined as “the capacity to obtain, process, and understand basic health
information and services needed to make appropriate health decisions” (US Department of
Health and Human Services, 2013). The issue of health literacy is not only an individual
problem, but also a systemic issue, prevalent throughout the healthcare industry and facing local
communities all over the country. It is an important component of a patient’s ability to learn and
involves much more than the ability to read and write, as demonstrated by 45% of high school
graduates having limited health literacy (Kutner, Greenberg, Jin,& Paulsen, 2006). Health
literacy “requires a complex group of reading, listening, analytical, and decision-making skills,
and the ability to apply these skills to health situations” (National Network of Libraries of
Medicine, 2013). This issue is so critical; it is in fact a greater predictor of health than age,
Health literacy actually involves the ability to follow directions, fill out forms, calculate
medication dosages, and make sense of medical jargon. The incidence of health illiteracy affects
nearly 90 million American adults (Vernon, Trujillo, Rosenbaum, & DeBuono, 2007). It is more
pervasive in individuals of a non-white ethnicity, those with lower education and socioeconomic
backgrounds, with physical and mental disabilities, or with low English proficiency (Somers &
Mahadevan, 2010). Health literacy is rarely recognizable and often masked. It is common for
patients to pretend to understand, nod their head in agreement and fail to ask clarifying questions
for fear of embarrassment.
Each day, individuals are being asked to make vital decisions that directly affect the
status of their health. Patients must weigh the risks and benefits of a myriad of health care
matters such as medications and their side effects, chemotherapy, surgery, or diet regulation.
These choices are never easy, require a great deal of comprehension and discernment, and each
decision has an effect on individual patient outcomes. Studies show patients with low health
literacy are more likely to skip necessary medical tests, have more recurring Emergency
Department visits, and have a harder time managing their chronic illnesses (Rudd, Anderson,
Oppenheimer, & Nath, 2007).
Health literacy is just as much about the provider and healthcare system as it is the patient.
Healthcare leaders must begin to examine how providers communicate with patients, assess
health literacy and accommodate for patients and families with low health literacy. When
considering the vast amount of sources providing patients with health information, it is
understandable for patients to be confused. Health information is provided by friends, internet
sites, news, books, radio, pharmacists and other providers. Sometimes the information is
question the content. Patients are left to their own devices to make sense of the health
information they receive.
In the state of California there are two programs designed to improve public health
literacy (Centers for Disease Control, 2013). The Institute for Healthcare Advancement offers
educational programs for providers and educators to raise awareness and teach best practices in
educating persons with low health literacy. Services also include review and revision of
educational material to assure it meets the needs of low health literacy individuals (Institute for
Healthcare Advancement, 2013).
Health Research for Action is another program in California aimed at reducing health
disparities by improving health literacy. The program operates out of the University of
California Berkeley, School of Public Health. A team of researchers and public health
professionals manage this consulting service. Health Resource for Action offers a variety of
services to combat low health literacy. Services include educating the public, research, public
health policy and planning (Health Research Action, 2013).
This paper is based on a quality improvement activity, which centered on the community
of Lynwood, California. As such, the city’s demographics were analyzed. Lynwood is a small
city in south Los Angeles County, just east of Compton, California. In Lynwood there is one
384- bed, community hospital that contains a busy trauma center, high-risk obstetrics and a large
population of patients with chronic diseases, including heart disease, diabetes and renal failure (J.
Smith, personal communication, January 27, 2013). Overall readmissions are high, many patients
have difficulty managing their chronic diseases and normally suffer from harmful, yet
preventable complications as a result of poorly home-managed care. As previously stated, low
education and English as a second language). In an effort to comprehend health literacy in
Lynwood, demographic data from the US Census Bureau (2012) was evaluated and compared to
all of Los Angeles County (see Table 1). In Los Angeles County an estimated 33.5% of the
population, age 16 years and older, lack basic literacy skills (National Center for Education and
Statistics, 2003). For the city of Lynwood the demographics were analyzed to understand the
population at risk for low health literacy. In 2010, 86.6% of the population in Lynwood was
Hispanic or Latino, in comparison to 48.2% in all of Los Angeles County. Forty-one percent of
the residents are foreign born and 83.6% speak a language other than English at home. Only
4.6% of the adults in Lynwood have Bachelor degrees while 29.2% in Los Angeles County have
degrees.
Table 1
Comparison Demographics, Lynwood, CA and Los Angeles County
______________________________________________________________________________
People Quick Facts Lynwood, Year Los Angeles Year
CA County
Population 70,709 2012 9,962,789 2012
Hispanic or Latino 86.6% 2010 48.2% 2012
Foreign-born persons 41% 2007- 35.6% 2007-
2011 2011
Language other than 83.6% 2007- 56.6% 2007-
English spoken at home 2011 2011
Bachelor’s degree or 4.6% 2007- 29.2% 2007-
higher 2011 2011
Persons below 21.6% 2007- 16.3% 2007-
poverty level 2011 2011
Age 65 and over 5.4% 2010 11.5% 2012
Purpose of Change
The specific aim of this project was to influence healthcare providers to change their
communication style. The reason for this change was to close the gap between clinical practice
and evidenced-based practice relative to provider communication. In doing so, providers would
be able to effectively converse with patients and their families. This practice change initiative
was provided with the overarching intent for providers to affect patient engagement and
ultimately improve quality outcomes. The success of this initiative would be measured by the
number of providers who reported changes in how they communicated with patients.
Review of Evidence
There is evidence that suggests hospital readmissions and quality of care can be
significantly reduced with effective provider communication and patient education (Robert
Wood Johnson Foundation, 2013). One method for improvement involves use of the “teach back”
method (Schillinger et al., 2003). There have been multiple sources advocating use of teach back
as an effective strategy to enhance provider communication when conducting patient education
(DeWalt et al., 2010; Institute for Healthcare Improvement, 2013; Oh, 2011).
Teach back involves the patient stating back to the clinician, in their own words, what
they know and understand about their health condition (Schillinger et al., 2003). It is publicized
as being an effective method of patient education since it allows the clinician to validate learning
(DeWalt et al., 2010; Institute for Healthcare Improvement, 2013; Oh, 2011). Unlike traditional
education, which involves post-education questions such as “do you have any questions” or
“what questions do you have regarding your medication”, teach back asks, “can you please tell
me how you will take your medications” (Schillinger et al., 2003). During teach back, if a
process will continue until the “feedback loop is closed” meaning until the patient correctly,
states the information that was originally provided by the clinician (see Appendix A).
A literature review was done to evaluate the evidence (using Johns Hopkins Evidence
and Quality Rating Scale) and to determine if patients understood health information better with
teach back in comparison to simply providing information alone. All databases were searched
for keywords “teach back” and “reducing readmissions”. The literature review was filtered to
search for scholarly peer-reviewed journals published between 2007-2013. The search returned
54 documents. The remaining searches were once again filtered, this time to exclude
non-research articles. This writing discusses the ten remaining articles and recommendations for
practice change based on the evidence (see Appendix B).
In 2013, authors Kornburger, Gibson, Sadowski, Maletta and Klingbeil published their
work on pediatric nurses and their use of teach back. This was a qualitative study assessing
nurses’ pre and post knowledge, use, and perceived value of teach back. The findings revealed
most nurses found value in teach back and had realized opportunities to clarify information
regarding medication administration and follow-up appointments. The largest perceived barrier
was time. Nurses responded it took more time to provide education with this method. The study
was limited in that it looked only at nurse perceptions of the efficacy of teach back and did not
actually assess the patient or family’s healthcare knowledge.
Another qualitative study investigated pharmacists’ perceived value while using teach
back in the medication reconciliation process (Haynes, Oberne, Cawthon & Kripilani, 2012).
The research found pharmacists believed they could improve patient outcomes by using teach
back during medication reconciliation and patient education. The study was limited since it did
Wilson, Baker, Nordstrom and Legwand (2008) examined the efficacy of teach back
while educating mothers on the use of vaccines. In this study, researchers discovered women
with low literacy failed to benefit from teach back. However, the writing did not indicate if the
researchers retaught the material until learning was achieved (full use of the feedback loop). The
authors noted the small sample size limited the study, and greatly cautioned against generalizing
findings.
In separate, but similar study, Wilson, Peart, Webster and Nordstrom (2012) evaluated
the use of teach back with low income women and their knowledge of the benefits and risks of
vaccines. This quantitative/qualitative study found teach back was effective among women with
higher health literacy rates. The women with low health literacy had minimal knowledge gain
with teach back. The researchers acknowledged their sample size was small which hindered
their ability to produce statistically significant results. In addition, it was not reported if the full
teach back process had been applied because there was no indication the mothers were retaught
when they stated incorrect information. True teach back involves closing the feedback loop or
reteaching until the learner is able to correctly state the information (Schillinger et al., 2003).
Kripalani, Bengtzen, Henderson and Jacobson (2008) conducted a study to understand
patients’ comprehension of informed consents. The findings were particularly disturbing
because although the informed consent was written at grade school level, researchers found
participants with limited health literacy could not fully comprehend the information. The study
concluded low health literacy creates such a learning barrier, even use of the teach back could
not overcome this obstacle.
Teach back was examined with patients and their respiratory inhaler techniques (Press, et
brief instructions and the second group being provided instructions using teach back or teaching
until learning goal was met. Researchers found teach back, described as “teach to goal”, was
more effective. This was demonstrated by teach back patients exhibiting appropriate use of their
inhalers and fewer hospital readmissions in comparison to those patients that did not receive
education with teach back.
Few researchers were found to have examined knowledge retention and teach back. One
study was located which studied teach back effectiveness over time. Kandula, Malli, Zei, Larson
and Baker (2011) tested patients’ ability to recall health information related to diabetes. Teach
back was utilized and found to be effective during immediate recall. However, researchers
determined teach back did not have the same effectiveness for knowledge retention. Participants
in the study were not able to recall the same level of information after two weeks. Therefore, it
is recommended to provide educational resources for patient review over long periods of time.
Mahramus, et al. (2012) studied teach back while educating nurses on the management of
congestive heart failure (CHF). Their findings concluded teach back was a valuable technique for
instructing nurses. Unlike nurses, patients and families often times have low health literacy
(National Center for Education Statistics, 2013). As a result, a patient’s ability to comprehend
health information with teach back may have varying results in comparison to healthcare
professionals.
Farrell, Kuruvilla, Eskra, Christopher and Brienza (2009) evaluated transcripts from 68
records. The examination focused on transcripts containing one of four “assessments for
understanding” types, (a) open ended questions, (b) closed ended questions, (c) teach back and
(d) asking “okay”. The analysis was limited and researchers pointed out many transcripts lacked
initiated with poor timing. The authors concluded that many patients may not understand
clinicians, and the clinicians many times are unaware of patients’ confusion. The research was
further limited for the purposes of this evaluation since it did not focus on the effectiveness of
the assessments of understanding.
In 2010 a meta-analysis of quantitative studies relative to patient comprehension of
informed consents was performed (Schenker, Fernandez, Sudore & Schillinder). Researchers
reviewed a total of 44 studies with one or more of the following teaching techniques, (a) written
information, (b) audiovisual/multimedia, (c) extended discussions and (d) teach back.
Researchers concluded all teaching techniques were effective, and did not determine if one was
more superior to the other. They did suggest clarity regarding key elements of the informed
consent in an effort to standardize the evaluation of patient comprehension. The analysis was
limited because many studies did not include an adequate description of the study population,
and there was considerable variety of outcomes making it difficult to surmise findings. However,
the meta-analysis included promising results utilizing teach back.
Overall, the evidence to date supports the use of teach back as a communication strategy
to assist with understanding new and unfamiliar concepts. However, teach back is not only a
process, but involves a supportive approach that is necessary and involves clinicians creating a
shame free environment so patients do not feel threatened (Weiss, 2007). It is important for
clinicians to not only use teach back, but in conjunction provide educational materials based on
the patient’s preferred learning style. These additional resources would be given to the patient so
Conceptual/Theoretical Framework
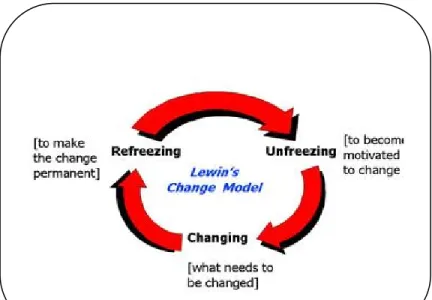
Theories and conceptual frameworks are often used to explain the foundation for which
principles lie. Both Orem’s Self Care Theory and Kurt Lewin’s Change Theory were used as
the foundation from which this practice change project was built. Orem’s Self Care Theory was
used to develop an understanding of the importance of patients being partners in their own care,
and having more accountability in that care. Kurt Lewin’s Change Theory was used to guide the
project and create a format for motivating providers to change.
Orem’s Self Care Theory was first published in 1971 by Dorthea Orem and is built on the
following basic assumptions: (a) people should be self-reliant and responsible for their own care,
(b) a person’s knowledge of health and illness is necessary for promoting self-care behaviors and
(c) self-care is a behavior learned within a socio-cultural context (Orem, 1991). Orem’s Self
Care Theory maintains the basic premise that individuals are physically and cognitively able to
regulate their own self-care, when they are unable to do so, persons experience a self-care deficit.
Individuals suffering from a self-care deficit require assistance from a self-care agent to meet
their health and human needs (Denyes, Orem & SozWiss, 2001).
There are numerous change theories available, and one may argue several are more
relevant to clinical practice change. However, Kurt Lewin’s Change Theory is remarkably
applicable, it is concise, simple and useful with non-complex change. Lewin’s Change Theory
explains how behavior is associated both to an individual’s personal characteristics as well as the
social situation in which one exists (Lewin, 1947). With this premise in mind, the change project
was created with a basic assumption that providers want to provide the best care for their patients,
and once they became aware of the clinical evidence supporting a new approach to
The practice change project first involved commentary to challenge the current beliefs
and values around provider communication and patient comprehension; this stage is what Lewin
referred to as unfreezing the mind. At the conclusion of the project, providers were asked about
their intent to change their practice. It is at this point where change is intended to take place.
Several weeks after the project, providers were mailed a follow-up survey to inquire about their
commitment to change, to assess if they had changed their practice as intended. Lewin refers to
this stage as refreezing. The providers are adapting to the new communication strategies and are
forming a new way to communicate with patients.
Figure 1 Lewin’s Change Model
Methods
Methods
Ethical Issues
In May 2013 this quality improvement project was submitted to the University of San
Francisco (USF) Institutional Review Board (IRB) for consideration. The USF IRB responded
informed consent (see Appendix C). The sponsors of this project at St. Francis Medical Center
did not require an IRB review. It was well known and understood as a performance
improvement initiative designed to improve care delivery within accepted evidenced-based
standards. There was not, and is not, any intent to use this data for research purposes. This
project did not involve any patients- all participants were clinical providers. As a result of this
project, any changes in clinical practice will result in patients receiving the standard of care.
Setting
The setting for this project took place in Lynwood, CA in the auditorium of the medical
center. The providers were from the acute, community-based and ambulatory care settings.
Participants were informed that providers in attendance were from all over south Los Angeles
County and were a mix of registered nurses, physicians and pharmacists. It was unclear if the
providers had received any prior training regarding communication for patient engagement.
Planning the Intervention
In prior months primary care physicians raised concerns regarding quality and outcomes
for patients with cardiac diseases. As a result, when the opportunity arose, a decision was made
to pursue an educational, grant-funded project. The available grant offered funds for an
educational project related to improving the quality of care in the management of patients with
atrial fibrillation. In addition to medical treatments to prevent strokes, the grantor recommended
projects to also include education on techniques to improve communication with patients. The
grantor recognized in order to achieve quality, provider communication had to be addressed.
The grant was pursued and ultimately awarded.
Once the organization received an announcement of the grant award, this author formed a
addition to the author, team members included a cardiologist who also serves as the Director of
Electrophysiology, a pharmacist, hematologist, nurse clinical educator, and librarian (see
Appendix D). Each member was assigned a role in preparing educational content. The librarian
was responsible for scheduling meetings, facilitating transactions and other administrative tasks.
Clinical members conducted research and prepared content for their assigned area of education.
The team was led by this author, and met routinely to discuss and review project plans. In
addition to the educational program, planning was done to arrange for the venue, promotional
advertisements, catering and audiovisual recording.
Although the grant funding was targeted towards a physician educational project, this author
recognized an opportunity to involve other providers as well. There was no language in the grant
precluding other disciplines from participating; as a result, the author made a decision to target
key providers who could impact patient outcomes. Three provider types were determined to
have the greatest influence on patient outcomes: physicians, pharmacists and nurses. There was
agreement that these three disciplines would be the target audience, however the event would be
open to all clinical providers.
The total budget for the project was approximately $11,000. The largest expense was $7,000
for the speakers (see Appendix E). The greatest variance between the proposed costs and actual
costs were audiovisual fees. In the planning phase the project team anticipated providing the
project online. This would have allowed the content to be accessible to anyone, and participants
would pay only when requesting continuing education credits. In the final stages of planning, it
was discovered the I.T. department could not support a web-based program of this scale. The
A communication plan was developed to strategize the most effective way to advertise
internally and within the community (see Appendix F). Factors such as professional background,
practice area and affiliation with the medical center were considered. Strategies consisted of
communication posters within the medical center, save-the-date postcards and mailed brochure
invites (see Appendix G, H, & I). Invitations were also sent electronically with a link for online
registration at https://a-fib.eventbrite.com (see Appendix J). The website served as both an
advertisement and registration tool. Persons looking for an educational activity or conference
could search for and find the program using selected key words. The website also provided key
information, which was used to evaluate traffic on the site (Appendix K).
Implementation
This project was implemented by a team of clinical professionals, who together had an
overarching goal of improving the care and treatment of patients with atrial fibrillation. A
cardiologist (who is also the Director of Electrophysiology) reviewed epidemiology and
pathophysiology of atrial fibrillation and therapeutic implications. He also discussed the
concept of rate versus rhythm control and ablation therapy. A Clinical Pharmacist discussed the
role of antiarrhythmic therapy and warfarin use. An Oncologist/Hematologist educated the
providers on new and emerging anticoagulant therapies. While the Clinical Nurse Educator
reviewed safety concerns for patients. Lastly, this author discussed how to coordinate safe
transitions of care and improve quality with enhanced provider communication. While there
were several lecturers and topics, this writing is focused exclusively on the content presented by
this author, and the endeavor of invoking change in how providers communicate with patients.
A total of 92 providers participated in the daylong educational event. This project was
nurses, advanced practice nurses, physicians, pharmacists, one respiratory therapist and one
technician. Of those in attendance, there were 60 providers who completed the post event
evaluation (see Figure 2). Thirty-two remaining providers left before the event ended or failed
to complete an evaluation, and as a result, are not captured in the data.
Figure 2 Breakdowns of Evaluation Respondents
What is your degree?
Label Frequency Percent
Physician 15 25.00
NP 2 3.33
Nurses 41 68.33
Other 2 3.33
Total Valid 60 100
Planning the Study of the Intervention
The event topic was designed to influence providers to adopt new communication
strategies. Accordingly, success was measured based on providers’ intent to change and
self-reported changes in the area of communicating with patients. Communication was considered an
essential component of the project since literature supports the concept of effective
communication leading to patient engagement and improved outcomes.
The project was designed using questionnaires to capture provider responses via
evaluations and follow-up surveys. Educational content was presented, immediately afterwards
providers were instructed to complete an evaluation. The evaluation queried the providers’
intent to change and perceptions of being more effective in their practice. Six weeks after the
event, providers were mailed a follow-up survey. The follow-up survey asked if the provider
actually changed their practice as they originally intended. The success of the project was
determined by three factors, all targeted at 90% or greater: (a) provider perceptions of being
During the planning phase, several milestones were identified to assist the author with
staying on track with timelines of tasks due (see Appendix L). Some important timelines
included mailing advertisements, along with the review of draft and final presentation materials.
Moreover, the grantor required submission of preliminary outcomes and final reports. These
were tasks considered high priorities because since funding was contingent on reports being
turned in timely.
During the event, this author discussed how providers could improve quality, and safely
transition patients using improved communication (see Appendix M). This topic is of great
interest to the health professional community because there is a strong assumption that patients
want to improve their health, yet often times they are not engaged in their own health regimen.
The industry is finally shifting from providers being all knowing and delegating regimens to
patients, to providers partnering with patients and collaborating on how to best achieve health.
At the event, providers were introduced to all of the reasons why leaving the hospital can be a
dangerous time for patients. Communication failures result in misunderstandings of discharge
appointments, medications, and disease processes. The presentation briefly reviewed the
definition of care transitions as defined by Coleman and Boult (2003) and providers were shown
data reflecting hospital readmissions. Data was an essential component and used to raise
awareness with the audience and invoke a desire to change.
The vast majority of the presentation entailed strategies for effective communication.
Providers were made aware of how technology is being used to enhance communication with
patients. Examples included health information exchanges with patient portals that allow email
communication between the patient and providers. There was emphasis placed on the
care and consequently providers must engage families in the health discussions when necessary.
The author focused most of the presentation on teach back as a strategy for effective
communication (Schillinger et al., 2003). Providers were shown the Closing the Feedback Loop
diagram, which was used to illustrate the teach back method in practice (see Appendix A). The
importance of following-up with patients was another communication strategy emphasized and
encouraged for use. Providers were advised some form of follow-up with their patients was
necessary to ensure patients had no additional questions and remained on track on the road to
achieving health.
Towards the end of the presentation, audience members were given two real life stories
as told from an emergency department physician. The first story recounts what happened when
there was lack of communication with the primary provider, and how the patient required a visit
to the emergency department after getting confused with the medications. The second story
envisions the same patient except this time the provider is utilizing the communication strategies
including teach back. The patient fully understands the medications and is subsequently
discharged without further event. The stories are quite revealing and serve as an example of how
healthcare could function with proper communication. Provider beliefs and assumptions are
challenged and they are asked to rethink the idea of labeling a patient as “non-compliant” and
instead view these issues as patients non-engaged, often times as a result of having little to no
rapport with their provider. When the presentation comes to completion, providers are left with
the data that demonstrate a need for a change, given strategies on how to create change, provided
an example of what change could look like in clinical practice.
Methods of Evaluation
evidence-based approaches when communicating with patients. Six weeks after the event,
self-reported surveys were administered to determine if providers had actually changed how they
communicated. Only self-reported change was examined to determine if change had occurred.
The degree of that change was neither identified nor measured. The Physicians’ Institute
provided the survey tools and established validity and reliability for both tools.
Two surveys were administered to the providers participating in the event (see Appendix
N & O). The first survey was an evaluation given to providers at the conclusion of the event.
The evaluation contained questions to assess comprehension of content, perceived increase in
practitioner effectiveness and intent to change. Six weeks later, participants were mailed
follow-up surveys. The follow-follow-up surveys asked providers if they had in fact changed as they
previously committed to doing. It also specifically asked which communication strategies had
been adopted and put into use with patients.
A SWOT analysis was done to develop a full awareness of the environment for this event
and help with both planning and decision-making. (see Appendix P). The author determined
strengths within the medical center included motivated physician providers. Many of the medial
staff had already voiced a concern with wanting to improve patient outcomes, this was a good
sign the group was already committed to learning new information. In addition, it could be
argued, any provider registering for the event was already open to some level of change. In that
regard, half of the battle had already been won. There was a team of experienced, clinical
professionals available to teach content, so there was no need to hire an outside lecturer. Z
Weaknesses were also analyzed and revealed historically these types of events at the
medical center had a low turn out. In addition, the organization did not routinely train physicians
weaknesses, speakers were purposefully comprised of disciplines similar to the target audience
members. Having two nurses, two physicians, and a pharmacist deliver the content, was
intentionally designed to increase the turnout for these disciplines.
The team also explored opportunities and threats related to the event. Opportunities
external to the organization included grant funding to support the event and an abundance of
literature available to assist speakers with developing content. Threats to the success of the event
involved a short deadline to return preliminary analysis reports to the grantor. The event had
been pushed back a month later to accommodate one speaker’s vacation. This subsequently
created a short turn around time for the first report. The author kept a chart with deadlines as a
reference to assure all tasks were completed on time. The other threat was the potential
difficulty with recruiting providers from outside of the organization. Providers in clinics and
from Los Angeles County Department of Health were invited. The objective of inviting outside
participants was to influence change with acute, ambulatory and community setting providers.
Without having any professional relationships with these other providers, there was no guarantee
they would attend. However, opportunities available to overcome this included having funding
necessary to distribute repeat, professional advertisement to the invitees. The event offered was
free to all attendees and continuing education units were provided for all physicians, nurses and
pharmacists. These factors were considered critical for attracting providers to the event.
Again, the entire event was grant funded, and as a result, did not require a return on
investment analysis. However, the total costs for the event were $10,993.75 (see Appendix E).
If the medical center wanted to replicate a similar program, with a return on investment, it could
(nurses and pharmacists). The return would be realized through reduced length of stay and
readmissions with actual savings calculations based on Medicare’s value based purchasing.
Analysis
There were a total of 92 participants, 60 of who responded to the evaluation on the day of
the activity. Of the 60 respondents, there were 15 MDs, 2 Nurse Practitioners, 41 RNs, and 2
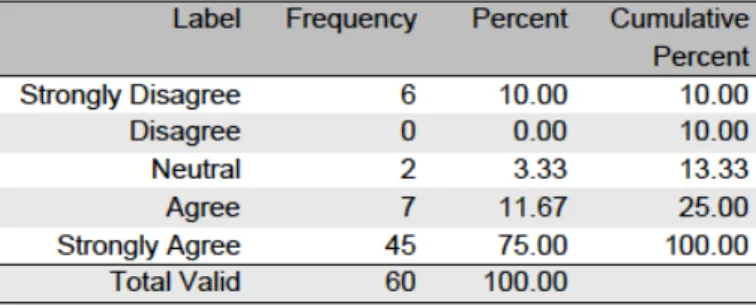
Others. Participants were asked to rate the entire event, encompassing all content. The majority
of respondents reported the activity was appropriate for their practice, with 75% in strong
agreement (see Figure3). Ninety percent reported the activity met the course objectives with
85% in strong agreement (see Figure 4).
Figure 3 Content Appropriate to Practice
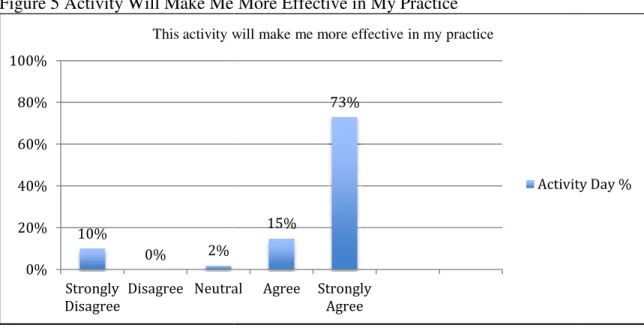
Eighty-eight percent reported the activity
practice (see Figure 5). This scoring
Figure 5 Activity Will Make Me More Effective in
Throughout the event every attempt was made to keep the content unbiased. Each
speaker had to attest to several items, including not having a conflict of interest (see Appendices
Q, R, & S). All but one respondent expressed the activity w
Figure 6).
Figure 6 Free from Commercial Bias
Ninety-three percent of respondents felt the activity had influenced them to
reevaluate their approach (see Figure
included use of teach back and overall communication
10% 0% 2% 0% 20% 40% 60% 80% 100% Strongly Disagree Disagree Neutral
This activity will make me more effective in my practice
reported the activity was likely to make them more effective in their
scoring was lower than the targeted goal of 90%.
igure 5 Activity Will Make Me More Effective in My Practice
Throughout the event every attempt was made to keep the content unbiased. Each
speaker had to attest to several items, including not having a conflict of interest (see Appendices
Q, R, & S). All but one respondent expressed the activity was free from commercial bias (see
Commercial Bias
three percent of respondents felt the activity had influenced them to
reevaluate their approach (see Figure 7). Areas identified most often as commitment
ach back and overall communication with patients (see Figure
15%
73%
Neutral Agree Strongly Agree
This activity will make me more effective in my practice
Activity Day %
was likely to make them more effective in their
Throughout the event every attempt was made to keep the content unbiased. Each
speaker had to attest to several items, including not having a conflict of interest (see Appendices
as free from commercial bias (see
three percent of respondents felt the activity had influenced them to change and
identified most often as commitment to change
(see Figure 8).
Figure 7 Intent to Change
Figure 8 Areas of Intent to Change
The commitment to change responses showed 93% of respondents committed to change
after attending this activity. This was above the targeted goal of 90%. After six weeks, the
follow-up survey revealed 92% remained influenced to change (see Figure 9). This too, was
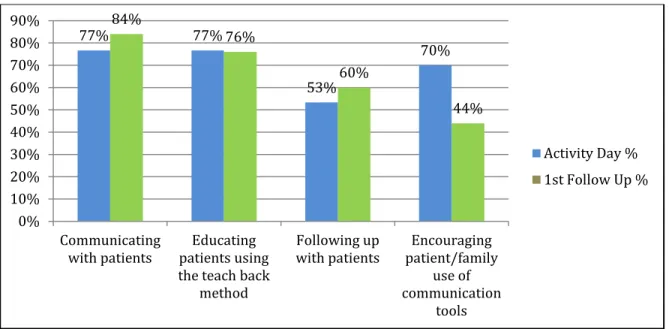
above the goal of 90%. In most cases, percentage results demonstrated minimal differences in
the areas respondents identified as intending to change in comparison to actual changes (see
Figure10)
77% 77%
53%
70%
0% 20% 40% 60% 80% 100%
Communicating with patients
Educating patients using the teach
back method
Following up with patients
Encouraging patient/family use of communication
tools Based on this activity, I intend to make changes regarding
(select all that apply):
Activity Day %
93%
0% 7%
0% 20% 40% 60% 80% 100%
Yes No Not sure at this time
Thinking back to the last 10 patients you saw with this condition, will this educational activity influence you to reevaluate your approach?
Figure 9 Intent to Change Comparative Analysis
Figure 10 Areas of Intent to Change Comparative Analysis
Results
Program Evaluation/Outcomes
Of the 92 attendees, 60 completed the evaluation the day of the activity, of those, 25
responded for the follow-up survey. There was a significant reduction in respondents during the
follow-up survey, in comparison to the number of respondents on the day of the activity. Only
93% 0% 7% 92% 8% 0% 0% 10% 20% 30% 40% 50% 60% 70% 80% 90% 100%
Yes No Not sure at this time
Thinking back to the last 10 patients you saw with this condition, (will/did) this educational activity influence you to reevaluate your approach?
Activity Day %
1st Follow Up %
77% 77% 53% 70% 84% 76% 60% 44% 0% 10% 20% 30% 40% 50% 60% 70% 80% 90% Communicating with patients Educating patients using the teach back
method Following up with patients Encouraging patient/family use of communication tools
Activity Day %
25 people responded during the follow
(see Figure 11). While the follow
the activity was successful. On the activity day, 93%
caused them to intend on changing how they communicate
unchanged, with 92% of respondents reporting the same
Figure 9). A higher percentage of providers actually changed how they communicate with
patients, 77% indicated they intended to change, wher
Figure 9). A significant decline in provider responses was seen with encouraging patients to use
communication tools. On the day of
encourage patients to use communication tools, but six weeks later
done this.
Figure 11 Activity Day and Follow
Tables 12 and 13 reveal a more detailed analysis of responses separated by physicians and
nurses (the two largest groups of providers). Overall, relatively the same percentage of providers
who intended to use teach back, actually util
and nurses separately, the data shows more
clinical practice than the physicians
15 2 11 0 0 10 20 30 40 50 60 Physician NP Respondent Demographics
25 people responded during the follow-up, of those 11 were physicians, 13 nurses, and 1 other
While the follow-up responses are low, those that submitted data
activity was successful. On the activity day, 93% of respondents reported the activity had
intend on changing how they communicate. This percentage remained relatively
unchanged, with 92% of respondents reporting the same during the follow-up evaluation
A higher percentage of providers actually changed how they communicate with
patients, 77% indicated they intended to change, whereas 84% reported actual change
Figure 9). A significant decline in provider responses was seen with encouraging patients to use
on tools. On the day of the activity, 70% of the respondents reported their intent to
ommunication tools, but six weeks later, only 44% of the
Figure 11 Activity Day and Follow-Up Respondent Demographics
s 12 and 13 reveal a more detailed analysis of responses separated by physicians and
largest groups of providers). Overall, relatively the same percentage of providers
use teach back, actually utilized it. However, when you evaluate the physicians
rses separately, the data shows more nurses reported they had used teach back in th
n the physicians (see Tables 12 &13).
41 2 60 13 1 25
Nurses Other Total
Respondent Demographics
Activity Day
1st Follow Up
up, of those 11 were physicians, 13 nurses, and 1 other
those that submitted data demonstrated
reported the activity had
e remained relatively
up evaluation (see
A higher percentage of providers actually changed how they communicate with
ctual change (see
Figure 9). A significant decline in provider responses was seen with encouraging patients to use
reported their intent to
, only 44% of the had actually
s 12 and 13 reveal a more detailed analysis of responses separated by physicians and
largest groups of providers). Overall, relatively the same percentage of providers
However, when you evaluate the physicians
ach back in their
Activity Day
Table 12
Nurses Intent to Change
______________________________________________________________________________
Answer Activity 1st Activity 1st
Day Follow-up Day % Follow-up %
Communicating with patients 37 12 90% 92%
Using teach back with education 35 13 85% 100%
Following up with patients 22 6 54% 46%
Use of communication tools 32 6 78% 46%
Table 13
Physicians Intent to Change
______________________________________________________________________________
Answer Activity 1st Activity 1st
Day Follow-up Day % Follow-up %
Communicating with patients 7 9 54% 82%
Using teach back with education 8 4 62% 36%
Following up with patients 8 7 62% 64%
Use of communication tools 7 4 54% 36%
During the follow-up evaluation, participants were asked to share examples of when they
utilized information from the activity with their patients.
• Cirrhosis patient with atrial fibrillation
• Easy to understand as RN what the needs are of patients
• Elderly frail debilitated male-used AJA and beta blocker
• I gave materials to patients and faculty in the Coumadin Clinic
• Able to use content with my mother-in-law
• Patient had nonchalant attitude towards his risk factors of A-Fib. I increased education and conversation of therapy and risks
• Teach back verification of understanding
The comments shared by the participants demonstrated appropriate use of teach back and an
overall conscious effort to improve the communication process with patients.
Discussion
Summary
Less than 50% of the original 60 reporting providers responded to the six-week follow-up
survey. Of the 25 follow-up surveys received, the breakdown was as follows: 73% physicians,
32% nurses, 0% nurse practitioners, and 50% others. In the future, more strategies will need to
be employed to capture a higher number of overall provider responses. It is possible, a higher
number of physicians responded to the follow-up survey since they understood the event had
been funded from the Physicians’ Institute. As a result, physicians may have felt more obligated
to report their changes. Follow-up surveys were mailed to the addresses provided by the
participants. This likely caused confusion since the initial evaluation asked for both an email and
US mail address. Some respondents may have only included their email address. Unfortunately,
we were unable to solicit responses via emails. The low follow-up responses may demonstrate
U.S. mail is not the most effective way to receive responses to surveys. There should be a strong
consideration for soliciting future responses via email.
The content of the findings also suggest other factors. Providers intended to encourage
patients and families to use electronic communication tools. However, in practice, it perhaps
place today to direct patients. The lower findings may also represent patients who had little
interest in using these tools. Other data showed a higher percentage of nurses used teach back
than originally intended, whereas the opposite was seen with physicians. More physicians
planned on using teach back, but only half of those responding actually integrated teach back
into their clinical practice. This may be due to physicians’ limited time constraints to “close the
feedback loop” with patients or perhaps another clinical provider, for example nurses, were more
available to teach patients.
Relation to Other Evidence
Evidence in the literature showed providers were less inclined to use teach back given
that it was perceived as being time consuming (Kornburger et al., 2013). This is understandable
for those patients that may require multiple reteaching sessions in order to close the feedback
loop. Press et al. (2012) determined that using teach back required three times as much time
educating patients. While the approach may require more time, it can be argued, if this is what is
required to generate comprehension, than this is the right approach for the patient.
During the event, providers were given information to assist with communicating with
patients. Providers were informed how technology could be used to enhance communication.
One example shared with the group involved electronic care plans that could be maintained and
shared across care settings and with the patient. Providers were also given information regarding
electronic healthcare information exchanges and patient electronic personal records or patient
portals. Providers were advised to encourage their patients to use electronic records as a means
to improve communication and ultimately quality.
At the time of the event, 70% of respondents expressed intent to encourage patients to use
actually encouraged patients to use these communication tools. These results are comparable to
outcomes provided in literature. There is literature that suggests patients fail to participate in
electronic patient portals because they lack interest or motivation (Goel, et al., 2011). Still,
others report nurses have struggled with these new forms of communication because it is
perceived as being additional work (Rodriguez, 2011). Lastly, while providers expressed intent
to use communication tools, Emont (2011) found sometimes it is the organization that is
reluctant to embrace these technologies due to concerns regarding costs, reimbursements and
liability.
Barriers To Implementation/Limitations
Barriers and limitations of this quality initiative were centered on the lack of direct
observations. Although the intent of this quality initiative was to change how providers
communicated with patients, the event did not include observed knowledge and behavior
assessments. During the event providers were given examples of how to incorporate teach back
into their clinical practice and only received a short, written assessment of their knowledge. At
the six-week follow-up assessment, providers self reported all data. As a result, there was no
ability to objectively monitor if providers had in fact changed their practice. Without
observations, the author also could not discern how effective providers were in their change.
Additional limitations included the low response rate. With only 27% of the 92 attendees
participating in the follow-up survey, attempts to measure success were problematic. The author
relied on limited data to analyze outcomes. While the reported change percentages are high, it is
important to caution against concluding most providers in attendance changed their practice. The
data was calculated using the number of responders as the denominator and not the number of
Limitations with Information Technology (I.T.) proved to be significant as it greatly
impacted the ability to provide the event online. During the planning phase, the intent had been
to video record the event and offer the educational program online via a link on the hospital’s
website. The online feature would have the ability to collect participant information and issue
continuing education credits at completion. However, the hospital’s I.T. department advised
they were unable to create this function and would need to spend costly dollars outsourcing the
labor. In the future, this issue could be resolved by uploading the video content on an external
website with a link from the hospital’s company website. While not recommended, another
alternative could exist by providing the content online, exclusively in written format.
Interpretation
Leading change is an arduous process and rarely can be achieved in a one-day training. The
results of this initiative were promising, yet extremely limited, since everyone did not respond,
there was no clear indication of how many of the total participants were influenced to change.
This event could have been more substantial with more responses and the incorporation of
role-play to assess levels of competency. However, the author recognizes observations during
training sessions and in clinical practice were not feasible for this audience. If the physicians’
patients could be studied, patient outcomes could have been used to measure change.
Measurements such as reducing acute care length of stay and 30-day readmissions would have
served as possible outcome metrics for large-scale training limited to inpatient and emergency
department providers. Still, the focus of this event was to engage providers throughout the
healthcare continuum (acute, ambulatory and community) with the intent of improving
or ambulatory settings only, which would allow better control of those being trained, observed
and measured.
Conclusions
Effective provider communication certainly serves as a tactic to enhance patient
understanding and engagement. At a minimum, health care providers have a responsibility to
ensure their patients can process information given to them. It is well established, that many
people suffer from low health literacy. Providers must be prepared to modify their
communication techniques to create better patient-provider partnerships.
Earlier, this document discussed how provider communication is linked to patient
engagement and ultimately improved outcomes. Details were provided that described a quality
improvement, educational event, aimed at raising awareness and influencing providers to adopt
change in communication with patients. The results were promising, and most responding
providers indicated they had incorporated new communication strategies with their patients.
There is confidence that these providers will positively transform their patient relationships with
all patients, not just those diagnosed with atrial fibrillation. This document should serve as a
catalyst, for both healthcare providers and leaders, to stimulate conversations regarding patient
communication. There should be thoughtful consideration for how to establish, manage and
sustain change in other settings.
Other Information
Funding
This quality initiative was grant funded by the Physicians’ Institute. The design and
Institute provided funding through commercial support from the Bristol-Myers Squibb/Pfizer
References
Beach, M. (2010). Enhancing communication for better patient outcomes. Johns Hopkins
Advanced Studies in Medicine, 10(2), 49-52.
Center for Advancing Health (2013). Retrieved from http://www.cfah.org/
Centers for Disease Control and Prevention (2013).Health literacy activities by state. Retrieved
from http://www.cdc.gov/healthliteracy/statedata/index.html#California
Centers for Medicare and Medicaid Services (2013).Readmissions reduction program.
Retrieved from
https://www.cms.gov/Medicare/Medicare-Fee-for-Service-Payment/AcuteInpatientPPS/Readmissions-Reduction-Program.html
Coleman, E. &Boult, C. (2003). Improving the quality of transitional care for persons with
complex care needs. Journal of American Geriatrics Society, 51(4), 556-7.
Denyes, M., Orem, D., & SozWiss, G. (2001). Self care: A foundational science. Nursing
Science Quarterly 14, 48-54.
DeWalt, D., Callahan, L, Hawk, V., Broucksou, K., Hink A, Rudd R, & Brach, C. Health (2010,
April). Literacy universal precautions toolkit (Publication No. 10-0046-EF). Rockville,
MD: Agency for Healthcare Research and Quality.
Divi, C., Koss, R., Schmaltz, S., & Loeb, M. (2007). Language proficiency and adverse events in
US hospitals: A pilot study. International Journal for Quality in Health Care, 19, 60–67.
Emont,S. (2011, May). Measuring the impact of patient portals: What the literature tells us.
California Healthcare Foundation.
Farrell, M., Kuruvilla, P., Eskra, K., Christopher, S. & Brienza, R. (2009). A method to quantify
and compare clinicians’ assessments of patient understanding during counseling of
Gerhardt, G., Yemane, A., Hickman, P., Oelschlaeger, A., Rollins, E., & Brennan, N. (2013).
Medicare readmission rates showed meaningful decline in 2012. Medicare and Medicaid
Research Review, 3(2). doi: http://dx.doi.org/10.5600/mmrr.003.02.b01
Goel, M., Brown, T., Williams, A., Cooper, A., Hasnain-Wynia, R., Baker, D., (2011). Patient
reported barriers to enrolling in a patient portal. Journal of the American Medical
Informatics Association, 18(1).
Haynes, K., Oberne, A., Cawthon, C. & Kripilani, S. (2012). Pharmacists' recommendations to
improve care transitions. Annals of Pharmacotherapy 46(9), 1152-9.
Health Research Action (2013).Overview of our services. Retrieved from
http://www.healthresearchforaction.org/services
Hibbard, J., Stockard, J., Mahoney, E., &Tusler, M. (2004). Development of the patient
activation measure (PAM): Conceptualizing and measuring activation in patients and
consumers. Health Services Research, 39(4), 1009-1032.
Institute for Healthcare Advancement (2013). Health literacy rewrite/redesign services.
Retrieved from http://www.iha4health.org/default.aspx/MenuItemID/335.htm
Institute for Healthcare Improvement (2013). Retrieved from
http://www.ihi.org/offerings/VirtualPrograms/Webinars/Web_Action/HealthLiteracy/Pag
es/schedule.aspx
Kandula, N., Malli, T., Zei, C., Larson, E., & Baker, D. (2011). Literacy and retention of
information after a multimedia diabetes education program and teach-back. Journal of
Health Communication, 16, 89–102.
Kemper, D. (2013, February 5). The accountable patient: The patient's role in the era of
http://www.healthwise.org/insights/healthwiseblog/dkemper/february-2013/1945.aspx
Kornburger, C., Gibson, C., Sadowski, S., Maletta, K. & Klingbeil, C. (2013). Using “Teach
Back” to Promote a Safe Transition FromHospital to Home: An Evidence-Based
Approach to Improving the Discharge Process. Journal of Pediatric Nursing 28, 282–
291.
Kripalani, S., Bengtzen, R., Henderson, L. & Jacobson, T. (2008). Clinical research in
low-literacy populations: using teach-back to assess comprehension of informed consent
and privacy information. IRB: Ethics & Human Research 30, 13-19.
Kutner, M., Greenberg, E., Jin,Y., & Paulsen, C. (2006). The Health literacy of America’s
adults: Results from the 2003 national assessment of adult literacy (NCES 2006–
483). U.S. Department of Education. Washington, DC: National Center for
Education Statistics.
Lewin, K. (1947). Frontiers in group dynamics. Human Relations,1(2), 143-153.
Lorber, J. (1975). Good patients and problem patients: Conformity and deviance in a general
hospital. Journal of Health and Social Behavior, 16(2), 213-225.
Mahramus, T., Frewin, S., Chamberlain, L., Wilson, D., Penoyer, D.,& Sole, M. (2012).
Evaluation of an educational intervention, utilizing simulation and a teach back (TB)
method, to increase nurses’ knowledge and retention of heart failure (HF)
self-management(SM) principles. Heart & Lung 41, 411-420.
National Center for Education and Statistics (2003). State and county estimates of low literacy.
Retrieved from http://nces.ed.gov/naal/estimates/StateEstimates.aspx
National Center for Educational Statistics (2013). Retrieved from