DEMOGRAPHIC RESEARCH
A peer-reviewed, open-access journal of population sciences
DEMOGRAPHIC RESEARCH
VOLUME 34, ARTICLE 39, PAGES 1075–1128
PUBLISHED 23 JUNE 2016
http://www.demographic-research.org/Volumes/Vol34/39/ DOI: 10.4054/DemRes.2017.34.39
Research Article
Child mortality estimation: An assessment of
summary birth history methods using
microsimulation
Andrea Verhulst
c
2017 Andrea Verhulst.
1 Introduction 1076
2 Summary birth history methods under study 1077
2.1 The Brass method and variants 1077
2.2 The methods of the Institute for Health Metrics and Evaluation 1079
3 Research questions 1080
4 Methods 1083
4.1 Data 1083
4.2 Microsimulation with Socsim 1083
4.3 Construction of the assessment tool 1085
5 Results 1087
5.1 Maternal age variants 1087
5.2 Time since first birth variants 1094
6 Discussion 1096
7 Acknowledgements 1098
References 1099
Child mortality estimation: An assessment of summary birth history
methods using microsimulation
Andrea Verhulst1
Abstract
BACKGROUND
Two types of indirect methods for estimating child mortality rates from summary birth histories (number of children ever born and children dead) are currently available to users: model-based methods derived from the pioneering work of Brass and empirically based methods developed more recently at the Institute for Health Metrics and Evaluation (IHME).
OBJECTIVE
The objective of this study is to evaluate the performance of six alternative indirect meth-ods based on summary birth histories.
METHODS
Using microsimulation based on the 1950–2010 fertility and mortality rates of the United Nations’ World Population Prospects, estimates generated by six alternative indirect meth-ods were compared against benchmark direct estimates for 82 countries.
RESULTS
The results show that the IHME methods outperform the classical Brass method. In par-ticular, the cohort-derived method is able to produce robust past child mortality trends across a variety of demographic regimes. However, no method produces robust recent es-timates prior to data collection. When data are classified by time since first birth, methods perform better than with maternal age classification.
CONCLUSIONS
This study suggests that the maternal age variant of the IHME cohort-derived method is the best option for estimating child mortality from past censuses. For future censuses, it would be worthwhile adding an extra question on date of first birth.
CONTRIBUTION
This study provides new recommendations on which method to use depending on the data available, as well as for future population census collection.
1. Introduction
Monitoring progress on child survival has been recognized to be of prime importance for public health and policy making. Most prominently, the United Nations Millenium Development Goal 4 set a target of reducing the under-five mortality rate2 (U5MR) by
two thirds between 1990 and 2015. In the post-2015 development agenda, Sustainable Development Goals target inequalities within countries, and challenge the existing meth-ods of measuring child mortality at the subnational level and for population subgroups (UNICEF 2015).
Against this backdrop, summary birth histories (SBHs), widely collected in censuses and surveys in developing countries, constitute a key source of information for such mon-itoring purpose. This study focuses on the indirect methods for estimating U5MRs from SBH data. Using microsimulation, we compare estimates generated by six alternative indirect methods against benchmark direct estimates. The objective is to evaluate com-paratively the performance of the methods and provide guidance on which one to use depending on the data available.
The most reliable data source for tracking progress on the U5MR is the vital registra-tion system. This poses challenges in most developing countries where this system does not exist or is incomplete. Under these conditions, analysts mostly rely on two classes of alternative data: SBHs and full birth histories (FBHs) (Hill 2013c). SBHs are collected by asking about women’s number of children ever born (CEB) and children dead (CD). FBHs include additionally the timing of births and deaths. In this case, child exposure to mortality risk is directly calculated by measuring the duration between births and the time of survey or using the age at death. Instead, SBHs require an indirect method to approximate the exposure. The classical Brass method uses the age of the mother as a proxy to do so (Brass and Coale 1968).
Both approaches are potentially affected by systematic errors. Direct estimates of the U5MR derived from FBHs are prone to data errors, mainly omissions and displacements over time of births and deaths (Hill 2013a). Indirect estimates derived from SBHs with the Brass method are additionally vulnerable to violations of underlying assumptions about past fertility and mortality (Hill 2013b). In particular, they are known to be strongly biased for the period closer to the time of data collection.
The direct estimation method based on FBHs is usually considered best practice when no comprehensive vital registration is available. However, the costs of acquiring quality information (training of interviewers, fieldwork supervision, etc.) make this ap-proach time-consuming and expensive. Consequently, the FBH apap-proach is regarded as ill-suited to apply to very large-scale data collection such as population censuses. FBHs are thus only collected in sample surveys such as the Demographic and Health Surveys
2The under-five mortality rate, also commonly denoted5q0, is the probability of dying between birth and the
(DHS). In contrast, the SBH approach has the advantage of being low-cost due to the minimal amount of information needed. As a result, SBHs are habitually collected in censuses (UN 2013a), and as such are better able to support growing requests for subna-tional and local estimates.
The plan of the paper is as follows: section 2 presents the SBH methods under study and summarizes their mechanics, as well as underlying assumptions. Section 3 explicates the adressed research questions. Section 4 describes the data used and the construction of the assessment tool based on microsimulation. Section 5 displays and analyzes the results. Finally, section 6 summarizes the main results and discusses the limitations of the study.
2. Summary birth history methods under study
Two types of indirect methods for analyzing SBHs are currently available to users: model-based methods derived from Brass’s pioneering work (Brass and Coale 1968), and em-pirically based methods developed more recently at the Institute for Health Metrics and Evaluation (IHME) by Rajaratnam et al. (2010).
2.1 The Brass method and variants
In the absence of information about the timing of births and deaths, the Brass indirect method makes use of maternal age as a proxy for approximating the children’s mean length of exposure to the risk of dying. In essence, the method uses multipliers to trans-form proportions dead of children, derived from SBHs and classified by five-year age group (15–19, etc., 45–49), into cohort-specific probabilities of dying (1q0,2q0,3q0,5q0,
10q0,15q0, and20q0). The original multipliers were calculated using relations between
the proportions dead of children and probabilities of dying captured in stable populations. These stable populations were simulated analytically using model age patterns of fertil-ity and mortalfertil-ity. The method has been improved over time supported by a number of variants of the original formulation. The standard version of the method (UN 1983) was proposed by Trussell (1975) who calculated multipliers using a regression approach first developed by Sullivan (1972). In the Trussell version we test in this paper, the user selects an appropriate model life table among the Coale and Demeny families (Coale, Demeny, and Vaughan 1966), according to the comparison of1q0and4q1from an external source (e.g. a FBH survey). To identify the underlying fertility pattern, the user must compute parity ratios (P15−19/P20−24andP20−24/P25−29), which aim to capture approximately the time distribution of past births.
al-locates estimates over time. This makes it possible to estimate a trend in child mortality for a period of about 15 years prior to data collection3. Since age of mother is used as proxy for the children’s exposure to mortality, the estimates that are closer to the time of data collection are associated with the declarations of the younger women. Conversely, estimates situated further back in time are derived from the cohorts born to older women. The main assumption of the Brass method is that the population has been approxi-mately stable. First, if fertility has been changing, the parity ratios computed at the time of data collection are distorted for true cohorts. This generates biases for estimates situ-ated further back in time. Second, if mortality has been changing, the estimates for past cohorts will not reflect mortality for a period of time close to data collection. However, as shown empirically by Feeney (1980), the assumption of constant mortality can be re-laxed to allow linear monotonic change when using the timing procedure (but the method remains incapable to capture abrupt changes in mortality).
Third, another important assumption of the method is that mortality does not vary by age of mother. Violation of this assumption usually leads to severe upward biases for recent estimates associated with women aged 15–19 and 20–24 (situated respectively around one and two years prior to data collection). This is due to above average risks of dying associated with young women. As a consequence, those recent estimates are usually ignored. The most robust estimate from the Brass method is considered the one associated with women aged 30–34, corresponding to mortality in the neighborhood of six years prior to data collection (Hill et al. 2012).
To improve recent estimates, a variant of the Brass method, based on the time elapsed since first birth instead of the age of mother, was developed by Hill and Figueroa (2001). This alternative classification of proportions dead considers jointly children born to women of different ages in the five-year duration groups (0–4, etc., 20–24) in order to reduce the biases associated with young women. Additionally, Hill (2013b) suggested that the variant would also better address changing fertility. This is because parity ratios
(P0−4/P5−9andP5−9/P15−19) used to capture the time distribution of past births would
be less vulnerable to distortion over time. However, performance of this variant has never been extensively evaluated.
The major drawback of the time since first birth variant is that it requires data on month and year of first birth. This item was not collected in past censuses, though avail-able in DHS surveys as well as in the UNICEF’s Multiple Indicator Cluster Surveys (MICS).
3After probabilities of dying at different ages of childhood are transformed into U5MRs using the relational
2.2 The methods of the Institute for Health Metrics and Evaluation
The IHME methods were developed more recently (Rajaratnam et al. 2010) in order to overcome the standard assumptions of the Brass method. Based on cohort and period measures of CD/CEB, the methods use random effects models to capture the country and regional variations in fertility and mortality in real datasets (166 DHS surveys collected from 1986 to 2008).
First, acohort-derived method uses the same cohort data and involves similar pro-cedures as those used by the Brass method. The method is based on the relation between proportions dead of children and U5MRs observed in surveys, controlling for the level and age pattern of fertility with the same parities than in the Brass method. The average timing of deaths for a given five-year cohort was first modeled through regression. Then, the corresponding period-specific U5MR derived from FBHs was regressed against the proportion dead of the cohort producing coefficients for prediction. The method aims to relax the original stable population assumption, and does not require choosing a model life table. Excess mortality related to young women was expected to be captured in the DHS data. However, due to errors associated with the small size of the subsamples of mothers aged 15–19 in surveys, the method produces unstable results (Rajaratnam et al. 2010). As a consequence, and as happens in the case of the Brass method, the estimate based on this age group is ignored. Therefore, the most recent estimate of mortality is associated with age group 20–24 and corresponds approximately to 3 years prior to data collection.
Second, aperiod-derived method transforms period proportions dead of children into U5MRs for each year prior to the data collection up to 25 years, thus producing very recent estimates. The period proportions dead of children are obtained using ex-pected frequency distributions of births and deaths over time. These time distributions were computed from DHS datasets for mothers classified by two-year age group, number of CD/CEB and world region. Again, the corresponding period-specific U5MRs derived from FBHs were regressed against the annual period proportions dead. The underlying assumption is that the time distributions can be generalized across space and time. Com-putation of period proportions dead requires access to microdata due to the non-standard tabulation of mothers.
Both the cohort- and period-derived methods feature random effects for countries that have at least one DHS survey included in the modeling. These are additive constants that adjust the predicted values associated with each country. Both methods have also a maternal age and a time since first birth variant to capture children’s exposure to mortality, thus totaling four variant methods. A fifth method combines these four using a loess smoothing regression, and is considered to be the one with optimal performance.
IHME methods cannot detect sudden changes in mortality. Second, and also as the Brass method, IHME methods are potentially vulnerable to selection biases due to the associa-tion between child mortality and mother survival4.
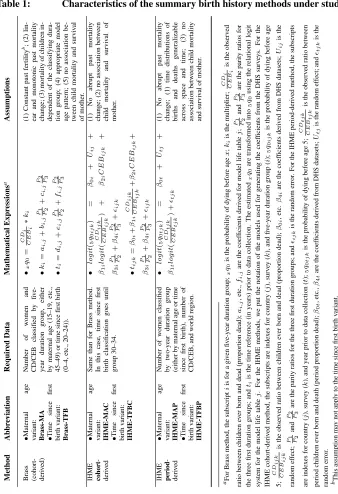
In this paper, the performance of six alternative SBH methods are evaluated: the Brass method and the IHME cohort- and period-derived methods, in each case for both the maternal age and time since first birth variants. Different combinations of IHME methods are also examined. Table 1 summarizes the charateristics of the six methods (abbreviation in the text, required data, mathematical expressions, and assumptions).
Figure 1 shows the U5MR indirect estimates of each of these methods when applied to the 2010 Colombian DHS survey, and compared against direct estimates derived from the FBHs collected in the same survey. The four IHME methods, as well as the time since first birth variant of the Brass method, tend to produce estimates that are more con-sistent with the direct ones than the standard maternal age variant of the Brass method, both for recent and past periods. Using the FBH estimates as reference, Rajaratnam et al. (2010) concluded that their combined method outperforms the standard Brass method by an average of 43.7%. However, this validation exercice is somewhat limited by weak in-dependence across the DHS datasets used to both build and validate the IHME methods5.
3. Research questions
In this study, we carry out a systematic assessment of the Brass and IHME methods through a broad set of fertility and mortality regimes generated by microsimulation. We address the following questions: (1) How robust are the estimates generated by the IHME methods compared to those produced by the Brass method? (2) How do the six alternative SBH methods perform under different fertility and mortality regimes? (3) Which SBH methods should be preferred depending on the available data? (4) Should the additional data about date of first birth be collected more widely in future censuses (and household surveys) in order to apply the corresponding variant methods?
4This kind of association generates selection biases when data are collected retrospectively. Children that are
not captured due to mother’s death (or absence) are generally considered at higher risk of dying (Hill 2013c).
5The validation data are the same as the data used to build the models. As a consequence, the results of
Table 1: Characteristics of the summary birth history methods under study Method Ab br eviation Requir ed Data Mathematical Expr essions a Assumptions
Brass (cohort- deri
v ed) • Maternal age v
ariant: Brass-MA •Time
si nce first birth v ariant: Brass-TFB Number of w omen and CD/CEB classified by fi v e-year duration group, either by maternal age (15–19, etc., 45–49) or time since first birth (0–4, etc., 20–24)). •x q0 = C D i C E Bi ∗ ki • ki = ai , j +
bi,
j
P1 P2
+
ci
,
j
P2 P3
• ti = di , j +
ei,
j
P1 P2
+
fi,
j
P2 P3
(1) Constant past fertility b; (2) lin-ear and monotonic past mortality change; (3) mortality of children in-dependent of the classifying dura-tion group; (4) appropriate model age pattern; (5) no association be-tween child mortality and survi v al of mother . IHME cohort -deri v ed • Maternal age v ariant: IHME-MA C • T ime si nce first birth v ariant: IHME-TFBC Same than for Brass method. In this case, time since first birth classification goes until group 30–34. • log it (5 q0 ij k ) = β0 i + Uij + β1 i log it ( C D ij k C E B ij k ) + β2 i C E Bij k + β3 i
P1 P2
+
β4
i
P2 P3
+ ij k • tij k = β0 i + β1 i C D ij k C E B ij k + β2 i C E Bij k + β3 i
P1 P2
+
β4
i
P2 P3
+ ij k (1) No abrupt past mortality change; (2) no association between child mortality and survi v al of mother . IHME period -deri v ed • Maternal age v
ariant: IHME-MAP •Time
si nce first birth v ariant: IHME-TFBP Number of w omen classified by tw o-year duration group (either by maternal age or time since first birth), number of CD/CEB, and w orld re gion. • log it (5 q0 tj k ) = β0 t + Utj + β1 t log it ( C D tj k C E B tj k ) + tj k (1) No abrupt past mortality change; (1) time distrib utions of births and deaths generalizable across space and time; (3) no association between child mortality and survi v al of mother . aF or Brass method, the subscript i is for a gi v en fi v e-year duration group; x q0 is the probability of dying before age x ; ki is the multiplier; C D i C E Bi is the observ ed ratio between children ev er born and dead (proportion dead); ai , j , etc.,
fi,
j are the coef ficients deri v ed for model life table j ;
P1 P2
and
P2 P3
are the parity ratios for the three first duration groups; and ti is the time reference (in years) prior to data collection. The estimated x q0 are transformed into 5 q0 using the relational logit system for the model life table j . F or the IHME methods, we put the notation of the models used for generating the coef ficients from the DHS surv eys. F or the IHME cohort-deri v ed method, the subscripts are inde x es for country ( j ), surv ey ( k ), and fi v e-year duration group ( i );5 q0 ij k is the probability of dying before age 5; C D ij k C E Bij k is the observ ed ratio between children ev er born and dead (proportion dead); β0 i , etc. β4 i are the coef fici ents deri v ed from DHS datasets; Uij is the random ef fect;
P1 P2
and
P2 P3
Figure 1: Comparison of summary birth history (SBH) and full birth history (FBH) estimates of the under-five mortality rate, derived from the 2010 Colombian DHS survey for six summary birth history methods
20 30 40 50
1985 1990 1995 2000 2005 2010 Year
U5MR (per 1000)
Data FBH SBH
Brass-MA
20 30 40 50
1985 1990 1995 2000 2005 2010 Year
U5MR (per 1000)
Data FBH SBH
Brass-TFB
20 30 40 50
1985 1990 1995 2000 2005 2010 Year
U5MR (per 1000)
Data FBH SBH
IHME-MAC
20 30 40 50
1985 1990 1995 2000 2005 2010 Year
U5MR (per 1000)
Data FBH SBH
IHME-TFBC
20 30 40 50
1985 1990 1995 2000 2005 2010 Year
U5MR (per 1000)
Data FBH SBH
IHME-MAP
20 30 40 50
1985 1990 1995 2000 2005 2010 Year
U5MR (per 1000)
Data FBH SBH
IHME-TFBP
4. Methods
4.1 Data
The simulations were based on country-specific fertility and mortality rates retrieved from the 2012 Revision of the United Nations World Population Prospects (WPP) for the period 1950–2010. Countries were selected depending on the coverage of their vital registration system. Only countries with less than 90% coverage, according to the UN Statistics Division, were considered (UN 2014a). Simulations were also performed for countries for which indirect estimates are included in the database created by the United Nations Inter-agency Group for Child Mortality Estimation (UN IGME). However, we excluded countries with less than 500.000 inhabitants in 2010, as well as those from Oceania that falls outside the regional coverage of the IHME methods. Furthermore, we also excluded countries with explicit HIV/AIDS modeling in the WPP, and other countries stricken by crises, such as the North Korean (DPR) famine crisis from the 1990s. These exclusions rest on our knowledge that episodic and abrupt changes in mortality due to epidemics, natural disasters, or political and economic crises lead to poor performance of the SBH methods. Silva (2012) showed that the Brass method should be used only for populations that have experienced either smooth mortality declines or only short periods of excess in their recent past. Rajaratnam et al. (2010) and Zimmerman (2014) also pointed out that the IHME methods are poorly suited to short-term fluctuations in mortality.
In all, 82 country-specific simulations were computed. They correspond to relatively smooth fertility and mortality trends that are distinguished by their level and rate of de-cline. Countries were divided into four world regions according to the classification used by Rajaratnam et al. (2010): Asia (ASIA), Latin America and the Caribbean (LATC), Northern Africa and the Middle-East (NAME), and the combination of (i) Southern East-ern and (ii) WestEast-ern and Central Sub-Saharan Africa, considered as a single Sub-Saharan region (SSA) due to the similarity of the results. A list of the selected countries and details about input rates are given in Appendix A.
DHS surveys were also used to capture and simulate the variation of the mortality risk by age of mother. More specifically, the 135 publicly available standard datasets collected between 1990 and 2013 in 46 of the 82 selected countries (see Appendix A) were used to produce a model of relative infant mortality risks by age group of the mother for each world region (see section 4.3).
4.2 Microsimulation with Socsim
Written in the 1970’s, it was designed to study the kinship networks shaped in different demographic regimes (Hammel et al. 1976).
There are several reasons that simulating populations at the individual level with Socsim is advantageous for assessing indirect methods. First, Socsim keeps track of a mother’s identification number. Hence, the tabulations that are required (see table 1) to apply the SBH methods can be easily extracted from the simulation outputs6. Second, the
U5MRs that underlie the simulations can be re-estimated directly using recorded dates of births and deaths in Socsim. These direct estimates constitute a benchmark against which we can assess the biases in the indirect estimates.
Within Socsim, the input and output populations are structured as data files in which individuals are single observations. In additional files, demographic rates (which include fertility, mortality and other transition rates) are specified as monthly probabilities of oc-currence. When a simulation is run, individuals are exposed to monthly risks for the specified events according to their sex, age or other defined group affiliation. The output population file records all affiliations, event occurrence dates (in months), and key iden-tification numbers for kinship linkage7. This allows reconstruction of all women’s birth histories.
At any time during the simulation, individuals have an event scheduled. The se-lection of the event and a waiting time until it occurs are determined through an event lottery within a competing risk framework. The algorithm is conceptually equivalent to comparing a random number drawn from the uniform (0,1) distribution interval to the probability of occurrence of the event by a particular monthT.This probability is given by the following expression:
1−
T
Y
t=0
(1−pt)
whereptis the probability of the event’s occurrence in monthtconditional on it not
hav-ing occurred at any time beforet. When the random number falls below the probability, the corresponding event is virtually scheduled. Then, the event with the shortest waiting time is assigned as the next one to the individual’s calendar. This random procedure is repeated after each event occurrence.
Due to the inherent stochastic nature of Socsim, the events are modeled as
ran-6These tabulations are difficult to represent analytically or with standard macrosimulation software. Although
proportions dead of children by age of mother or time since first birth can be represented formally (see Ap-pendix B), the standard expressions typically rely on the assumption of stability. Also computation ofperiod
proportions dead of children for the corresponding IHME method requires a count of women by number of CD/CEB, quantities that can only be retrieved from microdata.
7Socsim is based on a closed population model, that is, no individual can enter the population by a means
dom variables (with piecewise exponential distributions). Therefore, unlike deterministic macrosimulation, the expected value of an event is always affected by a sampling error in the microsimulation outputs (Van Imhoff and Post 1998). However, the variance of any quantity of interest can be estimated by running a simulation multiple times.
4.3 Construction of the assessment tool
Each country-specific simulation starts out with the same stable population. This pop-ulation was generated by maintaining constant a high regime of fertility (total fertility rate = 5) and mortality (U5MR = 220 per 1000) for 100 years8. We then used the vital rates from the WPP as inputs in the computations for each year segment during the period 1950–2010. To minimize random error, each of these country-specific simulations was replicated, and quantities of interest extracted and summed, 100 times (a check on the precision of the simulations is developed in Appendix B). As a consequence, no signif-icant sampling errors affect the simulated populations, and data extracted from them are equivalent to census information.
The populations were also generated without recall errors (e.g. omissions of births). Hence, sampling and non-sampling errors that potentially affect real data were removed. This allows us to focus on the instrinsic performance of SBH methods in different demo-graphic regimes, or equivalently, focus on the consequence of departures from assump-tions related to the prevailing demographic regimes. However, as an exception, we did not embed into the simulation selection biases caused by the association between child mor-tality and mother survival. The potential impact of the non-simulated biases and errors on estimates is discussed in section 6.
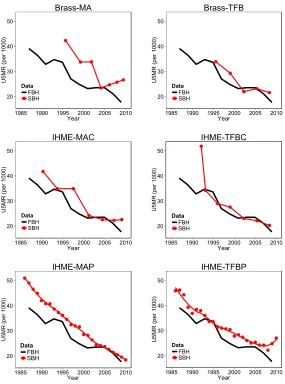
In order to vary the risk of mortality as a function of the age of mother at birth, a death rate multiplier was introduced to rescale the baseline mortality hazard rate sched-ule according to the individual-level characteristics at birth9. To capture different patterns across world regions, a hazard regression model was applied to the DHS data (see Ap-pendix A). The risks were estimated only for infants (age 0 to 1), considering that ma-ternal age ceases to have any relevant impact on children over 1 year (Fernandez 1985). Figure 2 shows the four estimated regional models of infant mortality risks that were in-cluded in the simulations. They mainly differ in the excess mortality associated with the age group 15–19, ranging from 1.1 to 1.5. Hence, the simulated maternal age effect was lower for Latin America and the Caribbean (LATC) and higher for Northern Africa and the Middle-East (NAME)10.
8The initial population is a small set of 3,000 individuals with no particular age or sex distribution. 9For this purpose a special “verhulst” version of Socsim was programmed (revision 52:53M, February 6,
2015).
10According to Collumbien and Sloggett (2001), changes in excess mortality may occur when fertility declines.
Figure 2: Regional models of relative infant mortality risks by age of mother at birth derived from DHS surveys
●
●
● ●
●
0.8 1.0 1.2 1.4
15−19 20−24 25−29 30−34 35−39 Age of Mother at Birth
Relativ
e Inf
ant Mor
tality Risk World
Region ●ASIA
LATC NAME SSA
Note: Regions are Asia (ASIA), Latin America and the Caribbean (LATC), Northern Africa and the Middle-East (NAME), and Sub-Saharan Africa (SSA).
All required data for the application of SBH methods (see Table 1) were extracted from the simulation outputs using the mother’s identification number. Data were extracted as if they had been collected at the end of 2010. The indirect methods were then applied to the simulated data using the equations and coefficients provided by Hill (2013b) for the Brass method and by Rajaratnam et al. (2010) for the IHME methods. In the case of the Brass method, the appropriate model age pattern of mortality was selected using the underlying WPP data as reference.
Deaths and exposure of children needed for direct estimation of the U5MR were also extracted and summed after each replication. This was carried out using the recorded dates of births and deaths as with FBH data. Period-specific estimates were computed using the synthetic cohort method described by Hill (2013a). In the absence of data errors, these are unbiasedestimates of the WPP input rates. As such, they were used as benchmark to evaluate the magnitude of the deviation of the indirect estimates from “true” parameters11.
However, the simulated WPP rates should not be considered exact replicas of the
15-19), whereas an increase could result from higher concentration of early childbearing among an increasingly disadvantaged group.
11The relative difference between the direct and indirect U5MR estimates was calculated for each time reference
actual demographic trends experienced by countries. They are themselves smoothed esti-mates based on defective data, including SBHs (Gerland 2014; UN 2014b). Nonetheless, the purpose of using these rates is simply to examine comparatively the performance of the SBH methods in a range of known demographic regimes12.
5. Results
5.1 Maternal age variants
To estimate under-five mortality from past censuses, users are limited to SBHs classi-fied by maternal age. As a result, they will have the option of applying only three of the six methods under study: the Brass-MA and IHME-MAC and -MAP methods. The Brass-MA and IHME-MAC methods use the same cohort data aggregated by five-year group of mothers. The IHME-MAP method uses a special tabulation of women classified by two-year age group and number of CD/CEB. If microdata are available to compute this nonstandard tabulation, Rajaratnam et al. (2010) recommend using the IHME-MAP method in combination with the IHME-MAC method. If only standard five-year aggre-gated data are available, the authors suggest using only the IHME-MAC method.
(1) The cohort-derived Brass-MA and IHME-MAC methods and (2) the combina-tion of IHME-MAC and -MAP methods are analyzed separately in the next two seccombina-tions.
5.1.1 Cohort-derived methods: Brass vs. IHME
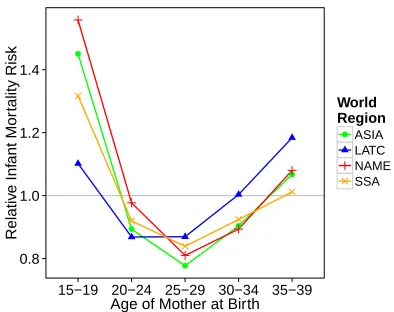
Figure 3 summarizes the relative deviation from benchmark of the U5MR estimates pro-duced by the Brass-MA and IHME-MAC methods across world region. The median of the deviation is represented over time, while the bands cover the maximum and minimum deviations observed13. The diamonds correspond to the mean values. The grey lines de-limit an upper and lower 10% deviation interval. Numeric results as well as individual plots for each country are shown in Appendix D.
di=
ˆ
xi,indirect−ˆxi,direct ˆ
xi,direct wherexˆi,directandˆxi,indirectare the estimates derived respectively from the direct and
indirect methods for thei-th year prior to data collection.
12This is as previous works have done when evaluating selection biases in the estimation of adult mortality
from sibling survival information (Bergouignan 2010; Masquelier 2012).
13Figure 3 does not show the outliers detected using the Tukey (1977) rule, that is if the observation is higher
Figure 3: Relative deviation from benchmark of the under-five mortality rate estimates generated by the maternal age variant of the cohort-derived methods over time and across world regions
-20 0 20 40
-20 0 20 40
-20 0 20 40
-20 0 20 40
ASIA
LATC
NAME
SSA
1992 1994 1996 1998 2000 2002 2004 2006 2008 2010
Year
Relative Deviation (%)
Method Brass-MA IHME-MAC
Estimates are associated with mothers aged 20–24 to 45–49. The first estimate on the right (the most recent) is associated with age group 20–2414 and situated slightly further than two years prior to data collection (end of 2010) for the Brass-MA method. The IHME-MAC estimates are situated further back in the past and cover larger periods of time than the Brass-MA ones. For example, the second estimate is situated on average six years prior to data collection, the same as for the third estimate generated by the Brass-MA method. This is because the IHME-Brass-MAC estimates are better situated over time as the results prove.
Indeed, except for the first estimate, the IHME-MAC method shows good perfor-mance across world regions with an average deviation from benchmark close to zero. The method is particularly robust for the second, third and fourth estimates (associated with age groups 25–29 to 35–39) situated between six and 12 years prior to data collec-tion, with about 90% of estimates within a 10% deviation interval. The older estimates accumulate the experience of older birth cohorts over longer periods of time, and conse-quently, are a bit noisier.
On the other hand, the Brass-MA method contrasts with an uniform and positive overestimation growing through older cohorts up to 20% on average for all regions. The Brass estimate based on reports from women aged 30–34 (third on the plot), usually considered the most robust, is overestimated on average by 10%. The single comparison of Brass estimates from the 1970 census of Belgium with official life table values derived from the vital registration system, carried out by Hill (1984), shows differences that fit within the range of magnitude observed from the simulations (respectively for age groups 30–34 and 45–49, slightly more than 10% and a bit less than 20%).
The first Brass-MA estimate, associated with women aged 20–24, tend to be upward biased because of the persistent effect of excess mortality associated with young moth-ers. Although children born to women aged 20–24 do not experience excess mortality themselves (see Figure 2), birth cohorts associated with this age group still reflect the mortality experienced earlier when mothers were aged 15–19. This bias tends to be offset through older cohorts, but has still a potential impact on past estimates. Although the IHME-MAC method tends to control better for this bias, the first recent estimate is still subject to important deviations.
The improved results obtained with the IHME-MAC method, in comparison with the Brass-MA method, stem from the different way these methods capture children’s exposure to mortality. On the one hand, the Brass method is based on simulation of stable populations, and thus is exposed to simplifying assumptions on fertility and mortality. Notably, the declining fertility ongoing in the developing world distorts the parity ratios (P15–19/P20–24 and P20–24/P25–29), which generates an underestimation of the lengths of
exposure. As explained by Hill (2013a, p. 163):
14The more recent estimate associated with age group 15–19 was excluded from the analysis due to known
The parity ratios as observed at the time of the survey [are used] to reflect the time distribution of births in the past. [...] If fertility is declining [...], the parities for the younger women will be lower and those for the older women higher, reducing the parity ratios below the values for any true cohort. This will give the appearance of more recent childbearing (and thus lower aver-age duration of child exposure to the risk of dying) than is really the case, and thus lead to over-estimates of child mortality.
That explains partly why deviation tends to be lower in Sub-Saharan countries (SSA), given the lower rates of decline than in other regions. Correction of this bias is rather lim-ited. For example, Silva (2012) showed that using true cohort parities available from FBHs could improve the estimates. However, when FBH data are available to do so, there is little advantage to use indirect estimates over direct ones. Furthermore, depar-tures from the linear mortality change assumption have potentially a stronger impact on the Brass estimates (evidence is given in Appendix C).
On the other hand, the IHME-MAC method uses country random effects models to capture exposure in real data collected in diverse demographic contexts. In this case, deviation from benchmark is expected to be random. Good Performance across world region is a good indicator of the validity of such assumption. Indeed, excluding the first estimate, none of the regions is subject to significant systematic errors. However, results for Northern Africa and the Middle-East (NAME) show more variability. This is also the region where the Brass method is the most biased, and therefore where departure from stability is the strongest. The higher variability of the IHME-MAC estimates is likely due to the smallest number of DHS surveys collected in this region, and thus included in the modeling (20 out of 166 surveys).
Finally, it should be noted that, starting from the second estimate, random effects have almost no impact, evidencing no need for national or regional adjustment of the model. Therefore, one could conclude that the IHME-MAC method produces rather ro-bust past trends throughout a variety of demographic transition stages, and as such should be generalizable at the subnational levels and for population subgroups.
5.1.2 Period-derived method and combination
perform best. However, when data on first birth is not avaible to generate the total combi-nation, the authors suggest combining the maternal age variants only (IHME-MAP with -MAC methods15).
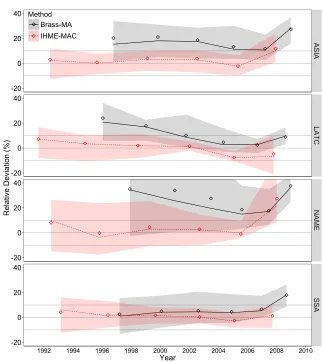
As shown in Figure 4, this maternal age combined method tends to produce rather mixed results. The overall deviation is rather good with an average close to zero. How-ever, the most robust estimates tend to be situated in the middle of the trends. Recent estimates tend to be too high or too low (over and under 10% on average for the two first estimates). Moreover, the variability of deviation is higher than with the single cohort-derived method. In particular, the recent estimates are subject to high uncertainty (up to 40% of error for the two first years prior to data collection).
Furthermore, users must keep in mind that the combined method is dependent upon one critical assumption underlying the IHME-MAP method. This is that within a given region, the time distribution of births and deaths of women in a given two-year age group and with a given number of CD/CEB can be generalized across countries and time peri-ods. Because of the disparities in demographic changes within a country, the assumption could be particularly hazardous to make when capturing subnational trends. For illus-trative purpose, Figure 5 shows, for each region, the deviation for aggregated five-year period estimates, when using different regional expected time distributions of births and deaths. Countries in Asia and Latin America and the Caribbean (LATC) can easily switch their time distributions without strong distortions in the trends. This is because of their similar stage in the demographic transition. Nonetheless, using the expected time distri-butions of these world regions in Sub-Saharan (SSA) countries leads to strong overesti-mation of mortality declines. This misuse of the method is likely to be a concern for the subnational regions of Asia, Latin America and the Caribbean, and Northern Africa and the Middle-East that lag behind in the fertility and mortality decline. Conversely, the com-bined method is expected to underestimate mortality decline in the most advanced areas of Sub-Saharan Africa (such as urban areas). This warning also applies when estimat-ing mortality for subpopulation groups. For this reason, the sestimat-ingle IHME-MAC method should be preferred over the combined one due to its robustness in diverse demographic regimes.
Figure 4: Relative deviation from benchmark of the under-five mortality rate estimates generated by the maternal age variant of the combined IHME method over time and across world regions
-20 0 20 40
-20 0 20 40
-20 0 20 40
-20 0 20 40
ASIA
LATC
NAME
SSA
1986 1988 1990 1992 1994 1996 1998 2000 2002 2004 2006 2008 2010
Year
Relative Deviation (%)
Figure 5: Relative deviation from benchmark of the under-five mortality rate estimates generated by the maternal age variant of the combined IHME method over time and across world regions, using different regional expected time distributions of births and deaths
Expected ASIA Expected LATC Expected NAME Expected SSA
-20 0 20 40
-20 0 20 40
-20 0 20 40
-20 0 20 40
ASIA
LATC
NAME
SSA
1990 1995 2000 2005 1990 1995 2000 2005 1990 1995 2000 2005 1990 1995 2000 2005 Year
Relative Deviation (%)
5.2 Time since first birth variants
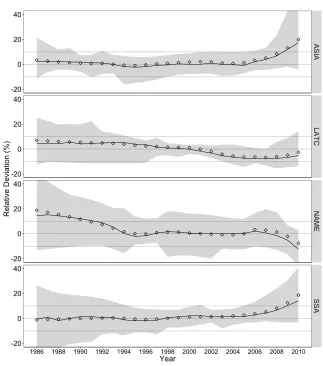
Figure 6 summarizes the results for the time since first birth variant of cohort-derived methods (Brass-TFB and IHME-TFBC) across world regions. The time trends corre-spond to the estimates associated with duration groups 0–4 (first on the right and situ-ated on average two years prior to data collection) to 20–24. For IHME-TFBC method, additional results (more unstable) for duration groups 25–29 and 30–34 are shown in Appendix D.
For the Brass-TFB method, the most recent estimate is affected by an upward bias up to 10%. This bias is smaller than for the recent estimate based on age group 20– 24, but still reflects the excess mortality associated with young mothers. The IHME-TFBC estimates are slightly better on average, but they are far more noisy. However, these results should be taken with caution. In the real world, the mortality risk varies not only with maternal age but also with birth order, which was not simulated and to which the variant is potentially vulnerable. First births are usually considered at higher risk compared to higher-order births (Hill 2013b), and thus the overestimation could be greater than observed in the simulations. However, this potential upward effect could also be offset by lower mortality risks for higher-order children born within the five years since first birth.
For estimates situated further in the past, both methods outperform their maternal age counterpart and show higher stability across regions. For the Brass-TFB method, more than 90% of estimates associated with duration groups 5–9 and 10–14 (second and third on the plot) fall within a 10% deviation interval. The IHME-TFBC method produces similar average trends than the IHME-MAC method but with less uncertainty.
This higher performance over the maternal variant is likely due to the way it captures the time distribution of past births through parity ratios. As explained earlier, with the age variant, when fertility is declining the parity ratios are distorted giving the appearance of a shorter time exposure. With the time since first birth variant, Hill (2013b) suggested that the parity ratios tend to be more stable over time. Hence, this duration variant would control, to some extent, for the fertility decline. Nonetheless, the Brass-TFB method is still subject to some important upward biases for estimates situated further back in time, which is also attributable to non-linear changes in mortality (see in Appendix C). In the case of the IHME-TFBC method, although the maternal age variant was already designed to control for fertility decline, the stability of the parity ratios over time seems to bring even more robustness to the estimates.
Figure 6: Relative deviation from benchmark of the under-five mortality rate estimates generated by the time since first birth variant of the cohort-derived methods over time and across world regions
-20 0 20 40
-20 0 20 40
-20 0 20 40
-20 0 20 40
ASIA
LATC
NAME
SSA
1996 1998 2000 2002 2004 2006 2008 2010
Year
Relative Deviation (%)
Method Brass-TFB IHME-TFBC
6. Discussion
In this study, six indirect methods for estimating U5MR trends from SBHs were evalu-ated using microsimulation. These methods belong to two main categories: model-based methods derived from Brass’s pioneering work and empirically based methods developed at the IHME. The IHME methods are themselves classified into two categories: a cohort-derived method using the same cohort data as the Brass method, and a period-cohort-derived method based on regional time distributions of births and deaths. Furthermore, both the Brass and IHME methods include two variants depending on the proxy used to capture the exposure to mortality, either maternal age or time since first birth. In order to assess their comparative performance, indirect estimates were compared against benchmark direct es-timates, both derived from country-specific simulations. The simulations were generated based on the WPP fertility and mortality rates for 82 countries reflecting a good diversity of international demographic experience.
The main findings of this study can be summarized as follows: (1) using the same data, the maternal age variant of the IHME cohort-derived method (IHME-MAC) outper-forms the standard Brass method (Brass-MA), and is able to produce rather robust past trends across different demographic regimes. However, the IHME-MAC method hardly produces robust estimates within the 5 years prior to data collection. (2) The IHME-MAC method should be preferred over the recommended combinations with other IHME methods. (3) The time since first birth variant of the Brass and cohort-derived IHME methods (Brass-TFB and IHME-TFBC) perform better than their respective maternal age counterparts.
Consequently, when users dispose of SBHs classified by maternal age (as collected in past censuses), this study suggests using the IHME-MAC method. Combination with the IHME-MAP method does not provide additional insights. Moreover, this combination relies on the assumption that time distribution of births and deaths can be generalized across space and time, which was shown to be particularly risky when estimation is made at the subnational level (or for specific subpopulation groups).
birth in future censuses (and household surveys), which the United Nations has already recommended for the 2020 census round (UN 2015).
Other biases and errors that may exist in the real word were not simulated in this study, including: (1) selection biases due to association between child mortality and mother survival, and (2) sampling and non-sampling errors that may affect the data prior to the application of SBH methods. Reasoned speculations as to the direction and magni-tude of these biases and errors are as follows.
Firstly, selection biases would underestimate the U5MRs. When data are collected retrospectively, children whose mothers are deceased (or absent) are not captured. These children that are not captured are usually considered at higher risk of dying (Hill 2013c). Strong association between child and mother mortality has been related to the vertical transmission of HIV from mother to child in generalized epidemic context (Walker, Hill, and Zhao 2012). However, in low HIV-prevalence contexts (less than 5%), the bias is no expected to have a strong impact on indirect estimates16.
Secondly, data errors can bias indirect estimates either downward or upward. How-ever, such errors are particularly difficult to identify without a gold-standard reference. Concerning non-sampling errors (e.g., age misreporting, omissions of births, etc.), exist-ing data quality assessment techniques are rudimentary and hardly inform the magnitude of errors17. Estimates derived from declarations of women older than 39 years old are generally considered more vulnerable to recall errors (Silva 2012). Such errors are usu-ally considered modest among younger women. However, further work is needed to develop better data quality diagnostics for SBHs collected in censuses and surveys.
Finally, we end referring to recent developments on mortality estimation based on massive datasets such as those of the UN IGME, Global Burden of Disease (GBD) Study, and Latin American Mortality Database (LAMBdA). Instead of choosing a single mor-tality estimate among several existing ones for a single year, these projects consider all available estimates taking their inherent uncertainty/bias into account. The idea is to blend redundant estimates derived from the application of different estimation methods on multiple datasets and to associate each of these either with fixed effect biases ac-cording to the data source (Alkema and New 2014; Wang and al. 2014) or with a level of uncertainty reflecting the probability that underlying assumptions are violated under a particular set of conditions (Palloni and Beltrán-Sánchez 2016). Thus, the results of our study, and further simulations, might be useful as input to these complex estimation procedures that require integration of multiple available data and methods.
16“Drawing on the pattern of bias by HIV prevalence found by Ward and Zaba (2008), the child mortality
estimate obtained by standard analysis of a summary birth history could be adjusted upwards by three points per thousand for every 10 percentage points of HIV prevalence” (Hill 2013c, p. 146).
17 These techniques mostly consist of examining age heaping, sex ratio, and average number of CD/CEB
7. Acknowledgements
I especially thank Carl Mason and Bruno Masquelier for their assistance with microsim-ulation using Socsim. I am grateful to Hiram Beltrán-Sánchez, Patrick Gerland, Bruno Masquelier, Alberto Palloni, Jon Pedersen, Tim Miller, and Bruno Schoumaker for their advice and manuscript reviews. I’m also thankful to Jee Jee Kim for enhancing my writ-ing. Finally, I appreciate the editor and reviewers for helping me to improve this paper. This research was funded with a doctoral fellowship from the Belgian National Fund for Scientific Research (F.R.S.-FNRS).
Corrections:
References
Alkema, L. and New, J. (2014). Global estimation of child mortality using a bayesian b-spline bias-reduction model. The Annals of Applied Statistics 8(4): 2122–2149.
doi:10.1214/14-AOAS768.
Bergouignan, C. (2010). Recourir aux microsimulations pour dier la mortalit crise : illus-tration par la mortalit Burundi en 1993. Cahiers qucois de dgraphie40(2): 299–329.
doi:10.7202/1011543ar.
Brass, W. and Coale, A. (1968). Methods of analysis and estimation. In: Brass, W., Coale, A., Demeny, P., Heisel, D., Lorimer, F., Romaniuk, A., and van de Walle, E. (eds.).The
demography of tropical africa. Princeton: Princeton University Press: 88–150.
Coale, A., Demeny, P., and Vaughan, B. (1966). Regional model life tables and stable
populations. Princeton: Princeton University Press.
Collumbien, M. and Sloggett, A. (2001). Adjustment methods for bias in the indirect childhood mortality estimates. In: Zaba, B. and Blacker, J. (eds.).Brass tacks: Essays
in medical demography. London: Athlone Press: 20–42.
Cox, D. (1972). Regression models and life-tables. Journal of the Royal Statistical
Society. Series B (Methodological)34(2): 187–220.
Feeney, G. (1980). Estimating infant mortality trends from child survivorship data.
Pop-ulation Studies34(1): 109–128. doi:10.2307/2173698.
Fernandez, R. (1985). The influence of differentials in child mortality by age of the mother, birth order, and birth spacing on indirect estimation methods. [PhD Thesis]. London School of Hygiene and Tropical Medicine.
Gerland, P. (2014). UN Population Division’s methodology in preparing base popula-tion for projecpopula-tions: Case study for India. Asian Population Studies10(3): 274–303.
doi:10.1080/17441730.2014.947059.
Hammel, E., Hutchinson, D., Wachter, K., Lundry, R., and Deuel, R. (1976). The socsim demographic-sociological microsimulation program: Operating manual. Institute of International Studies, UC Berkeley. Research series 27.
Heligman, L. and Pollard, J. (1980). The age pattern of mortality.Journal of the Institute
of Actuaries107(434): 49–80.doi:10.1080/17441730.2014.947059.
Hill, K. (1984). An evaluation of indirect methods for estimating mortality. In: Vallin, J., Pollard, J., and Heligman, L. (eds.).Methodologies for the collection and analysis of
mortality data. Li: Odina Editions: 145–176.
T., Dorrington, R., Hill, A., Hill, K., Tim, I., and Zaba, B. (eds.).Tools for demographic
estimation. Paris: International Union for the Scientific Study of Population: 166–177.
Hill, K. (2013b). Indirect estimation of child mortality. In: Moultrie, T., Dorrington, R., Hill, A., Hill, K., Tim, I., and Zaba, B. (eds.).Tools for demographic estimation. Paris: International Union for the Scientific Study of Population: 148–164.
Hill, K. (2013c). Introduction to child mortality analysis. In: Moultrie, T., Dorrington, R., Hill, A., Hill, K., Tim, I., and Zaba, B. (eds.).Tools for demographic estimation. Paris: International Union for the Scientific Study of Population: 141–146.
Hill, K. and Figueroa, M.E. (2001). Child mortality by time since first birth. In: Zaba, B. and Blacker, J. (eds.).Brass tacks: Essays in medical demography. London: Athlone Press: 9–19.
Hill, K., You, D., Inoue, M., Oestergaard, M., and TAG (2012). Child mortality estima-tion: accelerated progress in reducing global child mortality, 1990–2010. PLoS Med
9(8): e1001303. doi:10.1371/journal.pmed.1001303.
Mason, C. (2013). Socsim oversimplified. [electronic resource]. De-partment of Demography, UC Berkeley. Consulted on May 1, 2015. http://lab.demog.berkeley.edu/socsim/CurrentDocs/socsimOversimplified.pdf.
Mason, C. (2014). Demographic models. In: O’Donoghue, C. (ed.).Handbook of
mi-crosimulation modelling. Bradford: Emerald Group Publishing: 345–365.
Masquelier, B. (2012). Adult mortality from sibling survival data: A reappraisal of selec-tion biases. Demography50(1): 207–228. doi:10.1007/s13524-012-0149-1.
Palloni, A. and Beltrán-Sánchez, H. (2016).Uncertainty and mortality estimates in Latin
American and Caribbean (LAC) region: 1850–2010. Paper presented at Population
Association of America Meeting, Washington DC, March 31 - April 2.
Preston, S., Heuveline, P., and Guillot, M. (2001).Demography. Measuring and modeling
population processes. Oxford: Wiley-Blackwell.
Rajaratnam, J., Tran, L., Lopez, A., and Murray, C. (2010). Measuring under-five mortality: Validation of new low-cost methods. PLoS Med 7(4): e1000253.
doi:10.1371/journal.pmed.1000253.
Schmertmann, C. (2012). Calibrated spline estimation of detailed fertility schedules from abridged data. Rostock: Max Planck Institute for Demographic Research. (MPIDR working paper, WP-2012-022).
Silva, R. (2012). Child mortality estimation: Consistency of under-five mortality rate esti-mates using full birth histories and summary birth histories.PLoS Med9(8): e1001296.
Sullivan, J. (1972). Models for the estimation of the probability of dying between birth and exact ages of early childhood.Population Studies26(1): 79–97.
Trussell, J. (1975). A re-estimation of the multiplying factors for the Brass technique for determining childhood survivorship rates. Population Studies29(1): 97–107.
Tukey, J. (1977). Exploratory data analysis. Don Mills: Addison-Wesley Publishing Company.
UN (1983). Manual X: Indirect techniques for demographic estimation. New York: United Nations.
UN (2013a). Implementation of united nations recommendations for population census topics in the 2010 round. New York: Statistic Division, Economic and Social Affairs. United Nations Expert Group Meeting on revising the principles and recommendations for population and housing censuses, New York, October 31 - November 1.
UN (2013b). Mortpak for windows (version 4.3). New York: Population Division, Eco-nomic and Social Affairs.
UN (2014a). Coverage of birth and death registration. [electronic resource]. Statis-tic Division, Economic and Social Affairs. Consulted on November 1, 2014. URL http://unstats.un.org/unsd/demographic/CRVS/CR_coverage.htm.
UN (2014b). World population prospects: The 2012 revision - methodology of the united nations population estimates and projections. New York: Population Division, Eco-nomic and Social Affairs.
UN (2015). Principles and recommendations for population and housing censuses: the 2020 round (revision 3 - draft). New York: Statistical Commission, Economic and Social Affairs. Forty-sixth session, 3 - 6 March.
UNICEF (2015). A post-2015 world fit for children. a review of the open working group report on Sustainable Development Goals from a child rights perspective. [electronic resource]. Consulted on May 1, 2016. http://www.unicef.org/post2015/files/Post_2015_OWG_review_CR_FINAL.pdf.
Van Imhoff, E. and Post, W. (1998). Microsimulation methods for population projections.
Population: An English Selection (Special Issue)10: 97–138.
Walker, N., Hill, K., and Zhao, F. (2012). Child mortality estimation: Methods used to adjust for bias due to AIDS in estimating trends in under-five mortality. PLoS Med
9(8): e1001298. doi:10.1371/journal.pmed.1001298.
doi:10.1016/S0140-6736(14)60497-9.
Ward, P. and Zaba, B. (2008). The effect of HIV on the estimation of child mortality using the children surviving/children ever born technique.Southern African Journal of
Demography11(1): 39–73.
Appendices
A Microsimulation inputs
United Nations’ World Population Prospects
Below is a list of the 82 selected countries for which the WPP fertility and mortality rates were simulated:
Asia Latin America and Northern Africa and Sub-saharan the Caribbean the Middle-East Africa
Afghanistan Bolivia Algeria Angola
Bangladesh Brazil Armenia Benin
Bhutan Colombia Azerbaijan Burkina Faso Burma Dominican Republic Georgia Chad
Cambodia Ecuador Iran Comoros
India El Salvador Iraq Congo (DRC)
Indonesia Guatemala Jordan Djibouti
Kazakhstan Guyana Lebanon Equatorial Guinea
Kyrgyz Republic Haiti Libya Eritrea
Lao Honduras Morocco Ethiopia
Mongolia Jamaica Oman Gambia
Nepal Mexico Palestine Ghana
Pakistan Nicaragua Sudan Guinea
Philippines Panama Syria Guinea-Bissau
Tajikistan Paraguay Tunisia Liberia
Thailand Peru Turkey Madagascar
Timor-Leste Suriname Western Sahara Mali Turkmenistan Uruguay Yemen Mauritania
Uzbekistan Venezuela Niger
Vietnam Nigeria
Senegal Sierra Leone Somalia South Sudan Togo
Single year age-specific fertility rates were smoothed from the WPP abridged data using the calibrated spline estimator developed by Schmertmann (2012). The abridged life tables were interpolated only for ages 2, 3, and 4, to which indirect estimates are sensitive, using the ICM application18 of the UN’s MORTPAK software package (UN
2013b). The fertility rates and the logarithms of the central rates of mortality, published
18The ICM application of the UN MORTPAK software package is derived from the first term of the Heligman
by five-year period, were then interpolated annually between 1950 and 2010 using natural cubic splines.
Demographic and Health Surveys
Below is a list of the 135 publicly available standard datasets collected between 1990 and 2013 in 46 of the 82 selected countries for this study. They were used to capture and simulate the variation in infant mortality risk according to the five-year age group of the mother by world region.
Country DHS dataset(s)
Armenia 2000, 2005, 2010 Azerbaijan 2006
Bangladesh 1993, 1996, 1999 2004, 2007, 2011 Benin 1996, 2001, 2006
2011
Bolivia 1994, 1998, 2003 2008
Brazil 1991, 1996 Burkina Faso 1993, 1998, 2003
2010
Burundi 2010
Cambodia 2000, 2005, 2010
Chad 1996, 2004
Colombia 1990, 1995, 2000 2005, 2010 Comoros 1996, 2011 Congo (DRC) 2007, 2013 Dominican Republic 1991, 1996, 1999
2002, 2007, 2013 Ethiopia 2000, 2005, 2011 Ghana 1993, 1998, 2003
2008 Guatemala 1995
Guinea 1999, 2005, 2012
Guyana 2009
Haiti 1994, 2000, 2005 2012
Honduras 2005, 2011 India 1992, 1998, 2005 Indonesia 1991, 1994, 1997 2002, 2007, 2012
Country DHS dataset(s)
Jordan 1990, 1997, 2002 2007, 2012 Kazakhstan 1995, 1999 Kyrgyz Republic 1997, 2012 Liberia 2007, 2013 Madagascar 1992, 1997, 2003
2008
Mali 1995, 2001, 2006 2012
Morocco 1992, 2003 Nepal 1996, 2001, 2006
2011 Nicaragua 1998, 2001 Niger 1992, 1998, 2006
2012
Nigeria 1990, 1999, 2003 2008, 2013 Pakistan 1990, 2006, 2012 Paraguay 1990
Peru 1991, 1996, 2000 Philippines 1993, 1998, 2003
2008, 2013 Senegal 1992, 1997, 2005
2010 Sierra Leone 2008, 2013 Tajikistan 2012 Timor-Leste 2009
Togo 1998
Turkey 1993, 1998, 2003 Uzbekistan 1996
In order to capture different models of infant mortality risks accross world regions, a Proportional Hazard Model (Cox 1972) was applied to these DHS datasets . The DHS’s individual woman datasets were reshaped so as to obtain each declared birth as a weighted observation, including exposure, survival status, and age of mother at birth. We selected only children with exposure of less than one year, considering that maternal age ceases to have any relevant impact over that age (Fernandez 1985), as well as those born within ten years prior to survey in order to reduce sampling error. The child datasets were then pooled by world region. Following Collumbien and Sloggett (2001), the five-year age group effects were modeled separately with binary covariates in order to get, for each, the relative risk of dying before the age of one year.
B Precision of the microsimulations
Given the randomness of the microsimulation tool, the simulated mortality and fertil-ity patterns, reflected in the proportions dead of children, can potentially be skewed in the outputs, particularly in conditions of low fertility and mortality. While low fertility regimes tend to reduce the population size, low mortality regimes make vital events much rarer, thus increasing the sampling error. A straightforward way to evaluate the precision of the results is to compare simulated proportions dead of children to theoretical ones calculated analytically for a same stable population.
Theoretical proportions dead of children by age of motherx, P D(x), can be ex-pressed discretely, as follows (Hill 2013b; Preston, Heuveline, and Guillot 2001; Feeney 1980):
P Dx=
x
X
y=α
f(y)(1−x−yL0)
x
X
y=α
f(y)
wheref(y)is the fertility rate at agey,αis the earliest age of childbearing,xis the age at the moment of the cross-sectional data collection, and(1−x−yL0)is the probability of dying by the time of data collection of the corresponding birth cohort. That is proportions dead of children are birth weighted average of cohort probabilities of dying. Under the assumption that the population is stable, theoretical proportions dead of children can be calculated from any set of fertility and mortality rates.
rate = 2.1 and U5MR = 11 per 1000). Fifteen simulations were run in the same conditions as for the WPP rates19in order to measure the variance of the simulated proportions dead. Figure below shows the consistency of the simulation outcomes with the expected theoretical reference by single year of age. It shows that, in the lowest demographic conditions studied in this research, the simulated proportions dead of children coincide with sufficient precision with the theoretical ones. The mean deviation from the theoret-ical proportions dead does not exceed 2% by five-year group, though the variance of the simulated proportions is a bit higher for women aged 15–19 and 20–24.
It is not possible to check the periodproportions dead of children since they are intractable formally. However, being based on declarations of all women (from 15 to 49) at the same time, their variance, under the same demographic regime, should be lower.
Comparison of simulated and expected theoretical proportions dead of children for the lowest demographic regime under study (TFR = 2.1 and U5MR = 11 per 1000)
6 9 12 15
20 30 40 50
Age of Mother
Propor
tion Dead of Children (per 1000)
Expected Simulated
C Effect of non-linear mortality change on the Brass method
The plots above shows that simplifying the assumption on linear mortality change can contribute for a great part in the deviation of the Brass estimates from true parameters.
As shown in the plota, in the mid-1990s, El Salvador experienced a strong decel-eration in the mortality decline. From the simulation, the indirect estimate situated the
furthest back in time (associated with women aged 45–49) is approximately 65% higher than the benchmark, and as such is an outlier among the set of simulations. When mor-tality decline is linearized between 1985 and 2010 as displayed in plotb, the deviation for the same estimate is reduced to 20%.
Comparison with benchmark of the under-five mortality rate estimates generated by the Brass-MA in four fertility and mortality regimes derived from the case of El Salvador
WPP Mortality Linear Decline of Mortality
WPP
F
ertility
20 40 60 80 100
1990 1995 2000 2005 2010 Year
U5MR (per 1000)
Method Direct Brass-MA
a
30 60 90 120
1990 1995 2000 2005 2010 Year
U5MR (per 1000)
Method Direct Brass-MA
b
Constant
F
ertility
20 40 60 80 100
1990 1995 2000 2005 2010 Year
U5MR (per 1000)
Method Direct Brass-MA
c
25 50 75 100 125
1990 1995 2000 2005 2010 Year
U5MR (per 1000)
Method Direct Brass-MA
d
Note:The grey band delimits an upper and lower 10% deviation interval.
overestimation of mortality. Reciprocally, an accelerated decline (concave trend) pro-duces an underestimation.
In the case of El Salvador, departure from linear mortality assumption produces a greater bias than the violation of the constant fertility one. When fertility is fixed to the level of 1985 (see plotc), the deviation of the estimate situated the furthest back in time is reduced to 45% only.
D Detailed results
Numeric results for the cohort-derived methods
Mean deviation from benchmark of the under-five mortality rate estimates gener-ated by the cohort-derived methods
Brass-MA 22.5 9.4 9.8 14.6 18.3 19 27.5 11.7 13.4 18.7 21.2 20.3 9 2.5 4.7 10.2 17.8 24.1 37.6 17.7 18.5 27.6 34 35.1 17.9 6.7 4.5 5.3 5 2.6 45-49 40-44 35-39 30-34 25-29 20-24
ALL ASIA LATC NAME SSA
Region Age Group 0 10 20 30 % IHME-MAC 8.2 -3.3 2 2.9 1.6 5.4 11.8 -2.2 3.7 3.9 0.8 2.9 -4.8 -7.5 1.5 2 3.6 7.1 27.3 -1 2.7 4.5 -0.2 8.1 1.3 -2.5 0.4 1.6 1.9 4.1 45-49 40-44 35-39 30-34 25-29 20-24
ALL ASIA LATC NAME SSA
Region Age Group 0 10 20 30 % Brass-TFB 11.1 2.7 4.4 8.2 14.9 12.5 4.5 6.6 9.8 16 7 -1.1 1.9 7.7 19.2 13.4 5.9 6.9 11.2 21.1 11.4 1.7 2.7 5.2 6.3 20-24 15-19 10-14 5-9 0-4
ALL ASIA LATC NAME SSA
Region
Duration Group 0
10 20 30 % IHME-TFBC 3.3 1.4 2.3 -1.7 -3.5 -4.8 3.3 5.1 3.8 4.2 -0.6 -3.3 -5.6 0.5 2.4 -0.6 0.8 -2.1 -3.4 -2.8 11.7 12.6 4.7 3.6 -1.3 -6.5 -9.1 5.1 -4.2 -1.3 0.9 -2.7 -1.6 -2.4 -2.2 30-34 25-29 20-24 15-19 10-14 5-9 0-4
ALL ASIA LATC NAME SSA
Region
Duration Group 0
10 20 30 %
Percentage of under-five mortality rate estimates generated by the cohort-derived methods within a 10% deviation interval from benchmark
Brass-MA 15.9 58.5 56.1 42.7 32.9 32.9 0 35 40 20 15 10 63.2 100 68.4 57.9 21.1 5.3 0 11.1 22.2 11.1 16.7 27.8 4 80 84 72 68 76 45-49 40-44 35-39 30-34 25-29 20-24
ALL ASIA LATC NAME SSA
Region Age Group 0 20 40 60 80 100 % IHME-MAC 61 92.7 87.8 87.8 81.7 61 50 100 85 90 95 80 73.7 89.5 94.7 89.5 78.9 68.4 11.1 83.3 66.7 72.2 55.6 33.3 96 96 100 96 92 60 45-49 40-44 35-39 30-34 25-29 20-24
ALL ASIA LATC NAME SSA
Region Age Group 0 20 40 60 80 100 % Brass-TFB 40.2 96.3 90.2 73.2 37.8 40 95 80 70 30 63.2 100 100 68.4 10.5 27.8 88.9 83.3 61.1 27.8 32 100 96 88 72 20-24 15-19 10-14 5-9 0-4
ALL ASIA LATC NAME SSA
Region
Duration Group 0
20 40 60 80 100 % IHME-TFBC 72 96.3 95.1 95.1 81.7 69.5 58.5 70 95 90 95 90 70 50 89.5 100 100 100 78.9 63.2 47.4 55.6 88.9 88.9 94.4 61.1 55.6 50 72 100 100 92 92 84 80 30-34 25-29 20-24 15-19 10-14 5-9 0-4
ALL ASIA LATC NAME SSA
Region
Duration Group 0
20 40 60 80 100 %
Numeric results for the combined methods
Mean deviation from benchmark of the under-five mortality rate estimates gener-ated by the combined methods
Combined-MA Combined-TFB Full Combined
6.3 5.7 5.1 4.6 4 3.5 3 2.1 1.1 0.3 0.1 0.6 0.8 1.1 1.2 0.9 0.4 -0.4 -0.7 -0.4 1.2 1.9 3.4 5.4 8.3 3.4 2.6 1.9 1.4 1 0.7 0.8 0.1 -0.6 -1 -0.5 0.4 0.8 1.3 1.9 2.1 1.9 1 0.8 1.2 3.2 5.1 8.5 13.2 20 7 6.5 6 5.6 5.3 5.1 4.8 4.5 3.9 3 2.5 1.9 1.4 1.2 1.1 -0.1 -1.8 -4.1 -5.6 -6.4 -6.3 -6.6 -6.1 -4.9 -2.6 18.9 17.2 15.4 13.6 11.6 9.5 7.3 4.5 1.6 0.1 -0.2 0.9 1.3 1.3 0.5 0.1 -0.4 -0.8 -0.8 0 3.3 2.9 1.4 -2.2 -7.7 -1.1 -0.8 -0.5 -0.2 0 0.1 0.3 0.3 0.1 -0.5 -0.9 -0.5 0.1 0.7 1.1 1.3 1.4 1.4 2 2.7 3.7 5.2 8.2 12.5 18.7 12.5 10.5 8.5 6.6 4.9 3 1.5 0.8 1.1 1.5 2.1 2.7 3.1 3 3.2 3.6 3.9 4.1 4.4 3.7 4.4 6.9 11.7 19 29.5 10 7.5 5.5 3.7 2.4 1.4 1.1 1.4 2.2 2.8 3.4 4 4.2 4.2 5.3 6.3 6.8 6.9 6.8 5.7 6.3 8.8 14.3 22.7 34.8 9.1 8.9 8.2 7.3 6.2 4.2 2.9 2.5 4.1 4.9 5 5.3 5.4 4.8 5 5.4 5.3 4.7 4.2 3.7 4.6 7.5 13 21.1 32.3 14.7 13.2 11.4 9.4 7.1 4.3 1.3 -1.4 -2.3 -1.9 -0.1 1.9 3.4 3.4 2.6 1.7 1.4 2.1 3.1 2.8 4.6 8.3 14.7 24.1 37.4 15.6 12.1 9.1 6.5 4.2 2.4 1 0.6 0.4 0.3 0.3 0.3 0.2 0.3 0.7 1.5 2.2 2.9 3.4 2.8 2.8 3.8 6.6 10.9 17.2 9.1 8 6.8 5.7 4.5 3.4 2.2 1.5 1.1 0.9 1.1 1.6 2 2.1 2.1 2.2 2 1.6 1.6 1.8 2.6 4.2 7.7 13.1 21 6.9 5.3 4 2.8 1.9 1.2 0.9 0.7 0.7 0.9 1.4 2.1 2.6 3 3.5 4.1 4.2 3.6 3.5 3.6 4.4 6.6 11.3 18.6 29.1 8.1 7.7 7.2 6.6 5.8 4.9 3.4 3.5 4 4 3.8 3.6 3.4 3.1 2.8 2.5 1.6 0.1 -0.9 -1.5 -1.2 0.4 4.1 9.9 18.6 15.4 14.2 12.7 11 9 6.7 4 1.5 -0.5 -1 -0.2 1.4 2.3 2.3 1.6 1.1 0.5 0.1 0.6 1.7 3.6 5.4 8.5 12.7 18.5 7.1 5.8 4.6 3.6 2.5 1.6 0.9 0.5 0.2 -0.1 -0.3 -0.1 0.2 0.5 0.9 1.4 1.8 2.2 2.7 3 3.2 4.3 7.1 11.4 18 1986 1987 1988 1989 1990 1991 1992 1993 1994 1995 1996 1997 1998 1999 2000 2001 2002 2003 2004 2005 2006 2007 2008 2009 2010
ALL ASIA LATC NAME SSA ALL ASIA LATC NAME SSA ALL ASIA LATC NAME SSA Region Year 0 10 20 30 %