Issues
ISSN: 2146-4138
available at http: www.econjournals.com
International Journal of Economics and Financial Issues, 2016, 6(S8) 293-299.
Special Issue for “Fundamental and Applied Research in Economics and Management: New Perspectives”
Representativeness of the Value Based Activities and Reports
under the Dominating Influence of Counterparties
B. R. Gareev
1*, A. A. Zaikin
21Kazan Federal University, Institute of Management, Economic and Finance, Kazan, 420008, Russia, 2Kazan Federal University, Institute of Management, Economic and Finance, Kazan, 420008, Russia. *Email: [email protected]
ABSTRACT
In the article the problems of the value based financial activities and reports in conditions of the economic entity dependence on suppliers and customers are being researched, the algorithms of calculation relevant in the meaning of the supplier and customer interests the indexes of economic profit are being developed, the forms of financial reporting and registers, forming the price-oriented financial indexes are being represented for the reader’s attention.
Keywords: Value Based Activities, Financial Reports, Forms of Economic Influence, Economic Profit, Relevant Costs, Opportunity Costs
JEL Classifications: O150; E660; R130
1. INTRODUCTION
Significant impact on the accounting-analytical providing of financial controlling and management is made by the predominant participation of the suppliers-customers in the economic entity management (Acheson et al. 2015). Extra clarification is needed for the notion of aggregating into the general form of predominant participation of buyers and suppliers. The basis for such an approach is that the buyer and the supplier-are two integrate categories of the economic relationship. That is to say, if there is a buyer, there must be a contractual supplier. Justified is the opposite statement. This notion affords to choose for study subject whole group of companies or the added value communities and consequently to develop for them the methodology of accounting-analytical providing of financial management. Can be added, the “Supplier-Buyer” relationship pattern has a core meaning in organizing intercompany structure, based on the notion of economical calculation between the centers of responsibility. Substantiation of importance of the researched topic can be its active influence in the wide range of economic relationship and at the same time the presence in many problematic aspects of methodology of accounting-analytical providing of financial controlling: Stating the planning-controlling calculation; defining the forms, content and assignment of internal and external reporting; defining the
content of financial information and selecting the way of its collecting, generating and interpretation etc. For full study of the topic, we define three significant from the point of view of the current study cases of such economic relationship:
• Mostly visibly this form of participation can be observed in intercompany relations between managing (head) company and dependent company, making group of companies, conglomerate, and concerns. The object of management if the group of companies are dependent (affiliated) companies for which the managing company is usually at the same time the supplier of material and stuff and the buyer of the produced by the affiliated company goods;
• The trace of participation in such form can be revealed in relationship without nominal participation in the property of the dependent company-in cases of indirect participation. The example can be economical systems with strong interfirm relations, strategically partnership and the cases of market monopolization by one of the parties of the economic relationship.
• This for of participation is characteristic for any company, intercompany structure of which is built under the principle of economical calculation between the centers of responsibility. Notably the building of such structure is view by the researchers and specialists as one of the main questions of organizing the accounting-analytical providing of budgeting (Gareev, 2014).
2. ECONOMICAL DEPENDENCE OF
THE COMPANIES IMPACT ON THE
REPRESENTATIVENESS OF VALUE BASED
FINANCIAL ACTIVITIES AND REPORTS
From the point of view of the researches and specialists, the problem area of the impact of the predominant participation of suppliers and buyers upon the stating of the accounting-analytical providing is the transfer pricing. Moreover significant methodological problems of the transfer resource value calculation make the questions of effective usage of intercompany calculations debatable (Nosov et al., 2014).
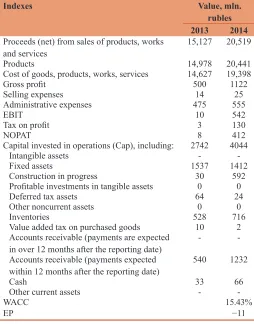
Before proceeding to the study of methodological issues of stating the accounting-analytical providing financial controlling, it will be logical to check the truthfulness of the stated beyond assumption via analyze of the result sensitivity of the dependent company against the deviation in the price of the transfer resources. For this purpose we apply the data of JSC “KAMAZ-Diesel,” where JSC “KAMAZ” is the predominant in managing the supplier-buyer material; resources. Accounting the actually set transfer prices for JSC “KAMAZ” we calculate the indexes of economic profit (EP) JSC “KAMAZ-Diesel” dated December 31, 2014 (Tables 1-4).
Suppose the purchasing transfer prices of JSC “KAMAZ-Diesel” were underscored for 10%. In this case the fair amount of EP of the dependent company will be over scored for 1638 mln. rubles. That is to say, 1638 mln. rubles of the EP are redistributed in a favor of dependent company.
There are other possible variants of JSC “KAMAZ” participation in transfer redistribution of resources:
• Lowering the purchase transfer prices with the fair level of sale transfer prices;
• Deviation of the sales transfer prices with the fair level of purchase transfer prices;
• Simultaneous deviation of the sales and purchase transfer prices from their fair values.
The results of analysis of the EP sensitivity of the dependent company upon the possible variant of influence of JSC “KAMAZ” are stated further.
The results of analysis let us make the conclusion (Tables 1-4), that taken into account the transfer pieces calculation really created the condition of the dependent company performance distortion, while the result of the group of companies in general can be accumulated in head company as well as at its affiliated
companies. Simultaneously with that it is notable that the indexes of the income and costs of JSC “KAMAZ-Diesel,” calculated on the notion of set transfer prices, are not meeting the second principle of relevancy. This fact makes reasonable the statement, that the problem of analytical providing of financial controlling is linked with irrationality in planning-controlling calculations irrelevant towards the dependent centers of index responsibility.
For the sake of empirical study of the topic let us consider the relationship between JSC “KAMAZ” and JSC “KAMAZ-Diesel.” In managing the affiliated company JSC “KAMAZ-Diesel” the head company JSC “KAMAZ” has 100% participation, what let making the affiliated company connect the main part of the resource streams with the general economic process of the group of affiliated companies. That is to say, the main part of raw material and stuff of JSC “KAMAZ-Diesel” purchases at JSC “KAMAZ” all the manufactured main products also sells to the managing company.
Finally the diagram of resources movement in economical process of the JSC “KAMAZ” - JSC “KAMAZ-Diesel” complex can be represented like the following (Figure 1).
Analyzing the diagram, we can conclude, that the summery result, which finally brings the JSC “KAMAZ-Diesel” to its predominant participant is the result of two constituents:
Table 1: Calculation of the EP index upon the accounting data of JSC “KAMAZ‑Diesel” dated December 31, 2014
Indexes Value, mln.
rubles 2013 2014
Proceeds (net) from sales of products, works
and services 15,127 20,519
Products 14,978 20,441
Cost of goods, products, works, services 14,627 19,398
Gross profit 500 1122
Selling expenses 14 25
Administrative expenses 475 555
EBIT 10 542
Tax on profit 3 130
NOPAT 8 412
Capital invested in operations (Cap), including: 2742 4044
Intangible assets -
-Fixed assets 1537 1412
Construction in progress 30 592
Profitable investments in tangible assets 0 0
Deferred tax assets 64 24
Other noncurrent assets 0 0
Inventories 528 716
Value added tax on purchased goods 10 2
Accounts receivable (payments are expected
in over 12 months after the reporting date) - -Accounts receivable (payments expected
within 12 months after the reporting date) 540 1232
Cash 33 66
Other current assets -
-WACC 15.43%
EP −11
Figure 1: The diagram of the resources movement on the economic process of the JSC “KAMAZ” - JSC “KAMAZ-Diesel” complex
Table 2: Calculation of the EP indexes upon the data of accounting reports of JSC “KAMAZ‑Diesel” dated December 31, 2007, in case of underscored purchasing transfer prices for 10%
Indexes Value, mln. rubles
2013 2014
Proceeds (net) from sales of products, works and services 15,127 20,519
Products 14.978 20,441
Cost of goods, products, works, services 16,252 21,553
Gross profit −1125 −1033
Selling expenses 14 25
Administrative expenses 475 555
EBIT −1615 −1613
Tax on profit −388 −387
NOPAT −1227 −1226
Capital invested in operations (Cap), including: 2742 4044
Intangible assets -
-Fixed assets 1537 1412
Construction in progress 30 592
Profitable investments in tangible assets -
-Deferred tax assets 64 24
Other noncurrent assets -
-Inventories 528 716
Value added tax on purchased goods 10 2
Accounts receivable (payments are expected in over 12 months after the reporting date) -
-Accounts receivable (payments expected within 12 months after the reporting date) 540 1232
Cash 33 66
Other current assets -
-WACC 15.43%
EP −1649
EBITs: Earnings before interest and taxes, NOPAT: Net operating profit after taxes, WACC: Weighted average cost of capital, EP: Economic profit
Table 3: Calculation of the EP index against the possible deviation of the actual set transfer prices versus fair
Possible deviations of transfer prices Estimated value RI, mln. rubles The final impact on the actual value
RI, mln. rubles
Transfer prices were not distorted −11 0
The purchase transfer prices are underscored for 10% −1649 1638
The purchase transfer prices are over scored for 10% 1329 −1340
The sales transfer prices are underscored for 10% 1722 −1733
The sales transfer prices are over scored for 10% −1429 1418
The purchase and sales transfer prices are underscored for 10% −89 78
The purchase and sales transfer prices are over scored for 10% 84 −95
The purchase transfer prices are over scored and sales transfer
prices are underscored by 10% 3062 −3073
The purchase transfer prices are underscored and the sales
transfer prices are over scored for 10% −3067 3056
• Own financial result of JSC “KAMAZ-Diesel,”
• Income of JSC “KAMAZ” from the sales to the dependant company material and other values-transfer income.
As total result we get the following algorithm of calculation the relevant results on the notion of managing company:
Relevant result mc = Pr di + tInc mc (1)
Where: Pr di - the financial result of the dependant company,
tInc mc - The transfer income of the managing company.
Converting the notions into the indexes of the dependant company, we get the following:
Relevant result mc= Pr di + tC di (2)
Where: tC di - the costs of the dependant company, caused by the consumption of the transfer resources.
Taking into account the equalization (2) and on the basis of assumption of participation of the intellectual capital owner (Allen and Allen, 2015), the suggested economic result calculation is reasonable to represent it the following way:
EP (MC) = Pr di+ tC di WACC × ∑Capi (3)
Where: EP (MC) - economical income, relevant on the notion of supplier-buyer participation in the economical process of the company;
Capi - i-the item of the relevant capital, calculated considering the share of the supplier-buyer participation in the company management.
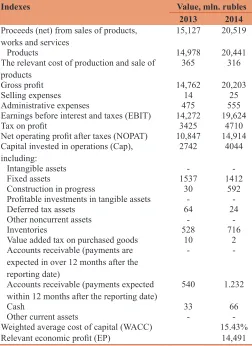
Testing the received relevant index on the data of JSC “KAMAZ-Diesel,” we get the following form for making the integrate financial report.
Analyzing the formulated index and build on its basis formula of financial report, it is needed to draw the attention on the fact, that its effective application in stating the accounting-analytical providing of the financial controlling of the dependant companies is possible in conditions of average functional dependency of the company on the participant, that is to say, when some insignificant part of the result can be caused by the economic relationship out of the group (as shown in the Figure 1). This condition is fair towards the first two mentioned before cases of predominant participation of the suppliers and buyers if the activity of the managed objects.
3. IMPACT ON THE REPRESENTATIVENESS
OF THE VALUE BASED FINANCIAL
ACTIVITIES AND REPORTS OF TIGHT
FUNCTIONAL DEPENDENCE OF THE
RESPONSIBILITY CENTERS
In conditions of tight functional dependence, which usually takes place in the activity of the production responsibility centers, the report form demands additional transformation.
To make logic of transformation clear, it seems to be right to reveal the point of the tight functional dependence. This form of dependence means, that the responsibility center is dealing strictly with particular activity, which makes the general economic process of the company (Bagautdinova et al., 2015). But for this reason produced by the responsibility center resources will be only transfer ones, means be liable to nominal selling to the company. Consequently, the income of the responsibility center shall be calculated taking the transfer prices into account, the range of which is defined by the company.
Finally the tight functional dependence makes the revenue of the production responsibility center irrelevant index.
Considering this condition, we conclude, that the accounting-analytical information from the view point of the production responsibility centers will be not the final economical result, but relevant economical expenditures. Which we suggest to calculate the following way:
ECost di = rC di - WACC × ∑Capi (4)
Table 4: Suggested calculation of the EP (MC) index upon the accounting reports data of JSC “KAMAZ‑Diesel” for December 31, 2014
Indexes Value, mln. rubles
2013 2014
Proceeds (net) from sales of products,
works and services 15,127 20,519
Products 14,978 20,441
The relevant cost of production and sale of
products 365 316
Gross profit 14,762 20,203
Selling expenses 14 25
Administrative expenses 475 555
Earnings before interest and taxes (EBIT) 14,272 19,624
Tax on profit 3425 4710
Net operating profit after taxes (NOPAT) 10,847 14,914 Capital invested in operations (Cap),
including: 2742 4044
Intangible assets -
-Fixed assets 1537 1412
Construction in progress 30 592
Profitable investments in tangible assets -
-Deferred tax assets 64 24
Other noncurrent assets -
-Inventories 528 716
Value added tax on purchased goods 10 2
Accounts receivable (payments are expected in over 12 months after the reporting date)
-
-Accounts receivable (payments expected
within 12 months after the reporting date) 540 1.232
Cash 33 66
Other current assets -
-Weighted average cost of capital (WACC) 15.43%
Relevant economic profit (EP) 14,491
Where: ECost di - Relevant economical expenditures of the responsibility centre;
rC di - Relevant obvious expenses, not considering the expenses, caused by the transfer resources consumption;
Capi - I item of the capital, occupied in the activity of the responsibility center.
Being guided by the represented calculation algorithm, the accounting-analytical providing is reasonable to do from the view point of:
• Item of the capital
• Item of the alternative expenses.
For these purposes it is efficient to suggest the following control-analytical schedule of the matrix form (Tables 5-7).
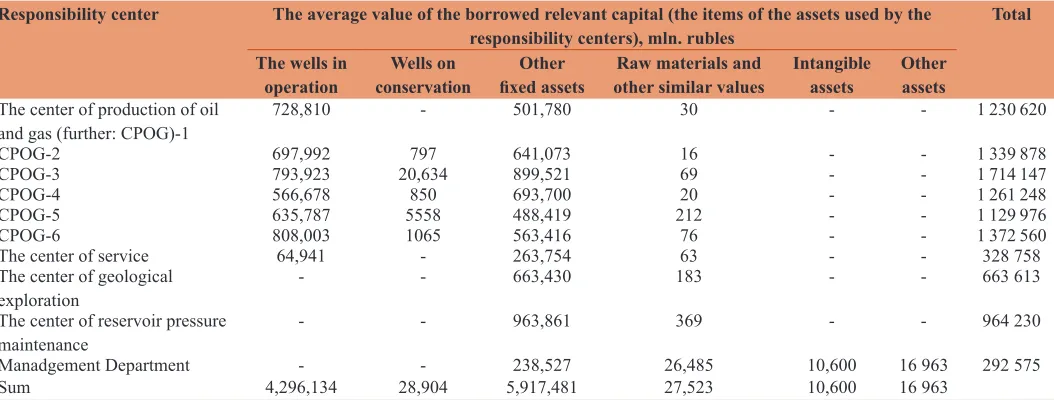
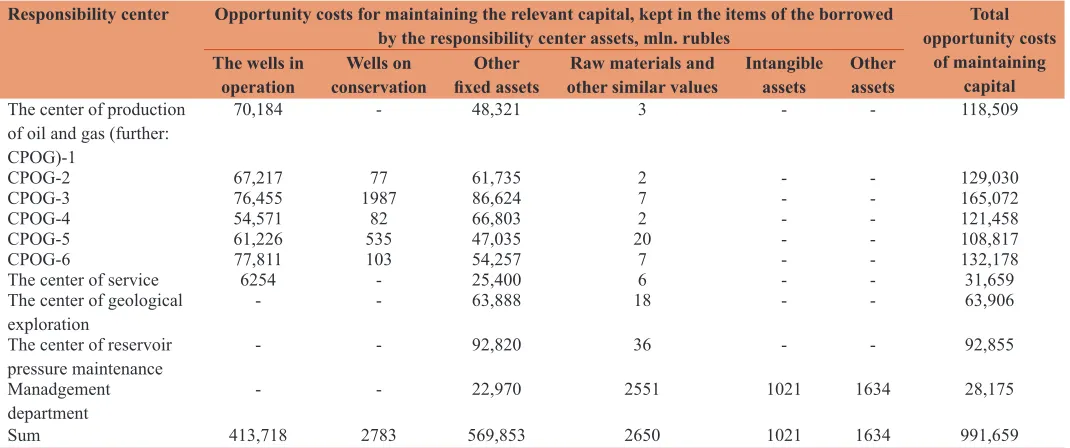
Let us show the application of the matrix schedule on the accounting-report data of the oil and gas producing company (Table 8-10).
Table 6: Matrix schedule “responsibility center‑opportunity costs”
Responsibility center Opportunity costs for maintaining the relevant capital, kept in the items of the borrowed by the responsibility
center assets
Total opportunity costs of maintaining capital
Inventory Buildings Equipment Other
Department 1 1а×WACC 1б×WACC 1в×WACC 1г×WACC ∑1×WACC
Department 2 2а×WACC 2б×WACC 2в×WACC 2г×WACC ∑2×WACC
Department 3 3а×WACC 3б×WACC 3в×WACC 3г×WACC ∑3×WACC
Sum ∑а×WACC ∑б×WACC ∑в×WACC ∑г×WACC
WACC: Weighted average cost of capital
Table 7: Matrix schedule “responsibility center‑relevant expenses”
Responsibility center The relevant expenses Total relevant expenses
Salary costs Material costs Opportunity costs Other
Department 1 ∑1×WACC
Department 2 ∑2×WACC
Department 3 ∑3×WACC
Sum
WACC: Weighted average cost of capital
Table 8: Matrix schedule “responsibility center‑relevant capital” (According to Oil and Gas Company)
Responsibility center The average value of the borrowed relevant capital (the items of the assets used by the
responsibility centers), mln. rubles Total The wells in
operation conservationWells on fixed assetsOther other similar valuesRaw materials and Intangible assets Other assets
The center of production of oil
and gas (further: CPOG)-1 728,810 - 501,780 30 - - 1 230 620
CPOG-2 697,992 797 641,073 16 - - 1 339 878
CPOG-3 793,923 20,634 899,521 69 - - 1 714 147
CPOG-4 566,678 850 693,700 20 - - 1 261 248
CPOG-5 635,787 5558 488,419 212 - - 1 129 976
CPOG-6 808,003 1065 563,416 76 - - 1 372 560
The center of service 64,941 - 263,754 63 - - 328 758
The center of geological
exploration - - 663,430 183 - - 663 613
The center of reservoir pressure
maintenance - - 963,861 369 - - 964 230
Manadgement Department - - 238,527 26,485 10,600 16 963 292 575
Sum 4,296,134 28,904 5,917,481 27,523 10,600 16 963
Table 5: Matrix schedule “responsibility center ‑ relevant capital”
Responsibility center The average value of the borrowed relevant capital (the items
of the assets used by the responsibility centers) Total value of the relevant capital Inventory Buildings Equipment Other
Department 1 1а 1б 1в 1г ∑1
Department 2 2а 2б 2в 2г ∑2
Department 3 3а 3б 3в 3г ∑3
4. CONCLUSION
To conclude we summarize the results of the research.
Firstly, the impact on the economic activity and management of the company of different interested groups can be reflected in different forms of predominant participation the correspondent groups and can be characteristic for different economic conditions. The analysis of form and conditions of relationship between the management object and predominant participant is needed for getting the representative financial documentation;
Secondly, price-oriented calculations are applicable to the activity of the whole company or group of companies as well as separate responsibility centers. If in case of the responsibility centers the indexes of expenses, results and the value of the capital can be identified and relevant, it is possible to build the planning-controlling calculations and report forms according to the model of economic income. In case of no chance to
define the relevant results for the methodology of financial controlling the distribution of relevant economical expenses per the responsibility centers from the view point of the borrowed capital is important.
Therefore getting the representative price-oriented indexes and reports requires deep analysis of the influence of the financial information users interests on the company and its subjects.
REFERENCES
Acheson, G.G., Campbell, G., Turner, J.D., Vanteeva, N. (2015), Corporate ownership and control in Victorian Britain. Economic History Review, 68(3), 911-936.
Allen, M.M.C., Allen, M.L. (2015), Companies’ access to finance, co-operative industrial relations, and economic growth: A comparative analysis of the states of South Eastern Europe. Research in International Business and Finance, 33, 167-177.
Bagautdinova, N.G., Safiullin, L.N., Ismagilova, G.N. (2015), Demand in the conditions of heterogeneity of goods and consumers. Asian
Table 9: Matrix schedule “responsibility center‑opportunity costs” (According to Oil and Gas Company)
Responsibility center Opportunity costs for maintaining the relevant capital, kept in the items of the borrowed
by the responsibility center assets, mln. rubles opportunity costs Total of maintaining
capital The wells in
operation conservationWells on fixed assetsOther other similar valuesRaw materials and Intangible assets Other assets
The center of production of oil and gas (further: CPOG)-1
70,184 - 48,321 3 - - 118,509
CPOG-2 67,217 77 61,735 2 - - 129,030
CPOG-3 76,455 1987 86,624 7 - - 165,072
CPOG-4 54,571 82 66,803 2 - - 121,458
CPOG-5 61,226 535 47,035 20 - - 108,817
CPOG-6 77,811 103 54,257 7 - - 132,178
The center of service 6254 - 25,400 6 - - 31,659
The center of geological
exploration - - 63,888 18 - - 63,906
The center of reservoir
pressure maintenance - - 92,820 36 - - 92,855
Manadgement
department - - 22,970 2551 1021 1634 28,175
Sum 413,718 2783 569,853 2650 1021 1634 991,659
Table 10: Matrix schedule “responsibility center‑relevant expenses” (According to Oil and Gas Company)
Responsibility center The relevant expenses, mln. rubles Total relevant
expenses
Labor
costs Premiums Material costs Energy costs Opportunity costs expensesOther
The center of production of oil and
gas (further: CPOG)-1 12,462 3082 7602 48,608 118,509 968,518 1,158,781
CPOG-2 13,120 3272 5430 50,477 129,030 1,071,534 1,272,863
CPOG-3 15,914 3960 5730 51,339 165,072 904,667 1,146,683
CPOG-4 13,946 3467 6404 51,761 121,458 1,029,494 1,226,530
CPOG-5 12,689 3181 8307 51,827 108,817 658,946 843,766
CPOG-6 16,669 4185 14578 67,882 132,178 1,266,116 1,501,607
The center of service 13,113 3311 3988 83,823 31,659 2314 138,208
The center of geological exploration 44,213 10,809 4899 407 63,906 11,477 135,712
The center of reservoir pressure
maintenance 41,178 10,185 25,120 160,619 92,855 3,200,321 3,530,278
Manadgement Department 38,237 9457 23,325 149,146 28,175 2,971,727 3,220,068
Social Science, 11(11), 271-276.
Gareev, B.R. (2014), Strategical financial indicators concerning the interests of the workers. Procedia - Social and Behavioral Science, 150, 142-147.
Grady, M., Schneider, D. (2001), Meta Capitalizm. The E-Business
Revolution and the Design of 21st Century Companies and Markets
in Russian Translation. Moscow: Alpina Publisher. p280.