Vol.8 (2018) No. 1
ISSN: 2088-5334
The Revolution Lean Six Sigma 4.0
G. Arcidiacono
#, A. Pieroni
##
Department of Innovation and Information Engineering, Guglielmo Marconi University, Rome, Italy E-mail: [email protected]; [email protected]
Abstract— Industry 4.0 makes a factory smart by applying advanced information systems and future-oriented technologies. Today,
thanks to the application of the most innovative digital technologies offered by the new Industry 4.0 paradigm, in this Fourth Industrial Revolution, there is a significant “evolution” of many methodologies of Continuous Improvement, such as, e.g., Lean Six Sigma (LSS). Most of the tools of Lean Six Sigma relies on data to know in depth problems: data is necessary to drive any process improvement. The key issue is based on data integrity and on real time data. The aim of this paper consists of proving the efficiency of the so called “Lean Six Sigma 4.0”. This paper deals with engineering approaches, here applied in HealthCare environment, in order to optimise the services supply process and to reduce the waste of resources (human and/or material), while improving the Quality of Experience (QoE) of the patients. Indeed, it has been proved that the huge growth in the HealthCare costs is due to inefficient use of available resources and not-optimised service processes. Applying Lean Six Sigma 4.0 it is possible to reduce HealthCare costs, improving at the same time the QoE perceived by the patient.
Keywords— Industry 4.0; IoT; information engineering; additive manufacturing; performance evaluation; DMAIC; HealthCare.
I. INTRODUCTION
The history of industrial revolutions in the last three centuries highlights a shift from power sources to automation, to information technology and automated production, all the way to connectivity.
However, all industrial revolutions revolve around three main categories: people, processes and technologies (see Fig. 1), with one of these driving the change, and initiating a circular pattern of mutual influence.
Fig. 1 Three pillars of industrial revolutions
Relying on assess such as the concept of smart factory, the Internet of Things (IoT), Additive Manufacturing, Big Data, Industry 4.0 has been defined by the World Economic Forum as the latest industrial revolution which revolves around the so called Cyber Physical Age [1], whereby the revolution happens with the integration of physical and digital world through the proliferation of sensors and devices creating an interconnected ecosystem with multiple
stakeholders. Such 4th industrial revolution has involved a paradigm shift from a client-centred product cycle to a client-centred experience cycle. This means that the client is involved in the lifecycle of the product from conception to post-purchase feedback, and that the client experience becomes pivotal for the success of companies, in any sector. In literature, the term Industry 4.0 is used to represent a deep change in many sectors: from manufacturing to HealthCare.
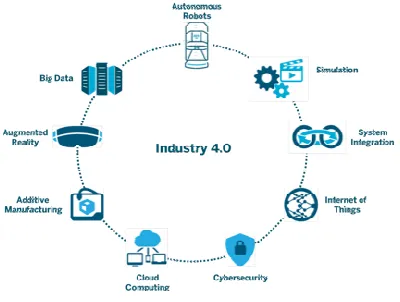
Its disruptive diffusion is due to several Enabling Technologies (see Fig. 2), such as Internet of Things (or Internet of Everything or Industrial Internet of Things), and, as said, it is a vision rather than a technological step forward. Industry 4.0 is able to create value during the entire product, process or service life cycle. For the reasons described above, the outcome of this revolution may be an object but also a service designed for a final user, whose development is driven by innovation in several areas: IT, mechanical engineering, embedded systems, production, automation technique and all of them combined in order to deliver more complex systems as we know today.
becoming “smart” and totally connected with the rest of the world through Internet technologies.
Fig. 2 Enabling Technologies
The Internet of Things applications are part of our life and many human and industry activities are based on this technology: from e-Health [4] to Cultural Heritage [5]–[8], from legal domain [9]–[11] to Public Administration [12]– [15], and Humanitarian Assistance and Disaster Relief [16]– [18], but also home automation, and wearable technology. The aims consist of changing our lives to make them easier, more efficient and "smart". The IoT devices, as said, are able to collect and share data directly with other devices through the cloud environment, providing a huge amount of information to be gathered, stored and analysed for data-analytics processes. It has been proved that HealthCare applications represent an important field of interest for IoT devices, due to the capability of improving the access to care, reducing the cost of HealthCare and most importantly increasing the quality of life of the patients [19]. All the above-mentioned complex systems, often require complex algorithm execution that could be optimised by using distributed systems [20]-[22] or other complex techniques [23]-[26]. However, in embedded systems, weight and power consumption [27], does not allow such solutions and consequently, different approaches based on the using of an embedded microprocessor and hardware accelerators will be used [28], [29]. The potential to integrate Lean Manufacturing to Industry 4.0 has been debated [30], and, more specifically, Lean Six Sigma (LSS) has been investigated in its applications to accelerate the process of extracting key insights from Big Data, and how Big Data processing can help to innovate and cast a new light on the projects requiring the use of Lean Six Sigma [31], [32]. As it is known, indeed, Lean Six Sigma has been successfully applied to many areas, such as government, industry, services, and, ultimately, to HealthCare.
In literature, many items exist that demonstrate the effect of the Lean Six Sigma applied to the HealthCare system. In [33] the purpose consists of demonstrating the power of LSS methodology in a hospital environment to reduce patient waiting time in out-patient department.
Furthermore, has been demonstrated that the design and the assessment of HealthCare systems require many trade-offs and has a major impact on the patient experience and the quality and efficiency of care [34].
An interesting systematic literature review has been proposed by [35] in order to independently assess the effect of Lean or Lean interventions on worker and patient satisfaction, health and process outcomes, and financial costs.
In [36] it has been explored the processes by which new Quality Improving (QI) methodologies are been developed and disseminated and the impact this has on the effectiveness of QI programmes in HealthCare organizations.
While in [37] the authors have considered a particular case-study describing the success of the Six Sigma methodology in a hospital for a specific project. In particular, have proved the importance of verifying ideas before developing improvement actions, as a non-negligible aspect in the LSS methodology.
With the onset of Industry 4.0 and its technologies, health care research has taken advantage of patient data digitization, in order to develop medicines and devices more and more tailored to patient needs, which could be, therefore, more efficient in treating conditions.
For example, using Additive Manufacturing techniques [38] it is possible design and create personalized products, such as also large prosthetic devices due to its assembly-free and time efficient.
As a consequence, this paper aims at tracking down the recent development of Lean Six Sigma as applied to the challenges of the HealthCare system [39], while answering the needs of Industry 4.0.
Basically, this paper aims at isolating the methodological features and applications of an ever-evolving Lean Six Sigma, and to evaluate the foundations and potential future applications of what we define as Lean Six Sigma 4.0.
II. MATERIAL AND METHOD
A. Lean Six Sigma 4.0
The integration of Six Sigma [40], methodology focused on process variability reduction and standardization, with Lean Thinking [41], approach which aims to reduce wastes, has created Lean Six Sigma [32]. These two disciplines have proven to be especially successful when working together [31], and the great success in a variety of industries has led to the fact that its application is not limited to the manufacturing area but is extended to service and public administration industry [42].
Given the growing demand for patient-oriented and efficient health services, Lean and Six Sigma methods are now increasingly used also in hospitals [39], [43], [44], [45], where are used also mathematical advanced models already applied by the authors for different industrial application [45].
Other individual researches [31] have been done in exploring how Lean Six Sigma could be applied to accelerate the process of extracting key insights from Big Data and also how Big Data could bring new light to projects requiring the use of Lean Six Sigma, but the potential to execute LSS was not completely developed.
Without any kind of doubt, today integrating both LSS and Industry 4.0 is an important research field to be extensively explored.
This paper aims to provide an original and innovative set of guidelines in order to support practitioners and researchers in the design of effective and efficient cyclical process optimization through this new revolutionary approach we named Lean Six Sigma 4.0.
Every industrial revolution has defined by a new technology causing a substantial change in the way people and processes operate. As part of this more recent “revolution”, the ubiquity of sensors allows for data to be collected at all levels of the value chain leading to a more sophisticated analytical approach to forecasting/ planning (from descriptive statistics to predictive analytics).
Every LSS project follows a practical roadmap called DMAIC [40], which is the classical cyclical process of five stages (“filters”) known as Define, Measure, Analyze, Improve and Control. These logical filters used to identify and solve any kind of problems are reinforced through the tools offered by Industry 4.0.
Industry 4.0 significantly influences the production environment of products/ services with radical changes in the execution of operations. In contrast to conventional forecast-based production planning, Industry 4.0 enables real-time planning of production plans, along with dynamic self-optimisation [30].
Using LSS 4.0 on one hand the smart factory has embedded with latest technologies and intelligent algorithms, on the other one it breaths the classical LSS mind-set.
The goal is the synchronisation of intelligent and self-optimising machines in the production line with the entire end-to-end (E2E) process, from suppliers to delivery of goods to customers [47].
The production processes could be positively influenced thanks to the simulation of inventory, logistics and transport [48].
The power of advanced analytics improves the performance of Lean Six Sigma projects: in particular the time of the data collection and the relative analysis of the phenomenon is faster. So, it allows to accelerate the so called “filters” to know in depth the process in order to highlight the root-causes which influence variations from the standard (key concept of LSS) and have to be removed to optimize the process.
In Define phase through proper data visualization tools, problems/defects in processes can be identified early on. The importance of IoT is that data can be transmitted to a smartphone or a tablet to monitor promptly deviations in the processes or products.
In Measure phase the data collection and the analysis of the data are the key points. They must represent the actual situation in the field but often a lot of information is lost and a question on data integrity arises.
Industry 4.0 helps in accelerating the data collection and in removing human error in collecting data. One of the key point of LSS 4.0 is the role of IoT in helping operations to be improved through processes driven by Lean Six Sigma tools through the definition of data collection system based on Predictive Analytics.
Most organizations today use Descriptive Analytics (alerts in Control Chart, Bar Chart, Means, Quartiles). These are useful but not nearly as useful as Predictive Analytics, which allows to know if a machine is about to breakdown or if the good health of a person will persist. Therefore, in order to adopt promptly the necessary countermeasures is important to predict the future and to know in advance the possible cause-effect relationships.
In Analyze phase the goal is the identification and the prioritization of the root causes of the problem (before) and the relative removal (after). A typical approach to the resolution of non-conformities is a strategy called “Root-Cause Analysis” [49].
Moreover, LSS offers some “quantitative” tools (Hypothesis Tests, Correlation Matrix, Regression Models) and some “qualitative” tools (5Whys, Fishbone) are able to describe in depth the process.
In this context, the use of a IoT device can speed up the process of verifying root causes.
In Improve phase it is essential that the action plan taken is based on the removal of real root causes and it is monitored and sustained. Having easy to deploy plug and play IoT modules with relevant sensors can make it easier to monitor the CTQs through a personal computer, smartphone or tablet.
In Control phase the CTQs are monitored due to the presence of IoT sensors that should be reliable also in extreme conditions, the data should be confidential and secure, and the IoT system should be able to integrate with any operating platform or database: the interoperability is a key factor in accelerating the adoption of IoT systems. Summarizing, Lean Six Sigma and Industry 4.0 are mutually reinforcing as:
1) Industry 4.0 helps collect more data in real-time throughout the entire value chain with the support of Lean Six Sigma tools.
2) Lean Six Sigma empowers the operators/ owners of the processes.
3) The IoT has allowed that different processes could feed in real-time a cognitive algorithm.
4) Lean Six Sigma analytical tools allow to better extract key insights from Big Data.
5) Lean Six Sigma 4.0 optimizes processes quickly thanks to a rapid DMAIC-roadmap and fast information systems.
III.RESULTS AND DISCUSSION
A. Case Study – LSS 4.0 in HealthCare
The huge growth of the costs and, on the other hand, the low efficiency in the governance, has made the HealthCare a sector where are needed new, cost-effective and more efficient management policies to face the patients and management dissatisfaction. In this scenario, optimisation policies are needed to daily support doctors and health workers to obtain constant improvement by combining the well-known medical procedures with the efficient providing of HealthCare services.
perceived quality of experience or in terms of economic aspects.
In this section, a real case study, that deals with HealthCare systems, will be illustrated. The objective of this study consists of evaluating the patient admission to the hospital process in order to highlight the points of improvements suggesting, at the same time, the actions needed to the achieving of the above-mentioned enhancements.
As said above, indeed, the aim of this paper consists of proving the efficiency of the so called “Lean Six Sigma 4.0” applied to the HealthCare context in order to optimise the services supply process and to reduce the waste of resources (human and/or material), while improving the Quality of Experience (QoE) of the patients.
Next sections will better define the characteristics of the considered HealthCare system.
B. Department of Emergency and Acceptance: First Aid and First Acceptance Services
The services performed in the Department of Emergency and Acceptance (DEA) are the following:
• Acceptance for elective and programmed cases;
• Acceptance for patients that come spontaneously and do not have urgency;
• Acceptance of patients in conditions of urgency;
• Acceptance of patients in condition of not-urgency;
• Acceptance of subjects in emergency conditions.
During the First Aid and First Acceptance services, diagnostic tests for the solution of the clinical problem are performed. In more complex cases, the patient is stabilized before is transferred to another hospital able to provide specialized treatments.
The DEA represents a functional aggregation of operational units that maintain their autonomy and clinical-care responsibilities but recognize interdependency by adopting a common behaviour in order to ensure reliable and complete response for the patient emergency. As shown in the next sections, DEA have two levels of complexity: DEA Level I and DEA Level II.
C. DEA Level I
The first level of DEA provides observation and short-term convalescence, in the so-called Emergency Room, and at the same time provides diagnostic and therapeutic operations for general medicine, general surgery, orthopaedics and traumatology, cardiology with UICT (Unit of Intensive Cardiology Therapy). They also perform chemical and microbiological analysis, imaging diagnostics and transfusion.
D. DEA Level II
In additional to the services provided by the DEA Level I, this level includes assistance for highest emergencies, including cardiac surgery, neurosurgery, neonatal intensive care, and vascular surgery.
E. DEA Triage
For not-programmed emergencies, a hospitalization is provided during all day through the Emergency Room point
of access. A skilled and trained nurse welcomes patient at the DEA Triage (DEA-T). The nurse evaluates the symptoms of the patient in order to identify potentially life-threatening conditions and, consequently assigns to the patient a priority to accessing the emergency room.
The criticality of the patient's health condition is classified according to four colours:
• Red Colour (Emergency issue)
• Yellow Colour (Urgency issue)
• Green Colour (not-Urgency issue)
• White Colour (the patient does not need Emergency Room services)
Once evaluated according to DEA-T procedures, the patients can be discharged from the DEA according to above-mentioned modalities.
In case the patient has to be hospitalized, it is important to note that this procedure requires great attention not only from a medical point of view but also from a managerial point of view. In fact, the hospitalization procedure is governed by a special Regional Law (Decree of the Commissioner ad Acta DCA 368 of 31/12/2014), which arranges the number of available beds according to the number of the citizens that live in the area in which the hospital rises.
The above-mentioned law refers to the figure of the so-called bed manager, which is responsible for all hospitalizing and discharging activities. Furthermore, the bed manager is responsible for coordinating and improving effectiveness and efficiency of all DEA activities. Lack of available beds often causes considerable problems to patients that need assistance, for example in terms of DEA overcrowding. When a patient need an admission in the hospital, the procedure performed by the DEA staff is the following: the nurse contacts the destination division and makes a request for availability, and only after a complex procedure will be provided the current availability of beds in the requested division.
This complex procedure will be detailed in the following sections. Obviously, the time that the patient spends inside the DEA department depends on the duration of the above-mentioned procedure, and it is clear that the DEA overcrowding phenomena can be considered as a consequence of a not-optimized management of this complex procedure.
For all these reasons, it has been considered as a critical process the process for which the patient leaves the DEA to be hospitalized in a specific ward. The performance indicator of this process has been identified as Mean Hospitalisation Time (MHT). Once identified the most critical process of the described case study, the Lean Six Sigma 4.0 methodology has been adopted in order to optimize the performance of the above-mentioned process.
The modality in which the methodology has been used is detailed in the following sections.
F. Results Analysis
acceptance to the time in which the patient leaves the DEA to be hospitalised in the ward.
During the DEA-T activity, a qualified employee inserts the patient personal data into the national Health Emergency Information System (HEIS) and, after leaving, the same employee updates the Hospital Information System (HIS). Therefore, to observe this time value is necessary to perform two data extractions from the two different Information Systems. This procedure is shown in Fig. 3. In particular, the matching procedure is described in which the patient personal data, entered during the DEA-T activity, are compared with the patient personal data entered during the ward hospitalizing in order to identify the patient. The next sections will briefly describe the DMAIC procedure applied to the above-mentioned HealthCare system.
Define - The definition of the process must provide the characteristics of the indicator used to represent and measure the performance of the considered process. As said above, the DEA overcrowding phenomena imply a non-negligible added waiting time for the patient. For this reason, the MHT is considered the most important and critical to quality (CTQ) indicator to be considered in this case study and, to be optimised in order to improve the quality of experience of the patient itself.
Fig. 3 Information System data extraction for a single patient
In Tab. I the number of cases for each event of patient leaving DEA, in a time period of three years, is given.
TABLEI
NUMBER OF CASES FOR EACH EVENT OF PATIENT DISCHARGE
It is clear that the MHT is given by the sum of different waiting times, experimented by the patient during his staying in the DEA, and the goal consists of minimizing this indicator.
Figure 4 shows a description of the patient Evaluation Process at DEA, during his staying period. In Tab. I it is possible to observe that the 11570 hospitalisation cases during the year 2015, represent the 18.8% of the total amount of accesses at DEA (61576). This data justifies the choice of the process to be optimized because it represents the largest percentage of leaving from DEA. In Fig. 5 the process mapping from the acceptance in DEA to acceptance in the ward is represented.
Measure - According to the observation made, the bed assignment for a patient leaving DEA takes 12-15 hours and, only in case of emergency, within a time that is never less than an hour.
Patient Arrive
TRIAGE
Nurse
Assessment
Medical Clinical Evaluation/Test Labs
Outcome
Cardiologist Surgeon
Obstetric-Gynaecologist
Orthopedist
Neurologist
Fig. 4 Description of the patient Evaluation Process at DEA
The performed measure considers three main processes:
• Waiting for visit: time elapsed between patient registration at DEA and the call for first visit.
• Waiting for evaluation: time needed for patient health evaluation.
• Waiting for ward admission: time elapsed from the outcome of the evaluation and the actual registration of the patient to the ward.
Once the processes and the information systems have been defined, the data of interest have been collected, aggregating them according to the observed subject.
Only the patients that needed to be hospitalised were selected, carrying out a data flow analysis. Due this activity it was possible to define the complete path of the patient from DEA to the ward.
Figure 6 shows the Activity Diagram for patients that need to be hospitalised in the ward. The times are related to the worst case of yellow Triage code during 2015. It has been observed that the high time-variability was due to several factors, such as:
• Lack of available beds;
• Lack of specialist consultant;
• Lack of sufficient patient data to perform instrumental examinations;
DEA Events numbers
2013 2014 2015
deaths in DEA 80 96 94
patients leaving the hospital 4828 6117 4797
patients rejecting the hospitalisation 5604 6159 6033
patients transferred in other hospitals 786 949 1146
patients arrived dead in DEA 4 5 4
patients don’t answer 4885 7004 5198
patients invited to home care 37805 30409 32734
patients hospitalised 12493 11587 11570
• Disorientation of the patient upon arrival in the Emergency Room.
The observed average waiting time in DEA was 742 min and includes the time the patient experiences to be taken to the ward (MHT). The MHT in 2015, averaged over all the codes of the triage, was equal to 348 min. It represents the time (in minutes) that the patient experienced from the definition of the diagnosis to his leaving from the DEA, resulting in admission to the destination ward (see Tab. II).
Fig. 5 Process mapping from the acceptance in DEA to acceptance in ward
It was observed that in only 15% of patients requiring hospitalization, MHT was lower than 10 min.
The objective of this work consists of attacking the causes that contribute to increase the high variability of the CTQ.
The proposed methodology LSS 4.0, indeed, supported the collection of data in real time manner, so assisting the performing activity of this phase, and monitoring promptly the high deviations in the observed process by means of technology-based instruments, such as data visualization tools and IoT devices.
Analyze - In most observed cases, laboratory tests are needed to verify patient's condition. The response time of laboratory tests depends on several factors, such as: laboratory delivery time; type of exam required; availability of laboratory specialists; reporting time. In this phase of DMAIC methodology, the involved processes have been evaluated (by means of analysis of root-causes and value stream analysis) in order to identify the main causes for delay or anomalous waiting times. In particular, the expected performance value of the observed process has been set by analysing 11575 admissions records referring to the year 2015.
Fig. 6 Activity Diagram ward hospitalisation (the worst case of yellow Triage code during 2015)
TABLE II
MEAN TIME FROM DIAGNOSIS TO THE HOSPITALISATION IN WARD
Triage Hold time to
recovery
Average Examination
Time MHT
1. Red 581 482 252
2. Yellow 1011 655 463
3. Green 326 147 201
Avg 742 492 348
The observed process has a MHT to be reduced but also a high variability (standard deviation = 1,049 min). For this reason, a Cause-Effect Diagram was performed, as shown in Fig. 7. In this phase, all potential critical branches, in terms of Method, Information System, Staff, Patients have been individuated and analysed.
Fig. 7 Cause-Effect Diagram
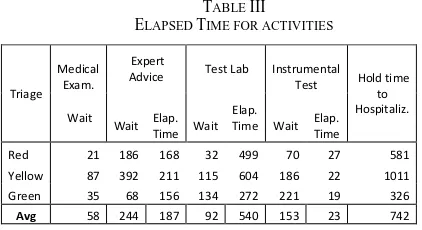
As seen, the activities are classified in consultancies, laboratory tests, instrumental examinations, and first aid services. From these data-set the relative times have been calculated (see Table III).
In order to define the correct value for the MHT indicator, it has been recalculated considering the difference between the closing time of the folder and the maximum waiting time between laboratory blood tests, consultancy and instrumental examinations.
TABLE III ELAPSED TIME FOR ACTIVITIES
This condition became critical during peak hours. Only the 14.8% of the patients are within the fixed target of 10 min, due to the characteristics of the patient's pathology. The weights of the examinations are shown in Tab. IV. It is clear that both consultancies and laboratory tests had a considerable impact on the times of the entire hospitalization process.
TABLE IV
WEIGHTS OF EXAMINATIONS (YEAR 2015–11575 PATIENTS)
In particular, critical issues concerned activities of collecting data and interacting with information systems belonging to the complex structure as the DEA.
In details, the procedure to request and evaluate laboratory tests needed an ad-hoc data processing operation to interface data with the data produced by the DEA system. The same problem existed for the management of instrumental examinations, that was not perfectly integrated with hospital information systems.
By means of the Value Stream Map, another critical issue emerged, that specifically concerned the hospitalization process. With MHT=348 min, we may assume that most of the improvement activities have to be performed within this process.
Improve - In order to improve the patient's hospitalising process, corrective actions have been proposed to significantly decrease delays and to modify some consolidated procedures that, however, do not brought any added value to existing processes.
The proposed improvements include, for example, the registration in real time of the specialist consulting activities in the hospital information system. In this way, the operator of the Emergency Room will have available in real time the advice of the specialist and he will be able in real time to address next phases of the assessment.
Another improvement regarded the data-entry process on available beds. An optimized process could allow the knowledge in real time about the actual availability of beds in the ward. Furthermore, this optimization activity not only may allow to verify the actual beds availability within the specific ward but also within the hospital itself and among the hospitals belonging to the same structure.
In this phase, the proposed LSS 4.0 methodology involves IoT modules, with relevant sensors, that made it easier to monitor in real time, for example, of the beds availability. This network of interconnected sensors and devices is efficient and effective, due to the support of an Information System Architecture as illustrated in Fig. 8.
Control - The Control phase plays an important role in the sustainability of the process improvement. Usually, the monitoring of the performance allows the evaluate the progress obtained thanks to the implemented improvements ("Before vs. After"), highlighting, at the same time, the stability of the new process.
The proposed LSS 4.0 methodology provided more effective performance measurement, thanks to Enabling Technologies of Industry 4.0, that help the continuous improvement process by collecting more data in real-time.
In the observed HealthCare system, the use of wearable devices, the technological achievements in the area of IoT, the diffusion of environmental sensors, the physiological parameters monitoring devices, and the home automation devices, represent the value added that allow the innovation of the proposed LSS 4.0 methodology. In Fig. 8 a typical 3-Layer eHealth architecture, is shown, where a set of heterogeneous devices belonging to the device-layer are connected to the eHealth cloud and security services provided by the network layer. The data provided by the devices are collected, stored and analysed by Business Intelligence technologies and by Data Analytics Methodologies in order to obtain automated countermeasures as an immediate reaction to alarms/alerts.
Device Layer Network Layer Application Layer
MQTT Protocol
MQTT Protocol
eHealth Cloud and Security Services
HealthCare ControlPanel
Repository
Internet Protocol
Internet Protocol
BI and Data Analytics
Fig. 8 Typical 3-Layer eHealth Architecture [19]
IV.CONCLUSIONS
The term 4.0 is used to specify the current industrial revolution, not-only from the technological point of view but also from the economical, sociological and strategical point of view. Thanks to a set of enabling technologies, offered by the new Industry 4.0 paradigm today, in this Fourth Industrial Revolution, there is a significant “evolution” of many methodologies of Continuous Improvement, such as Lean Six Sigma.
Customer involvement becomes even more relevant given the continuous feed-back facilitated by the IoT (social networks, etc.). Clients inputs are collected and have a profound impact in the real-time adjustment of production, tailoring of product design and provide post-sale feed-back. This is shown by the current shift of traditional manufacturers into service providers. Big data allows to overcome limitations of traditional customer analysis tools (such as Quality Function Deployment) providing
Triage Medical
Exam.
Expert
Advice Test Lab Instrumental
Test Hold time
to Hospitaliz. Wait
Wait Elap.
Time Wait
Elap.
Time Wait
Elap. Time
Red 21 186 168 32 499 70 27 581
Yellow 87 392 211 115 604 186 22 1011
Green 35 68 156 134 272 221 19 326
information on the entire “customer experience” and key visibility on VOCs (Voice of Customer). Therefore, the introduction of smart technologies allows clients, suppliers and employees to become real-time contributors to the data gathering exercise reducing the need for continuous controls. This paper has proposed a new methodology, called Lean Six Sigma 4.0, and has proved its efficiency applied to the HealthCare context. In particular, has been proved how this novel methodology is able to optimise the services supply process, reducing at the same time the waste of resources (human and/or material), while improving the Quality of Experience (QoE) of the patients.
In order to prove the efficiency of the proposed novel methodology (LSS 4.0) a real case study has been illustrated, and it has been shown how, applying the above-mentioned methodology it was be possible to improve the QoE (CTQ=MHT) of the system end-users (patients) while optimising the overall aspects of the HealthCare Governance.
ACKNOWLEDGMENT
The authors would like to thank Corrado Fiore for the substantial effort dedicated to this project and the accuracy of the data-collecting and data-analyzing activities, carried out interacting with the Hospital Informative Systems.
REFERENCES
[1] Schwab K., Davis N. (2018) “Shaping the Fourth Industrial Revolution”, Book ISBN–978-1-944835-14-9.
[2] Pieroni A., Scarpato N., Brilli M. (2018). Performance Study in Autonomous and Connected Vehicles, an Industry 4.0 Issue. Journal of Theoretical and Applied Information Technology January 2018 Vol. 96 No.2 E-ISSN 1817-3195 / ISSN1992-8645.
[3] Pieroni A., Scarpato N., Brilli M. (2018). Industry 4.0 Revolution in Autonomous and Connected Vehicle A non-conventional approach to manage Big Data. Journal of Theoretical and Applied Information Technology January 2018 Vol. 96 No.1 E-ISSN 1817-3195 / ISSN1992-8645.
[4] F. Guadagni et al., (2017). RISK: A Random Optimization Interactive System Based on Kernel Learning for Predicting Breast Cancer Disease Progression. In Bioinformatics and Biomedical Engineering: 5th International Work-Conference, IWBBIO 2017, Granada, Spain, April 26--28, 2017, Proceedings. Part I, I. Rojas and F. Ortuño, Eds. Cham: Springer International Publishing, 2017, pp.189–196.
[5] A. R. D. Accardi and S. Chiarenza. (2016). Musei digitali dell’architettura immaginata: un approccio integrato per la definizione di percorsi di conoscenza del patrimonio culturale Digital museums of the imagined architecture: an integrated approach. DISEGNARECON, vol. 9.
[6] M. Pennacchiotti and F. M. Zanzotto. (2008). Natural Language Processing Across Time: An Empirical Investigation on Italian,” Springer, Berlin, Heidelberg, pp. 371–382.
[7] R. Beccaceci, F. Fallucchi, C. F. Giannone, F. Spagnoulo, and F. M. Zanzotto. (2009). Education with ‘living artworks’ in museums,” in CSEDU 2009 – Proceedings of the 1st International Conference on Computer Supported Education, 2009, vol.1.
[8] Arcidiacono, G., De Luca, E.W., Fallucchi, F., Pieroni, A. (2016). “The use of lean six sigma methodology in digital curation”, CEUR Workshop Proceedings.
[9] M. T. Pazienza, N. Scarpato, and A. Stellato. (2009). STIA*: Experience of semantic annotation in Jurisprudence domain. In Frontiers in Artificial Intelligence and Applications, 2009, vol. 205, pp. 156–161.
[10] M. Bianchi, M. Draoli, G. Gambosi, M. T. Pazienza, N. Scarpato, and A. Stellato. (2009). ICT tools for the discovery of semantic relations in legal documents. In CEUR Workshop Proceedings, 2009, vol. 582.
[11] G. Boella, L. Di Caro, L. Humphreys, L. Robaldo, P. Rossi, and L. van der Torre. (2016). “Eunomos, a legal document and knowledge
management system for the Web to provide relevant, reliable and up-todate information on the law. Artif. Intell. Law, vol. 24, no. 3, pp. 245–283, Sep.2016.
[12] V. Morabito (2015). Big Data and Analytics for Government Innovation. Big Data Anal. Strateg. Organ. Impacts, pp. 23–45, 2015. [13] Zanella Andrea, et al. (2014). Internet of things for smart cities. IEEE
Internet Things J. 1.1, p. 22–32.
[14] F. Fallucchi, E. Alfonsi, A. Ligi, and M. Tarquini. (2014). Ontology-driven public administration web hosting monitoring system, vol. 8842.
[15] M. Bianchi, M. Draoli, F. Fallucchi, and A. Ligi. (2014). Service level agreement constraints into processes for document classification. In ICEIS 2014 - Proceedings of the 16th International Conference on Enterprise Information Systems, 2014, vol. 1 [16] D. Zhang, L. Zhou, and J. F. Nunamaker Jr. (2002) A Knowledge
Management Framework for the Support of Decision Making in Humanitarian Assistance/Disaster Relief. Knowl. Inf. Syst., vol. 4, no. 3, pp. 370–385, Jul. 2002.
[17] F. Fallucchi, M. Tarquini, and E. W. De Luca. (2016). Knowledge management for the support of logistics during Humanitarian Assistance and Disaster Relief (HADR), vol. 265.
[18] A. D’Ambrogio et al. (2017). Use of integrated technologies for fire monitoring and first alert,” in Application of Information and Communication Technologies, AICT 2016 -Conference Proceedings, 2017, pp. 1–5.
[19] Scarpato N., Pieroni A., Di Nunzio L., Fallucchi F, 2017, “E-health-IoT Universe: A Review”, International Journal on Advanced Science, Engineering and Information Technology, Vol. 7 (2017) No. 6, pages: 2328-2336, DOI:10.18517/ijaseit.7.6.4467.
[20] Iazeolla, G., Pieroni, A., D'Ambrogio, A., Gianni, D. (2010). A distributed approach to wireless system simulation. 6th Advanced International Conference on Telecommunications, AICT 2010, art. no. 5489830, pp. 252-262.
[21] D'Ambrogio, A., Gianni, D., Iazeolla, G., Pieroni, A. Distributed simulation of complex systems by use of an HLA-transparent simulation language. (2008). Asia Simulation Conference - 7th International Conference on System Simulation and Scientific Computing, ICSC 2008, art. no. 4675405, pp. 460-467.
[22] Iazeolla, G., Pieroni, A., D'Ambrogio, A., Gianni, D. (2010). A distributed approach to the simulation of inherently distributed systems. Spring Simulation Multiconference 2010, SpringSim'10, art. no. 132.
[23] Bocciarelli, P., Pieroni, A., Gianni, D., D'Ambrogio, A. (2012). A model-driven method for building distributed simulation systems from business process models (2012) Proceedings - Winter Simulation Conference, art. no. 6465106.
[24] D'Ambrogio, A., Gianni, D., Risco-Martín, J.L., Pieroni, A. (2010). A MDA-based approach for the development of DEVS/SOA simulations. Spring Simulation Multiconference 2010, SpringSim'10, art. no. 142.
[25] Gianni, D., D'Ambrogio, A., Iazeolla, G., Pieroni, A. (2008) Producing simulation sequences by use of a java-based generalized framework. Proceedings - EMS 2008, European Modelling Symposium, 2nd UKSim European Symposium on Computer Modelling and Simulation, art. no. 4625266, pp. 171-176.
[26] D'Ambrogio, A., Iazeolla, G., Pieroni, A., Gianni, D. (2011). A model transformation approach for the development of HLA-based distributed simulation systems. SIMULTECH 2011 - Proceedings of 1st International Conference on Simulation and Modeling Methodologies, Technologies and Applications, pp. 155-160. [27] Iazeolla, G., Pieroni, A. (2014). Energy saving in data processing and
communication systems. Scientific World Journal, art. no. 452863. [28] Cardarilli, G.C., Di Nunzio, L., Fazzolari, R., Pontarelli, S., Re, M.,
Salsano, A. (2011), “Implementation of the AES algorithm using a Reconfigurable Functional Unit”, ISSCS 2011 - International Symposium on Signals, Circuits and Systems, Proceedings, art. no. 5978668, pp. 97-100.
[29] Cardarilli, G.C., Di Nunzio, L., Fazzolari, R., Re, M., Lee, R.B. Integration of butterfly and inverse butterfly nets in embedded processors: Effects on power saving (2012) Conference Record - Asilomar Conference on Signals, Systems and Computers, art. no. 6489268, pp. 1457-1459.
[31] Fogarty D, (2015). “Lean Six Sigma and Big Data: continuing to innovative and optimize business process”, Journal of Management and Innovation, Fall 2015 1(2).
[32] Arcidiacono G, Costantino N, Yang, K, 2016, "The AMSE Lean Six Sigma Governance Model", International Journal of Lean Six Sigma, Vol. 7, Issue 3; pp. 233-266, doi: 10.1108/ IJLSS-06-2015-0026 [33] Gijo, E.V., Antony, J., Reducing patient waiting time in outpatient
department using lean six sigma methodology (2014) Quality and Reliability Engineering International, 30 (8), pp. 1481-1491. [34] Hicks, C., McGovern, T., Prior, G., Smith, I., Applying lean
principles to the design of healthcare facilities (2015) International Journal of Production Economics, 170, pp. 677-686.
[35] Moraros, J., Lemstra, M., Nwankwo, C., Lean interventions in healthcare: Do they actually work? A systematic literature review (2016) International Journal for Quality in Health Care, 28 (2), pp. 150-165.
[36] Walshe, K. Pseudoinnovation: The development and spread of healthcare quality improvement methodologies (2009) International Journal for Quality in Health Care, 21 (3), pp. 153-159.
[37] Van Der Meulen, F., Vermaat, T., Willems, P., Case study: An application of logistic regression in a six sigma project in health care (2011) Quality Engineering, 23 (2), pp. 113-124.
[38] W. Gao et al. (2015). ““The status, challenges, and future of additive manufacturing in engineering”. Computer-Aided Design 69, pag. 65–89.
[39] Arcidiacono G, Wang J, Yang, K, 2015, "Operating room adjusted utilization study", International Journal of Lean Six Sigma, Vol. 6, Issue 2; pp.111 – 137, doi: 10.1108/ IJLSS-02-2014-0005
[40] Arcidiacono G, Calabrese C, Yang K, 2012, “Leading processes to lead companies: Lean Six Sigma”, Springer, ISBN 978-88-470-2492-2
[41] Womack J, Jones D. (2003). “Lean Thinking”. New York, NY: Simon & Schuster.
[42] Arcidiacono G, Matt DT, Rauch E, 2017, “Axiomatic Design of a Framework for the Comprehensive Optimization of Patient Flows in Hospitals”, Journal of HealthCare Engineering, Vol. 2017, Article ID 2309265, 9 pp. doi: 10.1155/2017/2309265
[43] Walshe, K. Pseudoinnovation: the development and spread of healthcare quality improvement methodologies. Int J Qual Health Care 2009; 21: 153-159.
[44] Brandao de Souza, L., (2009). “Trends and approaches in Lean healthcare”. Leadership in Health Services 2009; 22: 121–139. [45] Arcidiacono G, Berni R, Cantone L, Placidoli P, 2017, “Kriging
models for payload-distribution optimization of freight trains”, International Journal of Production Research, Vol. 55, No. 17, 4878-4890, doi: 10.1080/00207543.2016.1268275
[46] Ohno T, (1988). “Toyota Production System: beyond large-scale production”, Cambridge, Mass: Productivity Press.
[47] Spath D, Ganschar O, Gerlach S, Hämmerle M, Krause M, Schlund S., (2013). “Produktionsarbeit der Zukunft”. Stuggart: Fraunhofer Verlag.
[48] Wan J, Cai H, Zhou K, (2015). “Industrie 4.0 Enabling technologies”, International Conferences on Intelligent Computing and Internet of Things (ICIT), IEEE 2015, Harbin, China, 135-140.