Public Expenditure in Research and Development and Venture Capital Commitments
Hernan Herrera-Echeverri
EAFIT University
Carrera 49 N° 7 Sur – 50, Medellin, Colombia E-mail. [email protected]
http://dx.doi.org/10.5755/j01.ee.28.3.13216
This study investigates the relationship between Public Expenditure on Research and Development (PR&D) Venture Capital (VC) Investment. Using a comprehensive database of 40 countries: the OECD country-members plus Argentina, China, Romania, Russian Federation, Singapore and South Africa, from 1998 to 2012, we find that PR&D has a positive effect on VC Investment. PR&D can affect some factors that could increase or reduce the expected rate of return for VC investments, but our outcomes indicate a net effect positive and PR&D does seem to generate value through fostering VC activity in the economy. This is especially true in countries with higher institutional quality and higher level of articles published by the scientific community. This could indicate two things: first, that PR&D is more efficient and strategically addressed in countries with high institutional quality; and second, it confirms that scientific production works in partnership with PR&D in generating VC opportunities. PR&D is more important for the generation of VC investments in countries with lower infrastructure; in these countries, the government decision for increasing PR&D takes more relevance in fostering active VC markets. The above conclusions are confirmed for early stage (ES), high technology (HT) and manufacturing sector (MS) venture capital investments, indicating that PR&D is specifically important for these three kinds of VC investments, however infrastructure availability remains definitive to increase MS venture capital investments. The results are based on a panel study controlling endogeneity with a generalized method of moments (GMM) dynamic panel estimator model with a collapsed instrument matrix and two lags.
Keywords: Venture Capital, Public Expenditure in R&D, Institutional quality, High Technology Investments, Start-up.
Introduction
There is consensus in the literature about the importance of venture capital (VC) funds financing for new business creation (Black & Gilson, 1998; Hellmann & Puri, 2000, 2002; Kortum & Lerner, 2000, Popov & Roosenboom, 2013). Companies in early development stages and inside of high-tech industry sectors take advantage from VC funds investments, because they offer market knowledge, managerial guidance and greater risk tolerance (Gompers, 1995; Gabrielsson & Huse, 2002; Hsu, 2004).
Recently a stream of research has been devoted to guide policy makers on taking special measures to promote VC market development (Jeng & Wells, 2000; Belke et al., 2002; Megginson, 2004). However, a few studies have focused on the relation between Public Expenditure on Research and Development (PR&D) and the creation of active VC markets. As economies become ever more dependent on innovation and creation of new sources for achieving sustained growth (like the produced by VC investments), PR&D has received a high priority in the economic policy agenda and has been absorbing large sums of public money, but we still know little about the benefits of PR&D in the creation of active VC markets. This paper contributes to fill that gap by providing a comprehensive study of the effect of PR&D on VC commitments.
Previous studies have found that R&D expenditures are positively related to VC investments regardless of their sources (Gompers et al., 1998 for United States over 1976– 1994; Mondher & Kaouthar, 2011 for 21 European countries over 1997–2006; Romain & de La Potterie, 2004
for 16 OECD Countries between 1990 and 2000; Adongo, 2011 for 37 European countries) while others have not found a significant relation between the total R&D expenditure (Felix et al., 2007, for 23 European countries from 1992 to 2003) or Public R&D expenditure (Da Rin et al., 2006 for 14 European countries between 1988 and 2001) and the VC activity.
Our focus is oriented specifically to shedding light on the effect of PR&D in generating VC activity and determining what economic conditions could affect the productivity of the possible benefits of PR&D on VC markets. We explore how this relation is affected when PR&D interacts with three relevant country-level factors that can make an environment more fertile for VC investment: institutional quality degree, scientific production level and infrastructure availability.
The Relation Between Public Investment on R&D
(PR&D) and Venture Capital Commitments
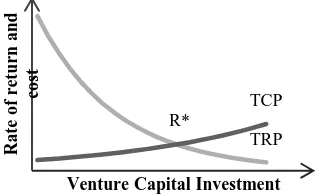
The influence of PR&D over VC industry can be analyzed using an adaptation of a familiar, rather elementary aggregate equilibrium model of fund-level investment behavior. At one point in time, an array of potential VC projects are available to invest in the market, VC funds in the market consider the expected cost and benefit streams for available projects and calculate its expected rate of return (ERR). VC funds use these rates of return to rank the associated projects in descending order of forecasted yield and forming a total return profile (TRP) to build a VC portfolio.
TRP has a downward sloping in relation with VC investment amount and cross with the total cost profile (TCP) at break-even point of equilibrium (R*). In Figure 1, TRP and TCP are plotted on the vertical axis; while the horizontal axis represents the cumulated amount of investment required as one proceeds down the list of VC investment opportunities available in the market (demand for VC investments).
The TCP reflects the minimum average rate of return required to cover expenses related with fund administration and the rate of return expected by the fund investors. The last one reflects the investor’s opportunity cost in relation with their risk appetite. Although the assumption of risk neutrality on the part of the fund is implied by the use of the ERR, the upward slope of TCP schedule over its full range reflects that VC resources are limited and as volume of VC investment is increased, the fund will require finance projects attracting recourses from external financing and this would tend to push its TCP upwards.
In the next paragraphs, we use this framework to discuss how PR&D could increase and decrease TRP or TCP associated to VC aggregate fund portfolio and how it could affect funds decision to increase or reduce its investment commitments.
Figure 1. Relation between Total Return Profile (TRP) and Total Cost Profile (TCP) for Venture Capital Funds
PR&D
and
Increasing
VC
Investment
Opportunities Return
Existing literature about VC activity determinants mention that PR&D policy could lead to either an increase in the returns associated to TRP or a reduction on costs associated to TCP in several ways. PR&D can raise innovative output and expand scientific knowledge base. Schumpeter (1934) and Ames (1961) have mention that
PR&D, through formalizing and making public advancements in different research fields, can lead to the generation of new valuable entrepreneurial ideas and marketable new products and processes, increasing the demand for VC investments.
As is known, one of the rationales for PR&D is the correction of the market failures in the production of scientific and technological knowledge, arising from the ‘‘incomplete private appropriability’’ problems identified by Nelson (1959) and Arrow (1962). In response to the tendency towards under provision of knowledge-based innovative effort on the part of private sector, governments have opted for the direct procurement or production in public facilities, for example financing public research institutes and national laboratories.
Where public funds are intended for test facilities construction, durable research equipment acquisition and specialized research teams assembly, related VC investment opportunities can emerge at lower operational costs, and thereby it could derive in higher expected internal rates of return (Leyden & Link, 1991; David et al., 1992).
Public funding of R&D can contribute indirectly, by generating knowledge spillovers and by complementing and stimulating private R&D expenditures. For example, the defense and pharmaceutical related research expenditures funded through public agencies may create social benefits in the form of knowledge and training spillovers. These spillovers emerge like opportunities to boost private sector productivity and encourage investments by VC funds interested in exploiting the technological innovations related, from which will flow future streams of cash flows (Jaffe, 1989; Adams, 1990; Acs et al., 1991; and, Toole, 2007).
The knowledge spillover from PR&D could reduce not only the costs associated to VC investment opportunities, but decrease the project costs variance and, simultaneously the risk perceived by VC funds. Additionally, these knowledge spillovers could encourage the “Horse Race” for proprietary inventions in the field (Cohen & Levinthal, 1989), and this represents an incentive for VC funds to invest in projects related in order to take advantage of opportunities to increase its ERR.
Government contract R&D could be a signal of future public sector product demand, as well as, future private sector demand in markets for dual-use goods and services. Venture Capitalists attentive to these signals could catch projects targeted to those markets. Similarly, Public R&D in a particular area may signal government intention to promote the use of a particular technology and this may entail either a future commitment to diffusion activities by public agencies, or favorable tax incentives for adoption of such technologies. Consequently the expected rate of return on VC financed projects in these fields would be raised.
PR&D
and
Decreasing
VC
Investment
Opportunities Return
On the other hand, there is not few the academics who arrive to contrary conclusions: they found that some public R&D efforts have failed to provide significant commercial spillovers because inefficiency in the selection of government agencies and corruption generate a TRP
R*
TCP
Ra
te
o
f
re
tu
rn
a
n
d
co
st
misallocation of resources on low-impact projects (Cohen & Noll, 1991). In this case no significant effect would have PR&D in generating VC opportunities.
An additional argument against benefits of PR&D over the returns of VC industry is that direct funding of R&D programs designated by government agencies prioritizes projects that are perceived to offer high marginal social rates of return. Such funding could be concentrated in areas where there is a large gap between the social and the private rate of return. In these cases, resulting ERR could be no attractive to VC funds because they need to ensure a minimum return to cover expenses related with fund administration and the rate expected by the fund investors.
Sometimes, publicly funded research and development are earmarked by governments to the public domain. This could produce a crowding out effect over venture capitalist initiative (mainly in the high technology seed VC investments) in two senses: the first one, is that venture capitalist couldn’t enjoy the exclusive returns related with patents because property rights would be publicly held. The second one, is a displacement effect, Venture Capitalists might be discouraged from undertaking some investments because they wouldn’t want to compete with the government agencies. They would wait for outcomes of the governmental initiative because they know about state incentives to disseminate these outcomes. The resulting alteration push the shape of the TRP schedule downward and to the left, specifically for technological seed VC investments.
The competition between the public and private sectors for specialized resources like human talent and facilities, can rise the prices of inputs used in technological VC investment opportunities, translating into higher costs for VC projects and reducing its ERR. Since technological VC projects require specialized inputs, in some countries the supply of, say researchers and engineers with particular expertise, can be low. The short-run impact of public R&D demand of this kind of inputs increases its costs and consequently, reduces the expected rate of return on the private sector’s investment, leading some VC projects to be curtailed – ceteris paribus.
A last consideration in this sense could be that, where PR&D sends a signal of future public o private sector product demand in markets for dual-use goods or services and attracting Venture Capital investment (as was mention above), the resulting payoffs structure would induce wastefully duplicative private investments and be associated with excessive expenditures directed toward hastening the projects completion. The consequence could be not only a reduction in project rates of return; also these phenomena could generate overfunded sectors, whereas others are underfunded.
As it can be concluded, the question about could private investment be crowded out by public investment in technological fields has been viewed in the larger context of the political economy literature. Many researchers have taken a critical position regarding the State intervention in the economy. As we mentioned the rationale for PR&D starts on the presupposition that too little research would be performed by private sector initiative, but intense concern surrounds the possibility that public allocations are substitutes of investments that private firms would otherwise undertake. There is a worry that the use of
taxpayers ‘money has rendered far less effectual than might be supposed in augmenting society’s investment in generating technological progress (Bergstrom et al., 1986; David, 1997).
Literature reviewed above allows us to identify a persisting lack of a clear-cut consensus about if PR&D encourage or displace the related private investment. Empirical works also show contradictory findings, for example, Robson (1993) concludes that there is a one-for-one stimulus, Wallsten (1999) concludes that there is a one-for-one- for-one crowding-out, whereas Da Rin et al. (2006) find no evidence of an effect of increased public R&D spending on the VC activity, specifically for high technology and early stage VC investments.
We have a considerable doubt about the idea that there is a universal relationship of a determined type, we think that this relation can be affected by other variables surrounding in the economy. Specifically, besides testing significance and direction of relation between PR&D and VC, we are seeking to explore how this relation is affected when PR&D interacts with three relevant country-level factors that can make an environment more fertile for VC investment: institutional quality degree, scientific production level and infrastructure availability.
Data and Variables Description
Information about venture capital investment comes from Thomson ONE, private equity database (venture capital module). The Thomson ONE database contains information for venture capital deals performed in 40 countries studied: the OECD country-members plus Argentina, China, Romania, Russian Federation, Singapore and South Africa, over a 14 year period, from 1998 to 2012.
The dependent variable (Venture capital activity) is measured in terms of three proxies. The venture capital investment (vc_inv) indicates the total venture capital investment made at year i by country j. It is estimated as the natural log of one plus venture capital investment to economically active population ratio (18–64 years old) in each country-year (Popov & Roosenboom, 2013; Bottazzi & Da Rin, 2002; Da Rin et al., 2006; Kortum & Lerner, 2000; Herrera-Echeverri et al., 2014). Second proxy is venture capital deals (vc_deal), which denotes the number of venture capital investment deals in each country-year. It is computed as the natural log of one plus venture capital deals to economically active population ratio (18-64 years old) (Cumming & Li, 2013; Sahaym et al., 2010). Finally, to check the conclusions robustness we use a probit model where total number of VC deals at year i by country j is the independent variable.
The second criterion identifies VC investments in high-tech companies and it includes the following sectors: communications, computing and related, biotechnology and related, electronics, medicine and related. The third criterion identifies the VC investments in companies of the manufacturing sector, defined as the sum of investments in the 31, 32 y 33 business sector NAIC codes.
The explanatory variable is proxy with “Ps_r+d” that measure Public expenditure on research and development (PR&D) at year i by country j as share of Gross Domestic Product (GDP). PR&D represents public resources destined to activities undertaking for discovering or developing new products, including the improving of versions and qualities of the existing ones and the discover or the development the new or more efficient processes of production (SNA1, 1993). The data is in local currency, for this research purposes was calculated as a share of GDP. We work with annual flows of PR&D because this reduces positive serial correlation between dependent and independent variables2. Six control variables are included to ensure that the relation between explanatory variables and dependent variable can be authenticated. The first control variable is “Inst_qual”: quality of institutions determined according to the most recent version of “Worldwide Governance Indicators (WGI)” (Kaufmann, Kraay, & Mastruzzi, 2010). Second control variable is the market capitalization “Mar_cap” is the share price multiplied by the number of issued shares of domestic companies listed in the stock market in the previous year; investment companies, mutual funds or other forms of collective investment are not included. A higher stock market capitalization is preferred for venture capital investments (Black & Gilson 1998; Gompers, 1995; Jeng & Wells, 2000; Megginson 2004; Nahata, 2008; Schertler & Tykvova, 2012).
The third control variable proxies the innovation level of the country. “Art_pub” denotes the science & engineering articles published coming from country.To take into account the economic environment, we use the volume of imports and exports, “Trade” and GDP per capita.We use two variables to proxy the infrastructure development level of a country in a year: the Public expenditure in gross fixed capital formation (Public_fbk) as percentage of GDP and, the total road network reported in thousands of kilometers, which includes motorways, highways and other national or regional roads in a country (Road).
By convention in the SNA 1993, all the outputs produced by research and development, staff training, market research and similar activities are treated like being consumed as intermediate inputs even though some of them may bring future benefits. Intermediate consumption measures the value of goods and services that are transformed or entirely used up in the course of production during the accounting period. It does not cover the costs of using fixed assets nor expenditures on the acquisition of fixed assets. Therefore, no collinearity between Public_fbk and Ps_r+d is assumed.
1
The System of National Accounts (SNA) available on http://unstats.un.org/unsd/nationalaccount/sna2008.asp
Empirical Methodology
The aim of this research is to measure how PR&D influences the venture capital commitments in sample countries and extend that analysis to assess the effects of PR&D over three specific kinds of VC investments: early stage, high technology and manufacturing sector. For this propose, we use the panel data technique, where the main unit of observation is the VC investment in a country-year:
𝑌𝑖𝑡= 𝛽0+ 𝛽1𝑋𝑖𝑡+ 𝛽2𝑍𝑖𝑡+ 𝛽3𝐷𝑖+ 𝛽4𝐷𝑗+ 𝜀𝑖𝑡 (1)
Equation (1) describes the model. Where Yit denotes the VC investment (sensibility issues are established for total, early stage, high technology and manufacturing VC investment). Xit and Zit indicates the associated variables to PR&D and control variables respectively to each country in a year. Di is a matrix of year dummies to control VC industry effects, which is common to all countries. Dj is a matrix of dummies to control country effects, taking into account the convergence phenomena (Barro & Sala-i- Martin, 1992). Finally, εit is the idiosyncratic error.
We find temporal effects significance. Hausman Specification Test indicates fixed effects. Pesaran CD (cross-sectional dependence) Test was used to detect correlation of residuals across entities. Modified Wald Test and Wooldridge Test are used to detect heteroskedasticity and autocorrelation respectively. Panel Corrected Standard Errors, PCSE (Beck & Katz, 1995) estimators are used to solve contemporaneous correlation, autocorrelation and heteroskedasticity problems. With an appropriate period of time in the sample (14 years), it is possible to use the correction through PCSE models (Beck, 2001).
Analysis of Results
Public Expenditure on R&D and Venture Capital
Commitments
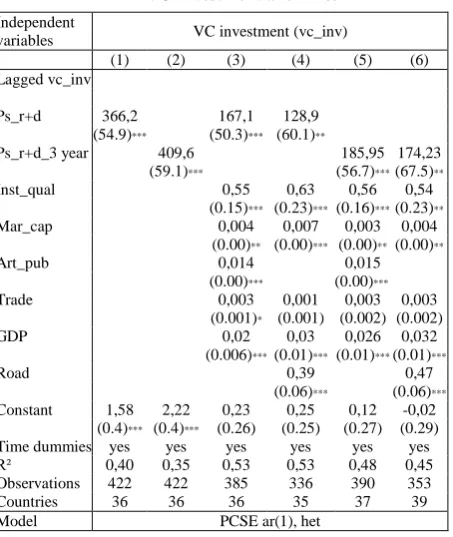
Table 1, column (1) shows the estimates from the basic panel data regression. The Dependent variable is the natural logarithm of VC investment scaled by economically active population (vc_inv) and the main explanatory variable is Public expenditure on R&D (Ps_r+d) as share of GDP. The coefficient is significant and positive, implying that the VC is higher in countries with higher PR&D. The numerical interpretation of regression coefficient is: increasing PR&D in a 1 % of GDP would increase the VC on average 36,620.7 dollars per inhabitant economically active. This simple first empirical test confirms the complementarity between private VC investment and public R&D investment.
Because PR&D can take more than a year to show results in Model (2), an alternative PR&D measure is used, the 3-year average of public expenditure on R&D (Ps_r+d_3 year). In this case the resulting coefficient is again positive and significant and its magnitude implies that on average VC investment level is higher in countries with greater PR&D. However, before addressing endogeneity concerns the above results should be seen with caution.
In table 1, models (1) using PR&D and (2) using 3-year average PR&D, show a positive and significant coefficient
2That could happen when the stocks of PR&D are used in the regression
between VC investment and PR&D. This relation is tested once again in models (3) and (4) using PR&D and in model (5) and (6) using 3-year average PR&D but this time control variables are included in the models. All control variables show the behavior predicted in the literature (Lagged Inst_qual, Mar_cap, Art_pub, GDP and Road show a positive and significant coefficient in relation with VC at 1 % or/and 5 %) and the relation between PR&D and 3-year average PR&D with VC investment follows positive and statistically significant. Results persist after controlling country specific developments that vary over time.
Table 1 VC Investment and PR&D
Independent
variables VC investment (vc_inv)
(1) (2) (3) (4) (5) (6)
Lagged vc_inv
Ps_r+d 366,2 167,1 128,9
(54.9)*** (50.3)*** (60.1)**
Ps_r+d_3 year 409,6 185,95 174,23
(59.1)*** (56.7)*** (67.5)**
Inst_qual 0,55 0,63 0,56 0,54
(0.15)*** (0.23)*** (0.16)*** (0.23)**
Mar_cap 0,004 0,007 0,003 0,004
(0.00)** (0.00)*** (0.00)** (0.00)**
Art_pub 0,014 0,015
(0.00)*** (0.00)***
Trade 0,003 0,001 0,003 0,003
(0.001)* (0.001) (0.002) (0.002)
GDP 0,02 0,03 0,026 0,032
(0.006)*** (0.01)*** (0.01)*** (0.01)***
Road 0,39 0,47
(0.06)*** (0.06)***
Constant 1,58 2,22 0,23 0,25 0,12 -0,02
(0.4)*** (0.4)*** (0.26) (0.25) (0.27) (0.29)
Time dummies yes yes yes yes yes yes
R² 0,40 0,35 0,53 0,53 0,48 0,45
Observations 422 422 385 336 390 353
Countries 36 36 36 35 37 39
Model PCSE ar(1), het
To advance in testing the positive relation between VC and PR&D, another robustness check is made using another proxy for VC. The natural logarithm of the number of VC deals scaled by economically active population (vc_deal) is included to confirm the outcomes obtained to this point. Table 2, columns (1) to (6) show again that PR&D and 3-year average PR&D remain positive and significant both at 1 % or/and 5 % level in all models, including the models (10) to (13) where control variables were incorporated (note that control variables maintain the behavior presented in equations (3) to (6)). The conclusion is PR&D and 3-year average PR&D have a positive and significant relationship in increasing both the amount of investments and the number of VC deals.
Finally, a different specification was included in table 3 to check the robustness of above conclusions. In columns (2) and (3), total VC deals in a country-year is used as a dependent variable to regress with PR&D and 3-year PR&D. Taking into account the discrete nature of the number of VC deals, the initial specification is replaced with a Probit model. The coefficients of the explanatory variables do not change and they are significant at 5 % in the case of the lagged PR&D and at 10 % in the case of 3-year average PR&D.
Endogeneity and Selection
The empirical methodology followed to this point may be exposed to endogeneity problems. Positives coefficients in the models do not imply necessarily causality between PR&D and VC. Becker (2014) mentioned that private and public R&D investment respond together to expectations of future technological shocks. This may result in endogeneity bias because governments and VC funds can guide their investment efforts in the same line of action. In general, strict exogeneity would imply that technological shocks do not affect simultaneously current PR&D, and VC. Obviously this assumption is difficult to hold, and this implies a possible endogenous relationship between VC and PR&D.
Table 2 VC Deals and PR&D
Independent
variables VC deals (vc_deal)
(1) (2) (3) (4) (5) (6)
Lagged vc_inv
Ps_r+d 165,9 120,5 113,5
(41.5)*** (38.6)** (43.0)**
Ps_r+d_3 year 287,8 191,6 189,7
(48.3)*** (41.2)*** (43.8)***
Inst_qual 0,55 0,61 0,65 0,65
(0.14)*** (0.21)*** (0.15)*** (0.24)***
Mar_cap 0,001 0,003 0,001 0,001
(0.001) (0.001)** (0.001) (0.001)
Art_pub 0,007 0,006
(0.002)*** (0.002)***
Trade 0,002 0,001 0,002 0,002
(0.001)* (0.001) (0.001) (0.001)*
GDP 0,012 0,013 0,003 0,008
(0.005)*** (0.007)** (0.006) (0.007)
Road 0,23 0,23
(0.46)*** (0.05)***
Constant 1,22 1,29 0,23 0,19 0,13 -0,04
(0.27)*** (0.29)*** (0.19) (0.19) (0.18) (0.17)
Time dummies yes yes yes yes yes yes
R² 0,48 0,44 0,56 0,57 0,54 0,55
Observations 422 422 386 337 392 355
Countries 36 36 36 35 37 39
Model PCSE ar(1), het
Likewise, the analysis of complementary and substitutes effects of public R&D over private investment in David et al (2000) mentions the possible mutual interdependence between public and private R&D expenditures. Omitted variables in the aggregate models can affect simultaneously VC and PR&D and be correlated with both, the public and the private R&D investment decisions.
One simple way to account for the possible endogeneity of current VC and PR&D is to use lagged values of PR&D. All the models in this work used lagged valued for independent and control variables. Lagged PR&D should be less correlated with current VC and hence should partially address the concern that VC investors and governments react the same way to current technology opportunities. A similar argument can be wielded to deal with the correlation that can emerge because the omitted variables in the aggregated models.
that this fact represents and obtain unbiased estimators in the models, we use difference and system GMM dynamic panel estimator model with a collapsed instrument matrix and two lags3 (Roodman, 2009).
In table 3, the estimates from the 2SLS procedure are reported in column (1) where VC is regressed against the lagged PR&D (Ps_r+d) and the lagged VC (Lagged vc_inv). In both cases, the sign is positive and the effect is significant at the 10 % and 5 % statistical level, implying that the relevance condition is satisfied and the relationship between public R&D and VC continues strong after taking in account possible endogenous issues. In the same way that previous models tested in this paper, the behavior of all control variables after 2SLS procedure remains consistent. The p-value associated to the Hansen J-test required for the difference and system GMM dynamic panel estimator model, reject the null hypothesis indicating the validity of the instruments and the over-identifying restriction condition fulfillment. The robustness of above results is confirmed by Diff-in-Hansen test (excluding group and difference).
Table 3 VC and PR&D Robustness
Independent variables Second Stage vc_inv Total VC deals
(7) (14) (15)
Lagged vc_inv 0,22
(0.11)**
Ps_r+d 262,8 149,35
(262.8)* (75.48)**
Ps_r+d_3 year 136,82
(83.61)*
Inst_qual 0,52
(0.24)**
Mar_cap 0,004
(0.002)
Art_pub 0,008
(0.004)**
GDP 0,017
(0.014)
Constant 1,28 1,49
(0.39)*** (0.47)***
Time dummies yes No No
Observations 400 422 422
Countries 39 36 36
Model 2SLS_GMM Probit
Sensibility to Country Environment Characteristics
In following tables we analyze the country characteristics of the business environment that, in theory, can affects the productivity of PR&D to generate VC investment. We interact PR&D with four relevant country-level variables that can make a country more fertile for VC investment: Institutional quality (inst_qual), the science & engineering articles published coming from the country (art_pub), the Public expenditure in gross fixed capital formation (Public_fbk) as share of GDP and the total road network reported in a country (Road).
In Table 4, column (1), PR&D interacts with institutional quality for countries with high (Ps_r+d*Inst_qual_high) and low (Ps_r+d*Inst_qual_low)
3GMM estimators are accomplish by xtabond2 package in Stata (further
information see Roodman, 2009)
institutional quality (above or below the media, respectively). Coefficients magnitude shows that the effect of PR&D is greater in countries with higher institutional quality. Column (2) shows the same result using the interaction between PR&D with low and high institutional quality, both calculated with a three-year average (Ps_r+d_3 year* Inst_qual_low_3 year and Ps_r+d_3 year* Inst_qual_high_3 year, respectively). The magnitude of the resulting coefficients confirms that PR&D is more productive in countries with high institutional quality.
Table 4 Sensibility to Inst_qual and Art_pub
Independent Variables Dependent Variable: VC investment
(1) (2) (3) (4)
Ps_r+d* 149.45
Inst_qual_low (60.44)**
Ps_r+d* 177.16
Inst_qual_high (55.24)***
Ps_r+d_3 year* 118.98
Inst_qual_low_3 year (40.24)***
Ps_r+d_3 year* 138.48
Inst_qual_high_3 year (41.01)***
Ps_r+d* 68.44
Art_pub_low (46.25)
Ps_r+d* 160.40
Art_pub_high (38.50)***
Ps_r+d_3 year* 95.46
Art_pub_low_3 year (41.37)**
Ps_r+d_3 year* 166.46
Art_pub_high_3 year (38.00)***
Inst_qual 0,55 0,61 0,617 0.68
(0.19)*** (0.17)*** (0.15)*** (0.16)***
Mar_cap 0.005 0.001 0.002 0.001
(0.002)*** (0.001) (0.001)** (0.001)
Art_pub 0.013 0,007 0.004 0.004
(0.002)*** (0.002)*** (0.002)** (0.002)**
Trade 0.003 0.002 0.003 0.002
(0.002) (0.0013) (0.001)** (0.001)*
GDP 0.024 0.006 13.00 0.007
(0.007) (0.005) (0.005)** (0.005)
Constant 0.379 0.447 0,18 0,299
(0.306) (0.211)** (0.198) (0.191)
Time dummies yes yes yes yes
R² 0,404 0,586 0,522 0,599
Observations 422 339 422 339
Countries 36 36 36 36
Model PCSE ar(1), het
In this case, PR&D is complementary to institutional quality, implying that the benefits of PR&D on new VC investment generation improve when the levels of institutional quality are higher. This could indicate that the PR&D is more efficient and strategically addressed in countries with high institutional quality.
Countries with low institutional quality can report high levels of PR&D but the final destination of these resources can be affected by political compromises or other phenomena of this type that could reduce the positive effect if the PR&D resources are not well localized (Herrera et al., 2014).
investment. In countries with lower levels of institutional quality, the protection of venture capitalists may be deterred by the fact that the system will not protect innovative products adequately (Antonelli & Teubal, 2008).
In column (3), PR&D interacts with articles published. Countries with high (Ps_r+d*Art_pub_high) and low (Ps_r+d*Art_pub_low) level of articles published (above or below the media, respectively). Coefficients show that the effect of PR&D is greater in countries with higher level of articles published.
Table 5 Sensibility to Roads Paved and FBK
Independent Variables Dependent Variable: VC investment
(5) (6) (7) (8)
Ps_r+d* 143.75
Road_low (52.74)***
Ps_r+d* 130.77
Road_high ( 43.46)***
Ps_r+d* 202.11
Road_low_3 year (50.6048)***
Ps_r+d* 148.77
Road_high_3 year (44.63)***
Ps_r+d* 227.79
Public_ fbk_low (43.64)***
Ps_r+d* 219.01
Public_ fbk_high ( 44.26)***
Ps_r+d* 265.29
Public_ fbk_low_3 year ( 49.37)***
Ps_r+d* 237.16
Public_ fbk_high_3 year (49.82)***
Inst_qual 0.57 0.63 0.40 0.46
(0.21)*** (0.20)*** (0.17)** (0.173)***
Mar_cap 0.003 0.002 0.003 0,001
(0.001)** (0.001) (0.0011)*** (0.001)
Art_pub 0,007 0.008 0.005 0,0043
(0.002)*** (0.002)*** (0.0017)*** (0.002)**
Trade 0.002 0.001 0,0038 0.002
(0.001) (0.001) (0.0019)** (0.0023)
GDP 0.01 0.0001 0,0073 0.001
(0.007) (0.006) (0 .0054) (0.006)
Constant 0.10 0.289 -0.207 0,101
(0.20) (0.215) (0.283) (0.318)
Time dummies No yes No yes
R² 0,516 0,506 0,545 0,514
Observations 347 388 334 356
Countries 38 37 35 33
Model PCSE ar(1), het
For robustness, we test again the result using the interaction between 3-year average PR&D with low and high level of 3-year average articles published (Ps_r+d_3 year* Art_pub_low_3 year and Ps_r+d_3 year* Art_pub_high_3 year in column 4). Once more, the magnitude of the resulting coefficients confirms that PR&D is more productive in countries with high level of articles published. This result broadly confirms a strand of literature (before cited), which has documented the value of the scientific production in fostering the VC industry. In this case, scientific production is complementary to PR&D, implying that the benefits of PR&D on new VC commitments is increased if the scientific community is under conditions to intensify their production properly.
Next, we address aspects related with country infrastructure condition. Results obtained in this case are somewhat counterintuitive. The effect of PR&D on VC is stronger in countries with low infrastructure. In table 5, columns (1) and (2) PR&D and 3-year average PR&D interact with total previous year and 3-year average road
network for countries below and above of the sample media
(Ps_r+d*Road_low, Ps_r+d*Road_
high,Ps_r+d*Road_low_3year and Ps_r+d*Road_ high_ 3year, respectively). The coefficients are positive, significant and their magnitude is higher in countries with lower road network for both cases, using the total previous year or 3-year average road network.
Table 6 Early stage VC and Inst_qual
Independent variables Early stage VC Investment
(1) (2) (3) (4)
Ps_r+d 127,50
( 42.67)***
Ps_r+d_3 year 143,65
(38.84)***
Ps_r+d* 74,14
Inst_qual_low (61.37)
Ps_r+d* 111,72
Inst_qual_high (46.84)**
Ps_r+d_3 year* 100,94
Inst_qual_low_3 years (64.95)
Ps_r+d_3 years* 118,38
Inst_qual_high_3 years (52.27)**
Inst_qual 0,25 0,31 0,62 0,57
(0 .12)** (0.11)*** (0.15)*** (0.19)***
Mar_cap 0,006 0,005 0,006 0,005
(0.002)*** (0.001)*** (0.002)*** (0.002)***
Art_pub 0,011 0,011 0,011 0,012
(0.002)*** (0.001)*** (0.002)*** (0.002)***
GDP 0,0313 0,027 0,02 0,024
(0.007)*** (0.006)*** (0.007)*** (0.007)***
Constant -0,35 -0,38 -0,35 -0,52
(0.16)** (0.16)** (0.24) (0.30)*
Time dummies No yes No yes
R² 0,46 0,43 0,47 0,36
Observations 389 425 355 349
Countries 38 38 35 34
Model PCSE, het PCSE, het PCSE, ar(1), het PCSE, het
spending in research and innovation (it was allocated 114 euros per capita in PR&D). Finnish model, oriented to funding innovative startups, has positioned this country like the second innovative country of Europe (WEF, 2014). Switzerland has adopted a similar policy (SERI, 2013) and actually it is ranked like the first European innovative country (WEF, 2014).
Sensibility to Stage, Level of Technology and
Sector of Investment
We advance testing the relation between PR&D and VC activity, specifically for three different kinds of investments: early stage (ES, tables 6 and 7), high technology (HT, tables 8 and 9) and manufacturing sector (MS, tables 10 and 11). Coefficients associated with public investment in research and development (Ps_r+d) are positive and significant at 1 % in all three cases, implying that ES, HT and MS venture capital investments are higher in countries with higher PR&D (column 1 of tables 6,8,10).
Table 7 Early stage VC, Road Paved and Art_Pub
Independent variables Early Stage VC Investments
(1) (2) (3) (4)
Ps_r+d* 147,77
Art_pub_low (65.90)**
Ps_r+d* 223,84
Art_pub_high (54.98)***
Ps_r+d_3 year* 136,47
Art_pub_low_3 years (45.85)***
Ps_r+d_3 year* 231,91
Art_pub_high_3 years (43.31)***
Ps_r+d* 105,37
Road_low (55.32)**
Ps_r+d*Road_high 93,39
Road_high (47.07)**
Ps_r+d* 131,13
Road_low_3 year (54.71)**
Ps_r+d* 126,68
Road_high_3 year (47.8)***
Inst_qual 0,30 0,30 0,27 0,36
(0.17)* (0.12)** (0.1724) (0.17)**
Mar_cap 0,006 0,006 0,009 0,007
(0.002)*** (0.001)*** (0.002)*** (0.002)***
Art_pub 0,005 0,004 0,0104 0,011
(0.002)** (0.002)** (0.0015)*** (0.002)***
GDP 0,033 0,037 0,028 0,022
(0.011)*** (0.007)*** (0.01)*** (0.009)**
Constant -0,62 -0,74 -0,29 -0,29
(0.24)** (0.15)*** (0.16)* (0.17)
Time dummies yes yes No yes
R² 0,41 0,54 0,46 0,37
Observations 351 369 351 407
Countries 35 35 38 38
Model
PCSE ar(1),
het PCSE, het PCSE, het PCSE, het
Last result is checked using the 3-year average of public expenditure on R&D (Ps_r+d_3 year) as an explanatory variable; again coefficients are positive and significant at 1 % in all cases (column 2 of tables 6,8,10). In all models, the explicative variables’ coefficients are estimated using control variables and outcomes associated to all of them follow consistently the expected behavior according to the theory. The emerging conclusion is that public investment in research and development is important, not only to encourage venture capital commitments in high technology investments, but also it benefits manufacturing industry and
firms in early stages of development. Other studies like Da Rin et al. (2006) suggest that increasing public R&D does not result in a higher early stage or high tech entrepreneurial ventures. A reason could be they use as dependent variable innovation and early stage ratios (HT-VC investment to total private equity –PE- investment and ES-VC investment to total VC investment). These measures do not take into account the increases in ES and HT venture capital investments when the total PE or total VC investment grows above ES and HT investments, and that can be critical, especially in years which PE and VC industry have had great expansions in general (for example some years in our sample).
Our conclusion is in line with the approach of Leyden and Link (1991) and David et al. (1992); these authors agree that technological knowledge and market information associated with publicly funded R&D could result in “spillovers” for firms in the same industry or related industry sectors. Acs et. al (2009) arguments are in the same line, they mention that spillovers increase the opportunities available to entrepreneurs and show a strong relationship between knowledge spillovers and new venture creation.
PR&D performed in academic and other non-profit institutions, including government laboratories could have positive spillover effects, particularly where the research produces general principles, tools and techniques, and access to skills that could rise the expected returns of commercially oriented applied R & D projects and as well as generate incentives to VC investment in diverse economic sectors.
Table 8 High Tech VC and Inst_Qual
Independent variables High Technology VC investment
(1) (2) (3) (4)
Ps_r+d 204,38
(53.94)***
Ps_r+d_3 year 273,81
(64.91)***
Ps_r+d* 189,61
Inst_qual_low (60.87)***
Ps_r+d* 213,05
Inst_qual_high (56.11)***
Ps_r+d_3 year* 189,44
Inst_qual_low_3 year (71.83)***
Ps_r+d_3 year* 273,57
Inst_qual_high_3 year (68.35)***
Inst_qual 0,71 0,75 0,651 0,562
(0.19)*** (0.19)*** (0.21)*** (0.205)***
Mar_cap 0,005 0,004 0,005 0,003
(0.002)*** (0.002)** (0.002)*** (0.002)*
Art_pub 0,013 0,015 0,013 0,014
(0.002)*** (0.002)*** (0.002)*** (0.002)***
Independent variables High Technology VC investment
GDP 0,023 0,012 0,022 0,014
(0.00)*** (0.00) (0.00)*** (0.00)
Constant -0,12 -0,27 -0,05 -0,03
(0.257) (0.25) (0.27) (0.29)
Time dummies Yes yes Yes yes
R² 0,47 0,40 0,48 0,42
Observations 402 437 402 403
Countries 39 39 39 39
Model PCSE ar(1), het
effects of PR&D over ES (table 6), HT (table 8) and MS (table 10) venture capital investments. We start interacting PR&D in countries with low (Ps_r+d*Inst_qual_low) and high (Ps_r+d*Inst_qual_ high) level of Institutional quality, below or above the media, respectively. We find that the effect of PR&D on ES, HT and MS venture capital investments depends on institutional quality. Once again, coefficients show that the effect of PR&D is greater in countries with higher institutional quality for three kinds of VC investments studied, but for ES-VC investment the coefficient looses its significance when the institutional quality is low, indicating that institutional quality is particularly critical for these kinds of investments.
Table 9 High Tech VC , Road Paved and Art_Pub
Independent variables High Technology VC investment
(1) (2) (3) (4)
Ps_r+d* 119,46
Art_pub_low (61.47)*
Ps_r+d* 243,03
Art_pub_high (52.76)***
Ps_r+d_3 year* 95,66
Art_pub_low_3 year (48.99)**
Ps_r+d_3 year* 278,73
Art_pub_high_3 year (43.91)***
Ps_r+d* 196,22
Road_low (69.34)***
Ps_r+d* 157,83
Road_high (62.03)**
Ps_r+d* 213,60
Road_low_3 year (71.09)***
Ps_r+d* 211,63
Road_high_3 year (63.03)***
Inst_qual 0,81 0,79 0,75 0,74
(0.19)*** (0.14)*** (0.25)*** (0.23)***
Mar_cap 0,005 0,005 0,008 0,007
(0.002)*** (0.001)*** (0.002)*** (0.002)***
Art_pub 0,009 0,008 0,013 0,014
(0.002)*** (0.002)*** (0.002)*** (0.002)***
GDP 0,022 0,024 0,018 0,018
(0.008)*** (0.007)*** (0.011)* (0.011)*
Constant -0,053 -0,225 -0,027 -0,211
(0.266) (0.179) (0.277) (0.256)
Time dummies Yes Yes Yes Yes
R² 0,49 0,54 0,49 0,44
Observations 402 437 351 409
Countries 39 39 38 39
Model PCSE ar(1), het
The last result coincides with early stage investments characteristics. Because these investments are associated with high uncertainty, more risk and greater difficult of monitoring, a greater possibility exists for potential moral hazard and adverse selection problems in relations established by venture capitalist (Amit, Brander & Zott, 1998; Gompers 1995; Kaplan & Stromberg 2004). Without strong institutions enforcing deals, governmental efforts in PR&D loose their productivity to generating VC activity. Coefficient reduction for low institutional quality when the model is calculated interacting 3-year average public spending on R&D with low (Ps_r+d_3 year* Inst_qual_low_3 year) and high (Ps_r+d_3 year* Inst_qual_high_3 year) 3-year average institutional quality for the three kind of VC Investment (column 4 in tables 6, 8 and 10), confirms that PR&D reduces its productivity generating VC investments in that case.
We also find that PR&D increases its productivity to generate ES (table 7), HT (table 9) and MS (table 11) VC
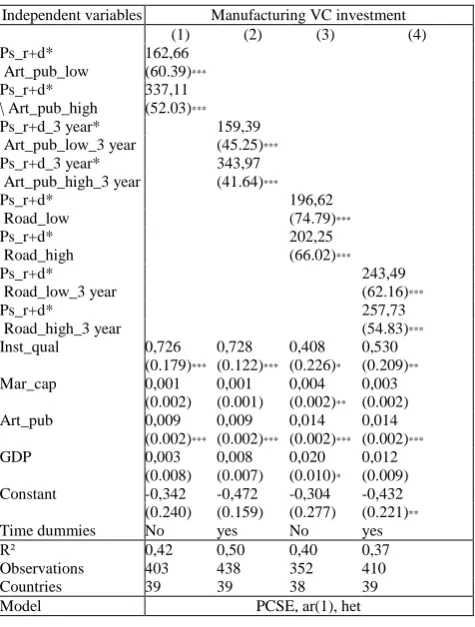
investments in countries with higher level of articles published. Once again, results are confirmed interacting PR&D in countries with low (Ps_r+d*Art_pub_low) and high (Ps_r+d*Art_pub_high) level of articles published (column 1) and 3-year average public spending on R&D with low (Ps_r+d_3 year* Inst_Art_pub_3 year) and high (Ps_r+d_3 year* Art_pub_high_3 year) 3-year average articles published (column 2). An issue of interest is that coefficients associated with the relationship between ES, HT and MS venture capital investments and PR&D interacting with high level of articles published increases its value 1.4, 1.7 and 2.1 times compared with coefficients associated to the relationship between total venture capital investments and PR&D, interacting with high level of articles published.
Table 10 Manufacturing VC and Inst_Qual
Independent variables Manufacturing VC investment
(1) (2) (3) (4)
Ps_r+d 269,11
(56.96)***
Ps_r+d_3 year 287,91
(52.01)***
Ps_r+d* 212,88
Inst_qual_low (62.36)***
Ps_r+d* 299,91
Inst_qual_high (59.03)***
Ps_r+d_3 year* 200,69
Inst_qual_low_3 year (68.61)***
Ps_r+d_3 year* 312,86
Inst_qual_high_3
year (58.07)***
Inst_qual 0,62 0,63 0,41 0,43
(0.18)*** (0.17)*** (0.19)** (0.19)**
Mar_cap 0,001 0,001 0,001 0,001
(0.002) (0.001) (0.002) (0.002)
Art_pub 0,016 0,016 0,015 0,015
(0.002)*** (0.002)*** (0.002)*** (0.002)***
GDP 0,002 0,003 0,001 0,002
(0.008) (0.007) (0.008) (0.008)
Constant -0,372 -0,433 -0,098 -0,069
(0.253) (0.232) (0.272) (0.299)
Time dummies no yes no yes
R² 0,380 0,354 0,392 0,379
Observations 403 438 403 387
Countries 39 39 39 37
Model PCSE, ar(1), het
For the first two, again the effect of PR&D on VC is stronger in countries with low infrastructure. This is confirmed using PR&D (column 3) and 3-year average PR&D (column 4) interacting with total previous year and 3-year average road network for countries below and above of the sample media (Ps_r+d*Road_low,Ps_r+d*Road_high,
Ps_r+d*Road_low_3 year and Ps_r+d*Road_high_3 year, respectively). The coefficients are positive, significant and its magnitude is higher in countries with lower road network for both cases.
Table 11 Manufacturing VC, Road Paved and Art_Pub
Independent variables Manufacturing VC investment
(1) (2) (3) (4)
Ps_r+d* 162,66
Art_pub_low (60.39)***
Ps_r+d* 337,11
\ Art_pub_high (52.03)***
Ps_r+d_3 year* 159,39
Art_pub_low_3 year (45.25)***
Ps_r+d_3 year* 343,97
Art_pub_high_3 year (41.64)***
Ps_r+d* 196,62
Road_low (74.79)***
Ps_r+d* 202,25
Road_high (66.02)***
Ps_r+d* 243,49
Road_low_3 year (62.16)***
Ps_r+d* 257,73
Road_high_3 year (54.83)***
Inst_qual 0,726 0,728 0,408 0,530
(0.179)*** (0.122)*** (0.226)* (0.209)**
Mar_cap 0,001 0,001 0,004 0,003
(0.002) (0.001) (0.002)** (0.002)
Art_pub 0,009 0,009 0,014 0,014
(0.002)*** (0.002)*** (0.002)*** (0.002)***
GDP 0,003 0,008 0,020 0,012
(0.008) (0.007) (0.010)* (0.009)
Constant -0,342 -0,472 -0,304 -0,432
(0.240) (0.159) (0.277) (0.221)**
Time dummies No yes No yes
R² 0,42 0,50 0,40 0,37
Observations 403 438 352 410
Countries 39 39 38 39
Model PCSE, ar(1), het
The relation between MS venture capital investments and PR&D interacting with road network shows a different behavior. PR&D is more productive generating MS venture capital investments in countries where level of road network is high (table 11). The result is checked using PR&D (column 3) and 3-year average PR&D (column 4) interacting with total previous year and 3-year average road network for countries
below and above of the sample media
(Ps_r+d*Road_low,Ps_r+d*Road_high,
Ps_r+d*Road_low_3 year and Ps_r+d*Road_high_3 year, respectively). Having greater road network increases significantly the positive effect of PR&D on motivating new MS venture capital commitments to get in the profitability chase.
Conclusions
We use a large panel of 40 countries over the 1998 to 2012 to identify the impact of PR&D on venture capital investment. We use the Thomson ONE Database, which includes data of 276.051 venture capital deals in the studied period. We find that PR&D has a sizeable effect on venture capital investments: numerically, an increase of 1 % in PR&D as a share of GDP increases the VC investments on average 36,620.7 dollars per inhabitant economically active. This effect is relatively higher in countries with higher level of institutional quality, and higher level of articles published. Also, we find that PR&D is more important for the generation of VC investments in countries with lower infrastructure.
Effects mentioned above hold for different VC investment proxies and stand when we correct for possible endogeneity in venture capital investment series, by using a difference and system GMM dynamic panel estimator model with a collapsed instrument matrix and two lags, obtaining more robust conclusions. The effect of PR&D on VC investments is robust accounting other time and country characteristics which has been considered in the literature as important determinants of VC activity.
Also, we find that PR&D is specifically important for Early Stage (ES), High Technology (HT) and Manufacturing Sector (MS) venture capital investments. Institutional quality increases the positive effect of PR&D on ES, HT and MS venture capital investments. Results show that the influence of PR&D is greater in countries with higher institutional quality for three kinds of VC investments studied. However, For ES-VC investment, PR&D looses its significance when the institutional quality is low, indicating that institutional quality is critical for these kinds of investments. We also find that PR&D increases its productivity to generate ES, HT and MS VC investments in countries with higher level of articles published. These results are in line with the efficiency of PR&D conceptual framework (Conte et al., 2009) and with the Knowledge Spillover approaches from Leyden and Link (1991), David et al. (1992) and Acs et al. (2009).
Finally, the pattern found in the relation between total VC investments and PR&D interacting with road network maintains the same behavior for ES and HT but not for MS venture capital investments. PR&D is more productive generating MS venture capital investments in countries where level of road network is high. Having greater road network increases significantly the positive effect of PR&D in the motivation of new MS venture capital commitments. However, the effect of PR&D on ES and HT VC investments is stronger in countries with low infrastructure, the conclusion is that in these last kind of countries PR&D becomes more important, and they should make a greater effort in PR&D to increase the volume of VC activity. All our results strongly suggest that PR&D is conductive to generating and increasing the attractiveness of venture capital investment opportunities.
fostering VC activity in the economy. However, a number of important questions remain unanswered due to the nature of our data. For example, what is the relative importance of the different channels via which PR&D affect VC investments? A second question arises to establish what kind of PR&D is more productive in generating VC activity; further research could classify PR&D according to its
short-time objectives (basic or applied) or according with the strategy used (for example, Tax incentives or direct subsidies). A third issue to be analyzed could be to determinate how PR&D impacts VC investment in different economic sectors. Future research can greatly contribute by addressing those questions.
References
Acs, Z. J., Audretsch, D. B., & Feldman, M. P. (1991). Real Effects of Academic Research: Comment. AmericanEconomic Review, 82, 363–367.
Acs, Z., Braunerhjelm, P., Audretsch, D., & Carlsson, B.. (2009). The Knowledge Spillover Theory of Entrepreneurship. Small Business Economics, 32(1), 15–30. https://doi.org/10.1007/s11187-008-9157-3
Adams, J. D. (1990). Fundamental Stocks of Knowledge and Productivity Growth. Journal of Political Economy, 98, 673– 702. https://doi.org/10.1086/261702
Adongo, J. (2011). Determinants of Venture Capital in Africa: Cross Section Evidence. The African Economic Research Consortium, AERC Research Paper 237.
Ames, E. (1961). Research, Invention, Development and Innovation. American Economic Review, 51(3), 370–381.
Amit, R., J. Brander., & C. Zott. (1998). Why Do Venture Capital Firms Exist? Theory and Canadian Evidence. Journalof Business Venturing, 13(6), 441–66. https://doi.org/10.1016/S0883-9026(97)00061-X
Antonelli, C., & Teubal, M. (2008). Knowledge-Intensive Property Rights and the Evolution of Venture Capitalism. Journal of Institutional Economics, 4, 163–182. https://doi.org/10.1017/S1744137408000945
Arrow, K. J. (1962). Economic Welfare and The Allocation of Resources to Invention. In: Nelson, R. (Ed.), The Rate and Direction of Inventive Activity. Princeton Univ. Press, 609–625. https://doi.org/10.1515/9781400879762-024
Barro, R., & Sala-i-Martin, X. (1992). Convergence. Journal of Political Economy, 100, 223–251. https://doi.org/10.1086/261816
Beck, N. (2001). Time Series Cross-Section Data: What Have We Learned in the Past Few Years. American PoliticalScience Review, 4, 271–293. https://doi.org/10.1146/annurev.polisci.4.1.271
Beck, N., & Katz, J. (1995). What to Do (and not to do) with Time-Series Cross-Section Data. American PoliticalScience Review, 89 (3), 634–647. https://doi.org/10.2307/2082979
Becker, B. (2014). Public R&D Policies and Private R&D Investment: A Survey of the Empirical Evidence. Journal of Economic Surveys, 1–26.
Belke, A., Fehn, R., & Foster, N. (2002). Venture Capital Investment and Labor Market Performance: A Panel Data Analysis, CESifo (Center for Economic Studies & Ifo Institute for Economic Research), Working Paper No. 652.
Bergstrom, T., Blume, L., & Varian, H. (1986). On the Private Provision of Public Goods. Journal of Public Economics, 29, 25–49. https://doi.org/10.1016/0047-2727(86)90024-1
Black, B., & Gilson, R. (1998). Venture Capital and the Structure of Capital Markets: Banks versus Stock Markets. Journal of Financial Economics, 72, 243–277. https://doi.org/10.1016/S0304-405X(97)00045-7
Bottazzi, L., & Da Rin, M. (2002). Venture Capital in Europe and the Financing of Innovative Companies. Economic Policy, 17, 229–269. https://doi.org/10.1111/1468-0327.00088
Cohen, W., & Levinthal, D. (1989). Innovation and Learning: The Two Faces of R&D. Economic Journal, 99, 569–596. https://doi.org/10.2307/2233763
Cohen, L. R., & Noll, R. G. (1991). The Technology Pork Barrel. The Brookings Institution Press, Washington, DC.
Conte, A., Schweizer, P., Dierx, A., & Ilzkovitz, F. (2009). An Analysis of the Efficiency of Public Spending and National Policies in the Area of R&D. European Economy, Occasional Papers 54. http://ec.europa.eu/economy_ finance/publications.
Culture, M. (2010). Research and Innovation Council of Finland. Research of Innovation Policy Guidelines for 2011–2015. Taken February 15th of 2015 from http://www.minedu.fi/export/sites/default/OPM/Tiede/tutkimus-.
Da Rin, M., Nicodano, G. & Sembenelli, A. (2006). Public Policy and the Creation of Active Venture Capital Markets. Journal of Public Economics, 90, 1699–1723. https://doi.org/10.1016/j.jpubeco.2005.09.013
David, P. A., Mowery, D., & Steinmueller, E.W. (1992). Analyzing the Payoffs from Basic Research. Economics ofInnovation and New Technology, 2, 73–90. https://doi.org/10.1080/10438599200000006
David, P. A. (1997). From Market Magic to Calypso Science Policy: A Review of Terence Kealey's. The Economic Laws of Scientific Research. Research Policy, 26, 29–55. https://doi.org/10.1016/S0048-7333(97)00007-3
David, P. A., Hall, B. H., & Toole, A. A. (2000). Is Public R&D a Complement or Substitute for Private R&D?: A Review of the Econometric Evidence. Research Policy, 29, 497–529. https://doi.org/10.1016/S0048-7333(99)00087-6
Felix, E., Gulamhussen, M., & Pires, C. (2007). The Determinants of Venture Capital in Europe - Evidence Across Countries. CEFAGE-UE Working Paper No. 2007/01.
Gompers, P. (1995). Optimal Investment, Monitoring and the Staging of Venture Capital. The Journal of Finance, 50 (5), 1461–1489. https://doi.org/10.1111/j.1540-6261.1995.tb05185.x
Gompers, P., Lerner, J., Blair, M., & Hellmann, T. (1998). What Drives Venture Capital Fundraising?. Brookings Paperson Economic Activity, Microeconomics, 149–204. https://doi.org/10.2307/2534802
Hellmann, T., & Puri, M. (2000). The Interaction Between Product Market and Financing Strategy: The Role of Venture Capital. Review of Financial Studies, 13(4), 959–84. https://doi.org/10.1093/rfs/13.4.959
Hellmann, T., & M. Puri. (2002). Venture Capital and the Professionalization of Start-Up Firms: Empirical Evidence. The Journal of Finance, 1, 169-197. https://doi.org/10.1111/1540-6261.00419
Herrera-Echeverri, H., Haar, J., & Estevez-Breton, J. B. (2014). Foreign Direct Investment, Institutional Quality, Economic Freedom and Entrepreneurship in Emerging Markets. Journal of Business Research, 67, 1921–1932.
https://doi.org/10.1016/j.jbusres.2013.11.020
Hsu, D. (2004). What Do Entrepreneurs Pay for Venture Capital Affiliation?. The Journal of Finance, 59(4), 1805–1844. https://doi.org/10.1111/j.1540-6261.2004.00680.x
Jaffe, A. B. (1989). Real Effects of Academic Research., American Economic Review, 79, 957–970.
Jeng, L., & Wells, P. (2000). The Determinants of Venture Capital Funding: Evidence across Countries. Journal ofCorporate Finance, 6, 241–289. https://doi.org/10.1016/S0929-1199(00)00003-1
Justman, M. (1995). Infrastructure, Growth and the Two Dimensions of Industrial Policy. The Review of EconomicStudies, 62 (1), 131–157. https://doi.org/10.2307/2297845
Kaplan, S., & Stromberg, P. (2004). Characteristics, Contracts, and Actions: Evidence from Venture Capitalist Analyses. The Journal of Finance, 59(5), 2177–2190. https://doi.org/10.1111/j.1540-6261.2004.00696.x
Kaufmann, D., Kraay, A., & Mastruzzi, M. (2010). Governance Matters VIII: Aggregate and Individual Governance Indicators, 1996–2008, World Bank Policy Research Working Paper 4978.
Kohei, D., & Tabata, K. (2013). Public Infrastructure, Production Organization and Economic Development. Journal of Macroeconomics, 38 (B), 330-346.
Kortum, S., & Lerner, J. (2000). Assessing the Contribution of Venture Capital to Innovation. The Rand Journal ofEconomics, 31 (4), 674-692. https://doi.org/10.2307/2696354
Leyden, D. P., & Link, A. N. (1991). Why are Government and Private R&D Complements?. Applied Economics, 23, 1673– 1681. https://doi.org/10.1080/00036849100000132
Megginson, W. (2004). Toward a Global Model of Venture Capital?. Accenture Journal of Applied Corporate Finance, 16(1),. 7–26. https://doi.org/10.1111/j.1745-6622.2004.tb00599.x
Mondher, C., & Kaouthar, G. (2011). What Drives Venture Capital Investments in Europe? New Results from a Panel Data Analysis. Journal of Applied Business and Economics, 12(3), 122–139.
Morrison, C. J., & Schwartz, A.E. (1996). State Infrastructure and Productive Performance. The American EconomicReview, 86 (5), 1095–1111.
Moed, H., Burger, W., Frankfort, J., & Raan, A. (1985). The Use of Bibliometric Data for the Measurement of University Research Performance. Research Policy, 14, 131–149. https://doi.org/10.1016/0048-7333(85)90012-5
Nahata, R. (2008). Venture Capital Reputation and Investment Performance., Journal of Financial Economics, 90 (2), 127– 151. https://doi.org/10.1016/j.jfineco.2007.11.008
Nelson, R. R. (1959). The Simple Economics of Basic Scientific Research. The Journal of Political Economy, 67, 297–306. https://doi.org/10.1086/258177
Popov, A., & Roosenboom, P. (2013). Venture Capital and New Business Creation. Journal of Banking and Finance, 37, 4965–4710. https://doi.org/10.1016/j.jbankfin.2013.08.010
Robson, M. (1993). Federal Funding and the Level of Private Expenditure on Basic Research. Southern EconomicJournal, 60, 63–71. https://doi.org/10.2307/1059931
Romain, A., & de La Potterie, B. (2004). The Determinants of Venture Capital: A Panel Data Analysis of 16 OECD Countries. Centre Emile Bernheim, Research Institute in Management Science Working Paper No. 04/015.
Roodman, D. (2009). How to do Xtabond2: An introduction to Difference and System GMM in Stata. The Stata Journal, 9 (1), 86–136.
Sahaym, A., Steensma, H., Q., & Bardeen, J. (2010). The Influence of R&D Investment on the Use of Corporate Venture Capital: An Industry-Level Analysis. Journal of Business Venturing, 25, 376–388. https://doi.org/10.1016/ j.jbusvent.2008.12.001
Schertler, A., & Tykvova, T. (2011). Venture Capital and Internationalization. International Business Review, 20 (4), 423– 439. https://doi.org/10.1016/j.ibusrev.2010.07.009
Schertler, A., & Tykvova, T. (2012). What Lures Cross-Border Venture Capital Inflows?. Journal of International Moneyand Finance, 31 (6), 1777–1799. https://doi.org/10.1016/j.jimonfin.2012.03.012
SERI. (2013). News on Swiss Science, Technology, Education and Innovation. State Secretariat for Education, Research and Innovation, Taken January 23th of 2015 from http://www.swissinnovation.org/Science-Switzerland_FebMar_2013.pdf Schumpeter, J. (1934). The Theory of Economic Development. Cambridge (Mass.): Harvard University Press, 1st edn. 1912. Toole, A. A. (2007). Does Public Scientific Research Complement Private Investment in Research and Development in the
Pharmaceutical Industry?. Journal of Law and Economics, 50, 81–104. https://doi.org/10.1086/508314
Wallsten, S. J. (1999). Do Government-Industry R&D Programs Increase Private R&D?: The Case of the Small Business Innovation Research Program. Department of Economics Working Paper, Stanford Univewrsity.
WEF. (2014). Top 10 Most Competitive Economies Europe. World Economic Forum. Taken January 23th of 2015 from: http://www.weforum.org/content/top-10-most-competitive-economies-europe-2.