Primož DOLENC* Preliminary communication** University of Primorska, Faculty for Management Koper UDK 338.22(497.4)
Ministry of Finance, The Treasury, Ljubljana JEL O40
Milan VODOPIVEC*
University of Primorska, Faculty for Management, Koper The World Bank, Washington D.C.
Abstract
Income transfers may generate work disincentives: if certain income payments are stopped when individuals (re)enter employment, this creates disincentives for taking em-ployment – so called “unemem-ployment trap”. To make work pay, several countries have introduced policies – financial incentives – which enhance employment opportunities for marginal groups in the labor market. Such policies increase in-work incomes and so improve work incentives for those receiving only out-of-work incomes. This paper tries to shed light on two questions, first being how does “making work pay” work in Slov-enia, compared OECD countries, and the second, should Slovenia introduce earnings supplements or other in-work arrangements in tackling possible unemployment trap. According to international comparison Slovenia does not “step-out”, when we look at net replacement rates. Slovenia, however, has not introduced a single active labor pro-grams that would stimulate directly and financially unemployed to join (official) em-ployment, even though a lower paid job. In the paper we suggest the implementation of some kind of in-work arrangement at least for those, who are potentially less stimu-lated to reemploy.
Key words: economic policy, financial incentives to work, Slovenia, EU, OECD.
* The autors would like to thank the anonymus reviewers, for their constructive advice and comments they helped the paper to achieve a better protiling.
** Received: June 15, 2005.
1 Introduction
Income transfers may generate work disincentives: if certain income payments are stopped when individuals (re)enter employment, this creates disincentives for taking a job. This is the so called “unemployment trap.” According to OECD (2004a), such disincen-tives are indeed present for many persons with low potential wages, particularly if they have children or are second earners in the family.1 While non-employment benefits (such as benefits from unemployment insurance or assistance) need to ensure income adequate consumption smoothing, setting such benefits at a too high level may trap families in a cycle of dependency, as taking a job brings little or no extra income. Another consequence of high non-employment benefits is an upward pressure on wages.
A tax burden on labor is also an important factor as it is of the most direct ways to influence the poverty and unemployment rate. When taxes on labor are introduced the tax wedge between labor costs paid by employer (gross wage) and net wage received by employee appears. According to OECD (2004b) tax wedge on labor is the difference be-tween what employers pay out in wages and social security charges and what employees take home after tax, taken into account also social security deductions and cash benefits. OECD and IMF studies have shown that higher taxes on labor, including unemployment benefit contributions, significantly increase unemployment (see OECD, 2004 and IMF, 2003). The problem is indeed relevant for Slovenia – data shows that Slovenia has one of the highest tax burden on labor in EU, immediately after Belgium and Germany, respect-fully (Dolenc and Vodopivec, 2005).
To make work pay, several countries have introduced policies – financial incentives – which enhance employment opportunities for marginal groups in the labor market. These policies are aimed to increase in-work incomes and improve work incentives for those re-ceiving only out-of-work incomes. In the European Employment Strategy ‘making work pay’ policies are a key issue for reducing benefit dependency and increasing labor market participation (De Lathouwer, 2004).
European Commission reports that many EU member states are committed to improve the combined impact of taxes and benefits on employment and their link with activation. There is also a more visible commitment to tackle the issue of working poor through in-work benefits and rises in minimum wages. Improving in-work incentives in benefit sys-tems, including eligibility rules and related financial incentives are, however, less force-fully addressed (for details see European Commission, 2005).
This paper is a result of a preliminary study on the subject and as such tries to shed light on the following questions: 1. How does “making work pay” work in Slovenia, com-pared OECD countries? 2. What are possible solutions of an eventual unemployment trap problem in Slovenia?
The main findings of the paper are as follows. According to international comparison Slovenia does not “step-out”, when we look at financial incentives to return to employ-ment. In tackling possible unemployment trap some OECD and EU countries have intro-duced earnings supplements to attract unemployed to re-activate; several policy measures
are possible, all having their advantages and disadvantages. Slovenia, however, has not introduced a single active labor programs that would stimulate directly and financially unemployed to join (official) employment, even though a lower paid job. The problem is especially evident for some groups of unemployed (those who have children, etc.).
The paper is organized as follows. In the second chapter we present methodology and data sources. The third and fourth chapter deals with the subject in OECD area, whereas fifth and sixth chapter is concentrated on Slovenia and the comparison of Slovenian case with OECD examples. We then sum up and suggest some basic policy measures. 2 Methodology and data sources
2.1 Methodology
There are two possible (yet alternative) indicators, how to measure financial effect of re-employment or efficiency of “making work pay”. One – used e.g. by Immervoll and O’Donoghue (2003) or Vodopivec (1998) – is so called net replacement rate (NRR). NRR
is defined as ratio of net income while out of work (ynetA) divided by net income while in work (ynetB), so:
NRR y
y netA
netB
. (1)
If net replacement rate exceeds 100%, the unemployed person is not expected (at least not on short-term basis) to be encouraged to move from unemployment, because in-work earnings are smaller than out-of-work incomes or (alternatively) when moving to unem-ployment the incomes would increase and not (as usually) decrease.
Carone, Salomäki, Immervoll and Paturot (2003) for this purpose suggest an alter-native indicator, marginal effective tax rate (METR). The concept of METR is not new, though; it was already mentioned in 1978 (see Meade, 1978) and later-on additionally ex-plained by Brandford and Fullerton (1981).
There are three different METRs, but with respect to unemployment trap, we con-sider marginal effective tax rate for unemployed person (METRUT). The parameter aims
to measure the short-term financial incentives to move from unemployment (where out-of-work incomes are received) into paid employment and is defined as the rate at which taxes increase and benefits (mainly unemployment insurance benefits) decrease as an un-employed person takes up a job. The level of METRUT is subject to different family types
and earnings before and after re-employment. Formally METRUTis computed as:2
METR y
y
UT net
gross
1 Δ
Δ . (2)
2 Δy
gross are the additional pre-tax earnings when moving from unemployment and Δynet is the change in net income obtained after taxes and benefits. The change in gross earnings between labor market status A (unemployed – ygrossB) and B (employed – ygrossB) is ΔygrossygrossBygrossAand the net earnings change is
The parameter quantifies to what extent the tax-benefit system contributes to the un-employment trap in cases where unemployed person receives out-of-work incomes.
Although net replacement rate and marginal effective tax rate are connected with clear relationship (for details see OECD, 1998), there is a major conceptual difference between the two measures: METR is for the people that move from unemployment (having some earlier earnings that could determine unemployment benefits) to employment and NRR is used vice versa (from employment to unemployment).
2.2 Data sources
The analysis was based on two sources of data:
• For international comparison of NRR and METRUT we used data from on-going joint
European Commission/OECD project, aimed at monitoring the direct influence of tax and benefit instruments on household incomes. The data for year 2001 is pre-sented by Carone et al. (2003).
• For calculations of METR and NRR in Slovenia the official government data on av-erage, minimum and guaranteed wage and levels of unemployment and social as-sistance was used. The data was collected for the year 2004.
3 Overview of data – net replacement and marginal effective tax rates in OECD countries
In most OECD countries unemployed persons receive (at least at the beginning of their unemployment) unemployment insurance benefits and – after the eligibility for unemployment insurance benefit expires3 – usually also unemployment assistance ben-efits. If they move from unemployment, they have some opportunity costs: they usually lose these benefits, they have to pay transportation costs, they receive wage – because those people are usually those with little work experience and/or low skills, they com-monly receive minimum wage – but they have to pay personal income taxes, social se-curity contributions etc. Therefore not all are unconditionally prepared to take the job (if available). The problem is especially evident for those who had high wage before unemployment (relatively to the offered wage, if moved from unemployment) because they usually receive relatively high unemployment insurance benefits. The level of net replacement rate and marginal effective tax rate for unemployed person is of course subject to different parameters: different family types and earnings before and after re-employment etc.
European and OECD countries have different tax systems and cope differently with unemployment. They also have different views on “making work pay” policy. However, some common conclusions could be drawn from results of joint European Commission/ OECD project. These results (marginal effective tax rates for unemployed persons and net replacements rates) are presented in tables 1,2 and 3 and figures 1,2 and 3 (different types of families and employment levels after reemployment are taken into consideration).
How to explain METRUT? METRUT, close to – say – 90% means that short-term net
fi-nancial reward for taking up a job is only 10% of gross earnings. If we look at numbers in table 1 and 2, METRUT is higher on average (at a certain level of previous work wage) if
re-employment wage level is lower. This is logical. In most countries out-of-work incomes4 depend on previous wages. Unemployed with high previous wage usually receive a high-er benefit, which makes re-employment less attractive, especially if offhigh-ered low wage em-ployment. Of course, family type plays an important role, too (see figure 1b and 2b).
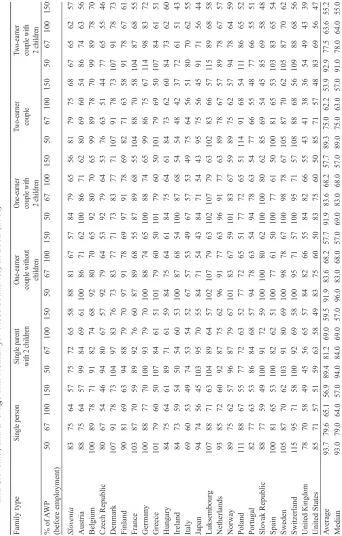
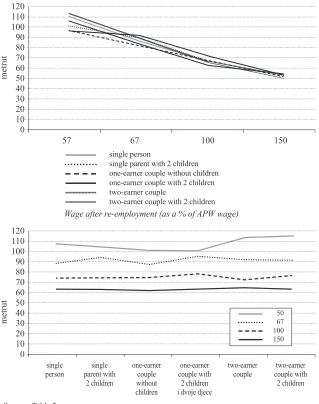
Figure 1a and 1b Median unemployment trap indicator (METRUT) for an unemployed person with previous work wage level of 67% of APW wage with respect to different family types and levels of wage after re-employment in 2002 (in %)
100 90 80 70 60 50 40 30 20 10 0
single single one-earner one-earner two-earner two-earner person parent with couple couple with couple couple with
2 children without 2 children 2 children children i dvoje djece
metrut
50 67 100 150 100
90 80 70 60 50 40 30 20 10 0
57 67 100 150
single person
single parent with 2 children one-earner couple without children one-earner couple with 2 children two-earner couple
two-earner couple with 2 children
metrut
Source: Table 1
Family type
Single person
Single parent with 2 children
One-earner
couple without
children
One-earner couple with 2 children
Tw
o-earner couple
Tw
o-earner
couple with 2 children
% of A W P (before employment) 50 67 100 150 50 67 100 150 50 67 100 150 50 67 100 150 50 67 100 150 50 67 100 150 Slovenia 83 75 64 57 75 72 65 58 88 81 67 57 84 79 65 56 81 79 75 68 67 65 62 57 Austria 88 75 64 57 99 84 69 61 100 86 71 62 100 86 71 62 80 69 60 54 86 74 63 56 Belgium 100 89 78 71 91 82 74 68 92 80 70 65 92 80 70 65 99 89 78 70 99 89 78 70 Czech Republic 80 67 54 46 94 80 67 57 92 79 64 53 92 79 64 53 76 63 51 44 77 65 55 46 Denmark 107 91 78 73 104 97 83 76 73 83 77 71 73 83 77 71 107 91 78 73 107 91 78 73 Finland 90 81 69 63 94 88 79 70 97 91 78 69 97 91 78 69 82 71 63 58 91 78 67 61 France 103 87 70 59 89 92 76 60 87 89 68 55 87 89 68 55 104 88 70 58 104 87 68 55 Germany 100 88 77 70 100 93 79 70 100 88 74 65 100 88 74 65 99 86 75 67 1 1 4 9 8 8 3 7 2 Greece 101 79 60 50 107 84 61 51 101 79 60 50 101 79 60 50 101 79 69 50 107 84 61 51 Hungary 84 75 64 61 89 71 61 59 84 75 64 61 84 75 64 61 84 73 62 60 84 73 62 60 Ireland 84 73 59 54 50 54 60 53 100 87 68 54 100 87 68 54 54 48 42 37 72 61 51 43 Italy 69 60 53 49 74 53 54 52 67 57 53 49 67 57 53 49 75 64 56 51 80 70 62 55 Japan 94 74 56 45 103 95 70 55 84 71 54 43 84 71 54 43 95 75 56 45 91 71 56 44 Luksembour g 107 88 71 63 104 89 64 57 102 107 79 63 102 107 79 63 102 83 66 57 1 1 5 8 9 6 8 5 8 Netherlands 93 85 72 60 92 87 75 62 96 91 77 63 96 91 77 63 89 78 67 57 89 78 67 57 Norway 89 75 62 57 96 87 79 67 101 83 67 59 101 83 67 59 89 75 62 57 94 78 64 59 Poland 1 1 1 88 67 55 77 72 63 52 77 72 65 51 77 72 65 51 1 1 4 9 1 6 8 5 4 1 1 1 86 65 52 Portugal 82 77 63 53 86 84 68 57 94 78 63 54 94 78 63 54 77 66 55 48 77 66 55 51 Slov ak Republic 88 77 59 49 100 91 72 59 100 100 80 62 100 100 80 62 85 69 54 45 85 69 58 48 Spain 100 81 65 53 100 82 62 51 100 77 61 50 100 77 61 50 100 81 65 53 103 83 65 54 Sweden 105 87 70 62 103 91 80 69 100 98 78 67 100 98 78 67 105 87 70 62 105 87 70 62 Switzerland 1 1 5 9 5 7 1 5 8 100 92 69 58 100 95 71 57 100 95 71 57 108 88 68 56 109 88 68 56 United Kingdom 78 70 58 49 45 56 65 57 84 82 66 55 84 82 66 55 43 41 38 36 54 49 43 39 United States 85 71 57 51 59 63 58 49 83 75 60 50 83 75 60 50 85 71 57 48 83 69 56 47 A verage 93.7 79.6 65.1 56.9 89.4 81.2 69.0 59.5 91.9 83.6 68.2 57.7 91.9 83.6 68.2 57.7 89.3 75.0 62.2 53.9 92.9 77.5 63.6 55.2 Median 93.0 79.0 64.0 57.0 94.0 84.0 69.0 57.0 96.0 83.0 68.0 57.0 69.0 83.0 68.0 57.0 89.0 75.0 63.0 57.0 91.0 78.0 64.0 55.0 T able 1 Mar
ginal effective tax rate for unemployed person with pr
evious work wage level of 67% of average pr
oduction worker
(APW) wage with r
espect to differ
ent family types and levels of wage after r
e-employment (in differ
ent EU/OECD countries
and Slovenia, and average and median for those countries) in 2002 (in %)
Sour
ce: Car
There are some countries and some wage/family type combinations, where METRUT
jumps over 100%. Here the unemployed (at least on short-term basis and taken in mind only financial and not “personal” (personal pride, feeling of social importance…) effects) is not stimulated to take a job.
Figure 2a and 2b Median unemployment trap indicator (METRUT) for an unemployed person with previous work wage level of 100% of APW wage with respect to different family types and levels of wage after re-employment in 2002 (in %)
120 110 100 90 80 70 60 50 40 30 20 10 0
57 67 100 150
single person
single parent with 2 children one-earner couple without children one-earner couple with 2 children two-earner couple
two-earner couple with 2 children
single single one-earner one-earner two-earner two-earner person parent with couple couple with couple couple with
2 children without 2 children 2 children children i dvoje djece
120 110 100 90 80 70 60 50 40 30 20 10 0
50 67 100 150
metrut
metrut
Source: Table 2
Family type
Single person
Single parent with 2 children
One-earner
couple without
children
One-earner couple with 2 children
Tw
o-earner couple
Tw
o-earner
couple with 2 children
% of A W P (after re-employment) 50 67 100 150 50 67 100 150 50 67 100 150 50 67 100 150 50 67 100 150 50 67 100 150 Slovenia 97 85 72 62 86 81 72 62 98 89 72 60 90 86 74 62 97 93 85 75 80 77 72 64 Austrija 96 81 68 60 106 89 73 63 100 86 71 62 100 97 78 67 101 85 70 61 107 89 73 63 Belgium 100 89 78 71 91 82 74 68 92 80 71 65 87 76 68 64 99 89 78 70 99 89 78 70 Czech Republic 97 80 62 52 94 80 68 57 95 81 66 54 100 96 77 63 100 81 63 52 97 80 65 53 Denmark 106 91 78 73 104 97 83 76 73 83 77 71 76 87 82 75 107 91 78 73 106 91 78 73 Finland 99 88 73 66 104 95 84 73 99 92 79 69 100 99 89 76 99 84 71 64 106 89 75 66 France 121 100 79 65 101 100 82 63 100 99 74 60 89 92 81 62 120 100 78 63 122 100 77 61 Germany 101 88 77 70 1 1 5 104 87 75 100 88 74 65 1 1 5 9 6 8 2 7 0 1 18 101 85 74 138 1 1 6 9 5 8 0 Greece 1 1 2 8 8 6 6 5 4 126 98 71 57 120 94 70 56 126 98 71 57 1 1 2 8 8 6 6 5 4 126 98 71 57 Hungary 84 75 64 61 89 71 61 59 84 75 64 61 89 71 61 59 84 73 62 60 84 73 62 60 Ireland 87 73 59 54 51 54 60 53 100 87 68 54 95 87 72 57 54 48 42 37 72 61 51 43 Italy 92 77 65 56 100 73 67 61 93 76 67 58 104 73 66 62 92 77 65 56 95 81 70 60 Japan 1 1 6 9 1 6 7 5 2 9 2 8 8 6 5 5 2 106 88 65 50 84 86 71 56 1 1 7 9 2 6 8 5 2 1 13 87 67 52 Luksembour g 1 14 1 1 5 8 9 7 5 154 126 89 73 1 1 8 1 19 87 69 1 1 3 1 12 89 68 139 1 1 1 85 69 155 1 1 9 8 8 7 1 Netherlands 1 1 0 9 8 8 1 6 5 104 97 81 66 102 96 81 65 102 96 82 66 1 1 5 9 7 8 0 6 5 1 15 97 80 65 Norway 1 1 7 9 5 7 6 6 7 1 13 99 88 73 1 1 7 9 5 7 6 6 5 109 99 78 66 1 1 7 9 5 7 6 6 7 122 99 78 68 Poland 141 1 1 0 8 1 6 5 107 94 78 62 107 94 80 61 67 64 63 60 1 1 4 1 13 83 64 141 108 80 62 Portugal 92 77 63 54 86 84 68 57 94 78 63 54 100 91 80 65 77 66 55 48 77 66 55 51 Slov ak Republic 1 1 1 95 71 57 101 92 73 59 100 100 80 62 100 100 96 72 1 1 8 9 4 7 1 5 6 1 18 94 75 59 Spain 129 103 79 63 138 1 1 0 8 1 6 4 135 103 78 62 139 1 1 1 80 63 129 103 79 63 140 1 1 1 84 66 Sweden 134 109 85 72 123 106 90 76 1 1 4 109 85 72 104 103 86 73 134 109 85 72 134 109 85 72 Switzerland 143 1 1 3 8 4 6 7 145 126 92 71 124 1 1 3 8 4 6 5 134 125 92 70 134 107 81 65 150 1 1 8 8 9 7 0 United Kingdom 78 70 68 49 45 56 65 57 84 82 66 55 66 72 74 62 43 41 38 36 54 49 43 39 United States 108 88 69 59 68 70 63 52 100 88 69 57 68 69 64 53 108 88 69 56 108 87 68 55 A verage 109.5 90.9 73.0 62.0 102.4 90.9 75.6 63.7 102.5 91.5 73.5 61.3 98.5 91.3 77.5 64.5 106.9 88.2 70.7 59.9 112.1 91.8 73.3 61.6 Median 107.6 88.8 73.4 63.1 103.5 93.8 74.0 63.1 100.0 88.3 73.9 61.7 100.0 95.5 78.2 63.6 112.0 91.2 70.7 63.1 112.8 91.2 74.9 61.5 T able 2 Mar
ginal effective tax rate for unemployed person with pr
evious work wage level of 100% of average pr
oduction worker
(APW) wage with r
espect to differ
ent family types and levels of wage after r
e-employment (in differ
ent EU/OECD countries
and Slovenia, and average and median for those countries) in 2002 (in %)
Sour
ce: Car
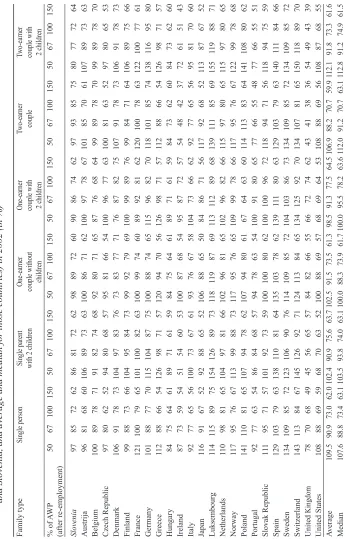
Similar conclusions as for marginal effective tax rates for unemployed persons can be drawn also for net replacement rates (table 3 and figure 3). On average and irrespectively the family type, net replacement rate is smaller for those with higher pre-unemployment wage; when moved to unemployment those with lowest pre-unemployment wage lose least (financially). On average (all countries and family type average) those with pre-unemploy-ment wage at the level of 50% lose 10% of previous income, whereas those with pre-un-employment wage at the level of 150% lose almost 40% of previous income. Although paradoxically in some countries for some family types net replacement rate is more than 100%, which means that with loosing work people actually get higher incomes.
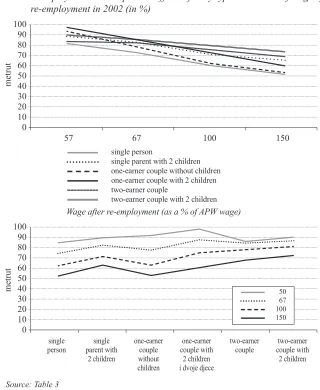
Figure 3a and 3b Median net replacement rates for unemployed persons moving to unemployment with respect to different family types and levels of wage after re-employment in 2002 (in %)
100 90 80 70 60 50 40 30 20 10 0
57 67 100 150
single person
single parent with 2 children one-earner couple without children one-earner couple with 2 children two-earner couple
two-earner couple with 2 children
metrut
100 90 80 70 60 50 40 30 20 10 0
single single one-earner one-earner two-earner two-earner person parent with couple couple with couple couple with
2 children without 2 children 2 children children i dvoje djece
50 67 100 150
metrut
Source: Table 3
Family type
Single person
Single parent with 2 children
One-earner
couple without
children
One-earner couple with 2 children
Tw
o-earner couple
Tw
o-earner
couple with 2 children
% of APW (after re-employment) 50 67 100 150 50 67 100 150 50 67 100 150 50 67 100 150 50 67 100 150 50 67 100 150 Slovenia 98,1 86 72,8 62,5 86,8 81,8 72 62,1 98,5 89,9 72,5 60,5 90,5 86,5 74,4 62,4 98,2 93,7 85,4 75,3 81,3 77,8 71,9 64 Austrija 85 68 55 55 100 84 70 64 100 82 60 56 100 97 76 66 82 80 76 72 88 86 81 76 Belgium 82 83 63 46 84 79 63 48 81 73 55 41 80 74 58 45 95 91 78 63 96 92 80 67 Czech Republic 63 57 51 50 95 80 63 58 92 75 57 52 100 96 75 59 80 77 72 67 84 80 75 70 Denmark 92 85 60 45 94 96 76 61 71 86 63 47 71 84 75 58 96 93 77 64 96 93 78 66 Finland 83 74 61 48 92 89 82 67 97 88 69 54 100 99 85 65 84 81 75 66 90 86 80 70 France 94 83 71 70 86 92 78 70 82 87 67 69 79 85 78 69 96 92 82 79 96 92 83 79 Germany 100 81 61 62 100 92 82 78 100 85 63 51 100 84 78 70 93 90 85 80 98 99 96 91 Greece 101 76 58 58 108 81 66 65 101 76 63 63 108 81 66 65 101 88 75 72 103 91 80 76 Hungary 64 65 47 35 76 73 58 46 64 65 47 35 76 73 57 46 83 81 68 57 87 85 73 63 Ireland 87 69 50 38 70 65 59 45 1 1 3 8 7 6 4 4 5 9 7 9 0 7 2 5 3 7 9 7 1 5 9 4 7 8 8 8 0 6 8 5 5 Italy 47 50 52 39 55 54 60 49 48 50 56 43 58 57 62 52 79 77 71 59 83 81 76 62 Japan 74 70 60 60 88 83 60 60 83 67 59 58 89 87 68 59 90 86 77 73 88 84 78 73 Luksembour g 7 8 8 5 8 5 8 7 9 0 9 0 8 9 9 2 1 10 108 84 85 1 1 8 1 16 89 89 91 90 89 88 95 94 92 91 Netherlands 91 80 71 61 93 87 77 66 96 89 73 63 95 89 77 65 85 85 83 74 86 86 84 75 Norway 94 66 66 53 92 89 86 68 93 78 67 53 100 91 74 59 86 83 80 69 90 87 83 72 Poland 1 1 2 8 6 7 8 8 3 8 3 7 5 7 6 8 0 8 1 7 3 7 6 7 9 7 5 6 9 6 6 7 8 107 95 88 88 105 92 87 87 Portugal 89 68 47 32 85 80 56 38 92 70 48 33 100 90 73 51 86 76 62 48 87 77 63 50 Slov ak Republic 79 72 64 47 100 92 72 56 100 100 75 52 100 100 96 69 84 81 78 64 86 84 83 69 Spain 77 78 74 52 84 81 79 66 75 76 75 53 84 81 78 66 90 89 85 68 94 90 89 78 Sweden 97 82 78 56 90 92 89 69 100 98 78 56 100 100 82 61 91 91 87 71 92 92 88 72 Switzerland 100 90 80 81 100 92 91 91 100 94 80 80 100 100 91 91 93 92 86 84 94 93 92 91 United Kingdom 76 64 45 31 66 65 62 46 84 78 56 39 78 76 71 53 71 63 53 42 79 72 60 49 United States 68 63 58 42 60 64 56 40 69 70 60 41 66 65 59 42 84 81 75 59 85 83 78 63 A verage 84.0 73.7 62.4 53.5 86.6 81.5 71.7 61.9 88.3 80.7 65.0 54.3 90.2 86.3 74.2 62.2 88.1 84.0 76.6 67.6 90.9 86.9 80.3 71.5 Median 85.0 74.0 61.0 52.0 90.0 83.0 72.0 64.0 92.0 78.0 63.0 53.0 97.0 87.0 75.0 61.0 86.0 85.0 77.0 68.0 90.0 86.0 80.0 72.0 Table 3 N et r
eplacement rates for employed persons moving to unemployment with r
espect to differ
ent family types and levels of wage
befor
e unemployment (in differ
ent EU/OECD countries and Slovenia, and average and median for those countries) in 2002 (in %)
Sour
ce: Car
It should be noted, however, that these figures are calculated on the first month of un-employment, therefore these figures should be viewed with caution. Carone et al. (2004) warn that computed figures represent only “upper-bound” as in many countries unem-ployment insurance benefits and/or unemunem-ployment/social assistance benefits are reduced or abolished over time. But still, if we take an example of currently unemployed person with previous wage level at 100% of APW wage and if he/she takes a comparable job (as before unemployment), he/she is effectively taxed away on average between 20-30% (different levels are because of different family types). Financial effect of taking full-time job is not significant; therefore some other mechanisms to attract reemployment should be taken into consideration.
4 Experience of OECD countries with “making-work-pay” policies
Why are policies to “make work pay” important in any country? On our opinion are such policies an effective tool to reduce unemployment in the economy with relatively low financial stake for the budget. Other policy measures aimed to lower unemployment might not be so effective. For example, empirical studies that tried to shed light on effects of tax reduction on general unemployment level in the economy came up with mixed re-sults. Daveri’s cross country analysis (2001) showed that unemployment is not neces-sary high/low in countries in countries where labor tax rates are high/low. Further, with-in-country time correlation between labor taxes and unemployment is stronger for some countries (such as Germany, France, Spain, Italy) than for others (the US and UK). Sim-ilar was reported by Turvainen (1994): in the US and UK real wage resistance is low, so that taxes do not significantly affect labor costs and thus unemployment. Furthermore, Calmfors and Nymoen (1990) find only short-run impact of the tax wedge on wages in Denmark, Sweden and Norway, while Eriksson et al. (1990) find only weak long-run link between the tax wedge and wages for Finland. Prescott (2004) found that by reducing the effective marginal tax rate on labor and moving toward retirement systems with the prop-erty that benefits on margin increase proportionally to contributions. On the other hand Dolando et al. (1986), and Browne and McGettigan (1993) find that rise in tax wedge ex-plains to some extent the increase in unemployment respectively for Spain and Ireland. In addition Andersen and Risager (1990) find significant effect of payroll taxes on wages in Denmark while Noghadam (1994) argues that a reduction in employers’ payroll taxes in France will reduce unemployment.
This is pointed out also by Phelps (2000) who argues that there are potentially im-portant social and economic externalities associated with having a full-time job. A job is often good for individuals in terms of physical and mental health; raising self-esteem and well-being by making them feel more included in society. Bringing hitherto marginal-ized groups of society, including those who are active in undeclared working sphere into mainstream economic activities may generate beneficial outcomes for society as a whole. However, Pearson and Scarpetta (2000) find it is hard to find quantitative evidence of such effects and interpret them.
In spite of this fact, some empirical results are still applicable. Tax credit was in-troduced – for example – in the United States as The Earned-Income Tax Credit (EITC) scheme and in the United Kingdom as The Working Families Tax Credit (WFTC). Under this program families with low-paid earner(s) and children can benefit from the credit so that marginal and average effective tax rates fell significantly, therefore their incentive to re-employ is higher. Hotz and Scholz (2000) found evidence that earned income tax credit in the United States promotes employment. Dilnot and McGrae (2000) made simulations for United Kingdom – they suggest that the expansion of the “make work pay” program will promote employment (10.000 to 100.000 people could find work). Similar results were found by Greenwood and Voyer (2000), and Fitoussi (2000) who estimated effects of “make work pay” policies for Canada and France, respectfully.
Complementary social benefits to work were introduced – for example – in Belgium (see De Lathouwer, 2004) as an answer to the necessity for the unemployed to gain work experience and the need to provide greater financial incentives to unemployed. The un-employed person who has taken up a low paid job (maybe also part-time job) receives unemployment benefit (direct cash transfer) as a wage subsidy. The system has proven to be very successful in Belgium because it attracted many unemployed to take a low paid and/or part-time job, for which they otherwise would not be interested. This is usually only one step into highly paid and/or full-time job.
of unemployed to leave existing long-term employment relationships for new risky jobs for which they would receive a supplement for only a temporary period of time or dif-ficulty in finding jobs.
Earnings supplements are used also in the United States, but here the instrument is combined with negative marginal tax rate or a marginal subsidy rate. The program pro-vides strong work incentives for very low-wage or low-earnings workers. For them a sup-plement is added to their total earnings, and each additional dollar earned is supsup-plemented as well. For workers above the maximum supplement point but below the poverty line, a supplement is also added to total earnings, but marginal earnings are subject to a tax rate (Haveman, 1996). Scholz (1995) estimated that the aggregate increase in hours generated by increased labor force participation was roughly 74 million hours yearly.
Another policy measure to create greater financial incentives for the unemployed and to make work more financial attractive in general are reductions of employee’s social con-tributions or personal income tax reduction. In France low paid are entitled to exemp-tion from family contribuexemp-tions and reducexemp-tion of social security contribuexemp-tion (Pearson and Scarpetta, 2000). The rebate is proportional to the number of hours worked (so as not to unduly favor part-time job) and applicable for up to 1,3 times the minimum wage. Other tax exemptions are targeted to specific groups, including exemptions for part-time work, first-hires and youth employment, and exemptions related to skill training contracts and apprentices. Even high short-term financial cost of such program (0.6% of GDP) Malin-vaud’s simulation showed that in the long run this exemptions will contribute to the crea-tion of about 350 000 jobs (Malinvaud, 1998 and Fitoussi, 2000)
5 Financial re-employment incentives in Slovenia – a descriptive analysis
In Slovenia the law gives unemployed workers the right to unemployment compen-sation, unemployment assistance, training and health and old-age insurance. Besides that needy individuals are eligible to social assistance programs. Characteristics of unemploy-ment insurance and social assistance programs are listed in Table 4.
Table 5 shows net replacement rates in Slovenia for different family types and levels of wage before unemployment.5 Regarding the fact that unemployed are entitled to unem-ployment compensation at a level of 70% and 60% of wage before unemunem-ployment in first 3 months and after first 3 months, respectively, net replacement rates suit these figures. In most cases, net replacement rates are not far from 70% and 60%; the difference appears because we presumed that taxpayers try to take most of possible tax deductions.6 Those, however, who maintain their children and/or spouse, lose significantly less; net replace-ment rate is more than 90%. This is because the tax reduction is quite substantial in these cases. This fact is consistent with results reported by Vodopivec (1998). He stresses that for families with two of more children where both parents are unemployed, the effective tax rate on the employment of one of the parents – if the parent is a minimum-wage earn-er – is 100%. Undearn-er those circumstances employment of the parents has no effect on the disposable income of the family.
Table 4 Unemployment and social assistance benefits in Slovenia
Unemployment insurance Social assistance Unemployment compensation Unemployment
assistance
Social assistance in casha
Eligibility Several conditions:
• minimum contribution period of 9 months (for uninterrupted service) or 12 months (for interrupted service).
• the person must register as unemployed within 30 days of the date of termination of employment.
• the reason for termination of employment is either layoff or bankruptcy (quitters are thus disqualified).
Income-tested. If actual income per family member is below the threshold of 80 percent of the guaranteed wage.
Income-tested. The threshold income is, in terms of guaranteed wage,
• 100% for the first adult in the family, • 70% for second and other adults in the family, • 30% for a school-attending child below 18. Property considered on ad-hoc basis by reducing the entitlement as calculated from incomes. Other provisions:
• for unemployed, registration at employment office required;
• benefit can be conditioned by a contract specifying the actions to be taken by the recipient (such as health treatment, participation in public works).
Exceptions are permissible, at the discretion of the center for social work.
Benefit level
70 percent in the first three months, 60 percent thereafter, of the average monthly wage in the last three months of employment.
80 percent of the guaranteed wage.
Difference between the income threshold and the income of the family (the sum of income of all family members plus assessed incomes from property). Payable monthly in cash, except in special circumstances when converted to coupons or reimbursement of bills.
Additional benefits
Participation in training, public works
Pension and health insurance
Participation in training, public works Pension and health insurance
Housing subsidy, if recipient rents an apartment.
Duration of benefit
3 to 24 months, depending on years of service.
Extendable for up to 3 years for people before pension able age. After employment of nine months, original terms for duration apply if the person reenters unemployment.
Maximum of 6 months.
Maximum of 6 months. Renewable.
Conditions for taking away the benefit after being awarded
If turning down a job offer, training or other active labor market programs.
Maximum duration shortened for the period when casual earnings above 160 percent of the guaranteed wage.
Same as for unemployment compensation.
Not clear. Recipient must report changes of relevant circumstances
a Social assistance as a supplementary source of income. There is also social assistance as the
sole source of income, restricted to persons permanently unable to work and those above 60 without other income sources.
Table 5 Net replacement rates for employed persons moving to unemployment with respect to different family types and levels of wage before unemployment, Slovenia in 2004 (in %) a
Type of household/family
Single adult without children
Single-parent family with 2 children
One-earner family with 2 childrenb
Two-earner family with 2 childrenb, c
A. Net replacement rates during the first 3 months of unemployment
Minimum-wage earners 71 93 94 73
Average-wage earners 73 72 72 72
B. Net replacement rates during unemployment compensation after the first 3 months
Minimum-wage earners 62 91 93 67
Average-wage earners 63 63 64 62
C. Net replacement rates during unemployment assistance
Minimum-wage earners 44 37 30 42
Average-wage earners 20 18 18 19
D. Net replacement rates during social assistance
Minimum-wage earners 45 72 81 56
Average-wage earners 20 36 48 25
Notes:
a Net replacement rate is defined as the percent of net benefits received when breadwinners are
unemployed, of wages earned when breadwinners work (“net” refers to disposable income – paid after taxes and contributions). It is assumed that all possible tax deductions are reported (general tax dedu-ction at the level of 3% of tax base).
b Both children are assumed to be between 15 and 18 years old.
c Each adult “reports” one child as a tax deduction.
Source: Table 3, own calculations.
When the eligibility to receive unemployment compensation expires (or for those who were not applicable at all), the net replacement rate is significantly lower; about 38% and 64% for minimum-wage earners eligible to unemployment assistance and social se-curity, respectively. Average-wage earners these net replacement rates are even lower, 19% and 32% for those eligible to unemployment assistance and social security, respec-tively. These results are similar to those reported by Vodopivec (1998) for Slovenia in 1996. He also finds that replacement rates under unemployment insurance are generally higher than those under social assistance.
re-ceive unemployment compensation. It is expected they would not be unconditional-ly prepared to take again the job, if they received, say, 10% more income. This group of people is probably the most exposed to unemployment trap. Similar would be for highly paid workers, who would probably not be interested to take a low paid job until receiving unemployment compensation. With this respect, Van Ours and Vodopivec (2004) find empirical evidence for Slovenia that there are differences between gender in the probability of reemployment. Males with at least one dependent family member are more likely exit from unemployment after unemployment benefits expire. On the other hand, females are less likely to exit from unemployment – they are more likely to stay unemployed.
6 A comparative analysis of financial re-employment incentives in Slovenia and OECD
In the previous chapter we analyzed the reemployment incentives in Slovenia, but purely descriptive analysis does not offer a thorough overview of the subject. This chap-ter is a comparative analysis of reemployment incentives in Slovenia and OECD.
Tables 1 to 3 contain not only data for OECD countries, but also comparative data for Slovenia (in bold). On the first sight these results show that Slovenia does not “step-out” when compared to OECD countries. In Slovenia average net replacement rate for aver-age-wage earners and minimum-wage earners are fairly similar, 92% and 75%, respec-tively (see section 3 for comparison).
As for marginal effective tax rate is concerned regardless the previous work wage level, the marginal effective tax rate for reemployment wage at the level of 100% of av-erage production worker wage in OECD (avav-erage of all members) and Slovenia is very close (about 66% for unemployed person with previous work wage level of 67% of aver-age production worker and 74% for unemployed person with previous work waver-age level of 100% of average production worker). For reemployment wage at the level of mini-mum wage, the marginal effective tax rate is significantly lower in Slovenia, though (for 12 to 14 % pts.).
tax policies concerning labor taxation and also have similar unemployment rate (ac-cording to ILO classification) their employment rates differ significantly.
Slovenia is often compared to Ireland as well, because of the size and openness of the economy and other factors. In fact, Slovenia and Ireland are fairly similar with respect to employment rate (they both have employment rate at the level of approximately 65%), but Ireland has somewhat lower unemployment rate (approximately 4.3%) – see Dolenc and Vodopivec (2005). As financial aspects of reemployment incentives are concerned in Ire-land unemployed get lower unemployment support on average than in Slovenia, because they lose more than 30% of what they have earned prior to the unemployment. They are also more financially stimulated to take again the job, because they earn on average 37% more than they received as unemployed (concrete figures are of course subject to family type and wage level before and after unemployment). In spite of this differences unem-ployment rate (and emunem-ployment rate) – as mentioned – is not really that much different in Slovenia compared to Ireland.
Another comparison is interesting in this regard – a comparison to Austria. Slove-nia and Austria have fairly similar figures when we take into consideration financial in-centives to re-employ, either net replacement rate or marginal effective tax rate. Overall average net replacement rate in Austria is 77% (2% pts. lower than in Slovenia), where-as average marginal effective tax rate is 74% and 81% for 67% APW worker and 100% APW worker, respectively. Austria has, however, lower unemployment rate and higher employment rate.
These results show that when analyzing financial incentives to work a simple cross-country analysis would not be enough because there are several other factors influenc-ing the labor market (the level of shadow economy, willinfluenc-ingness to work, flexibility of workers to take half time job, etc.). It is – however – evident, that Slovenia does not “step-out” in financial incentives to work, especially if compared to similar economies in the region.
7 Conclusions and some policy considerations
We showed above that European and OECD countries have different tax systems and cope differently with unemployment. There are some countries and some wage/fam-ily type combinations, where unemployment trap indicator or net replacement rate jumps over 100%. Here the unemployed are not stimulated to take a job.7
Compared to OECD countries Slovenia does not “stick-out” when reemployment incentives are concerned. We find, however, that there are some groups of unemployed who are potentially less stimulated to reemploy. For unemployed with dependent fami-ly members and low-income potential net replacement rate is fairfami-ly high (almost 100%). Results of Van Ours and Vodopivec (2004) about differences between gender in the prob-ability of reemployment are applicable here: also in Slovenia women may be more stim-ulated to stay at home.
How to improve (re)employment incentives in Slovenia? Our country has intro-duced active labor market programs to increase employment opportunities for unem-ployed, especially marginal groups (young inexperienced people, elderly people, etc.). This program, however, does not include one direct financial incentive for unemployed (for example, a earnings supplement) to directly attract people with high replacement rate to join employment. Therefore Slovenia could consider introducing some sort of “in-work” arrangements that increase net income from low paid work such as most of continental welfare states have done in the nineties. Social benefits to work have proven to be a success in Belgium, where unemployed with low wage potential (and high mar-ginal effective tax rate) became stimulated to take any kind of work, even though less paid. Similar arrangement – earning supplements – have proved to be successful in the US and UK. Empirical results for different European countries and the US have shown that such measures would have some positive effects on employment, and the earnings and incomes of poor families, and at the same time would probably cause at little or no net increase in the cost of government transfers.
For Slovenia this could have another significant effect: it could lower the rate of un-declared economy, which is a vast problem in Slovenia as pointed out by Nastav (2004), and Nastav and Bojnec (2005). It is often so that “unemployed” in Slovenia receive un-employment benefits as long as possible, but work unofficially at the same time – in such way they have two positive financial effects: first, they receive unemployment benefits that could be relative high if pre-unemployment wage was high, and second, they receive higher wage on their undeclared work, because they do not pay taxes. This topic, regard-less the fact that is closely connected to the issue discussed in this paper, is a relatively unresearched issue in Slovenia and is therefore left for further research.
REFERENCES
Andersen, T. and Risager, O., 1990. “Wage Formation in Denmark” in: L. Calm-fors, ed. Wage Formation and Macroeconomic Policy in the Nordic Countries. Oxford: Oxford University Press, 137-181.
Browne, F. and McGettigan, D., 1993. “Another look at the Causes of Irish Unem-ployment”. Technical Paper, 1/RT/1993. Dublin: Central Bank of Ireland.
Calmfors, L. and Nymoen, R., 1990. “Real Wage Adjustment and Employment Pol-icies in the Nordic Countries”. Economic Policy, (11), 397-448.
Card, D. and Robins, P., 1996. Do Financial Incentives Encourage Welfare
Recipi-ents to Work? Initial 18 Month Findings from the Self-Sufficiency Project. Ottawa: Social Research and Demonstration Corporation.
Carone, G. [et al.], 2003. “Indicators of Unemployment and Low-Wage Traps (Mar-ginal Effective Tax Rates on Labour)”. Economic papers, No. 197. Brussels: European Commission.
Carone, G. [et al.], 2004. Indicators of Unemployment and Low-Wage Traps
Daveri, F., 2001. “Labor taxes and unemployment. A survey of the aggregate evi-dence”. Working paper, No. 18. Moncalieri: Center for Research on Pensions and Wel-fare Policies.
De Lathouwer, L., 2004. Making work pay, making transitions flexible. The case
of Belgium in a comparative perspective. Antwerpen: CSB.
Dilnot, A. and McGrae, J., 2000. “The family credit system and the working families tax credit in the United Kingdom OECD Economic Studies, No. 31. Paris: OECD.
Dolado, J. J., Malo de Molina, J. L. and Zabala, A., 1986. “Spanish Industrial Unemployment: Some Explanatory Factors”. Economica, (53), 313-334.
Dolenc, P. and Vodopivec, M., 2005. “Porezni klin u Sloveniji: međunarodna usporedba i preporuke za ekonomsku politiku”. Financijska teorija i praksa, 29 (3), forthcoming.
Eriksson, T., Suvanto, A. and Vartia, P., 1990. “Wage Formation in Finland” in: L. Calmfors, ed. Wage Formation and Macroeconomic Policy in the Nordic Countries.
Oxford:Oxford University Press, 189-235.
European Commission, 2005. Draft Joint European Commission Report 2004/
2005. Brussels: Council of the European Union.
Fitoussi, J.-P., 2000. “Payroll tax reductions for the low paid”. OECD Economic
Studies, No. 31. Paris: OECD.
Greenwood, J. and Voyer, J.-P., 2000. “Experimental evidence on the use of earnings supplements as a strategy to “make work pay””. OECD Economic Studies
No. 31.
Haveman, R. 1996. “Reducing poverty while increasing employment: a prim-er on altprim-ernative strategies and a blueprint”. OECD Economic Studies, No. 26. Paris: OECD.
Hotz, V. J. and Scholz, J. K., 2000. “Not Perfect, But Still Pretty Good: The Eitc And Other Policies To Support the Us Low-Wage Labour Market”. OECD Economic Studies, No. 31. Paris: OECD.
IMF, 2003. World Economic Outlook, April. Washington, DC: International
Mon-etary Fund.
Immervoll, H. and O’Donoghue, C., 2003. “Employment Transitions in 13 Eu-ropean Countries. Levels, Distributions and Determining Factors of Net Replacement Rates”. CESIFO Working Paper, No. 1091. Munich: Center for Economic Studies.
Malinvaud, E., 1998. Les cotisations socials à la charge des employeurs: analyse économique [online]. Available from: [http://lesrapports.ladocumentationfrancaise.fr/ BRP/984001443/0000.pdf#search=’Malinvaud%20analyse].
Meade, J. E., 1978. The Structure and Reform of Direct Taxation. London: George
Mijanovich, T. and Long, D., 1995. Creating an Alternative to Welfare: First-Year Findings on the Implementation, Welfare Impacts, and Costs of the Self-Sufficien-cy Project. Ottawa: Social Research and Demonstration Corporation.
Nastav, B. and Bojnec, Š., 2005. Shadow Economy in Slovenia. Proceedings of
the 6th International Conference of the Faculty of Management
Nastav, B., 2004. Measuring welfare’s components: work. Ljubljana: Statistično
društvo Slovenije.
Noghadam, R., 1994. “Why is unemployment in France So High?” IMF Working
Paper WP/94/58. Washington, D.C.: International Monetary Fund.
OECD, 1997. Implementing the OECD jobs strategy: making work pay. Paris:
OECD.
OECD, 1998. Employment Outlook. Paris: OECD.
OECD, 1999a. Benefits systems and work incentives. Paris: OECD.
OECD, 1999b. Implementing the OECD Jobs Strategy: Assessing performance
and policy. Paris: OECD.
OECD, 2004a. Benefits and Wages. Paris: OECD.
OECD, 2004b. Taxing Wages 2002/2003. Paris: OECD.
Pearson, M. and Scarpetta, S., 2000. “An overview: What do we know about policies to make work pay?” OECD Economic Studies, No. 31. Paris: OECD.
Phelps, E. S., 2000. “The Importance of Inclusion and the Power of Job Subsidies to Increase It”. OECD Economic Studies, No. 31. Paris: OECD.
Prescott, E. C., 2004. “Why Do Americans Work So Much More Than Europe-ans”. Federal Reseve Bank of Mineapolis Quarterly Review, (28), 2-13.
Scholz, J. K., 1995. Testimony before the committee on ways and means. U.S.
Congress. 15 June, mimeo.
Stanovnik, T., Čok, M. and Stropnik, N., 2004. Denarna socialna pomoč v
Slov-eniji. Ljubljana: Institute for Economic Research.
Tattrie, D., 1999. A Financial Incentive to Encourage Employment Among
Re-peat Users of Employment Insurance: The Earnings Supplement Project. Ottawa: So-cial Research and Demonstration Corporation.
Turvainen, T., 1994. Real wage Resistance and Unemployment: Multivariate
Anal-ysis of Cointegrating Relations in 10 OECD Economies. Paris: OECD.
Van Ours, J. and Vodopivec, M., 2004. “How Changes in Benefits Entitlement Affect Job-Finding: Lessons from the Slovenian “Experiment””. IZA Discussion Paper,
No. 1181.
Vodopivec, M., 1998. “Transition from cash benefits to work: The case of Slov-enia”. Empirical Economics, (23), 173-202.