Vol.6 (2016) No. 6
ISSN: 2088-5334
Ensemble Learning of Tissue Components for Prostate Histopathology
Image Grading
Dheeb Albashish
#1, Shahnorbanun Sahran
#2, Azizi. Abdullah
#3, Nordashima Abd Shukor
*1, Suria Pauzi
*2#
Pattern Recognition Research Group Center for Artificial Intelligence Technology
Faculty of Information Science and Technology, University Kebangsaan Malaysia, 43600 Bangi, Malaysia Emails: [email protected], {2shahnorbanun, 3azizia}@ukm.edu.my
*
Department of Pathology, University Kebangsaan Malaysia Medical Center Emails: {4nordashima,5su_hayati}@ppukm.ukm.edu.my
Abstract— Ensemble learning is an effective machine learning approach to improve the prediction performance by fusing several
single classifier models. In computer-aided diagnosis system (CAD), machine learning has become one of the dominant solutions for tissue images diagnosis and grading. One problem in a single classifier model for multi-components of the tissue images combination to construct dense feature vectors is the overfitting. In this paper, an ensemble learning for multi-component tissue images classification approach is proposed. The prostate cancer Hematoxylin and Eosin (H&E) histopathology images from HUKM were used to test the proposed ensemble approach for diagnosing and Gleason grading. The experiments results of several prostate classification tasks, namely, benign vs. Grade 3, benign vs.Grade4, and Grade 3vs.Grade 4 show that the proposed ensemble significantly outperforms the previous typical CAD and the naïve approach that combines the texture features of all tissue component directly in dense feature vectors for a classifier.
Keywords— ensemble machine learning; naïve approach; typical CAD system; prostate cancer histological image; tissue components
I. INTRODUCTION
Ensemble learning model is a powerful approach in machine learning. The aim is to include several single classifiers, which are both diverse and accurate. Thus, better classification performance on a test sample is obtained. In ensemble learning, the outputs of all base classifiers are combined to create an ensemble final output [1]. Among several combination methods, product rule is the simpler and provide higher classification performance [2]. Previous studies have illustrated that ensemble learning model often demonstrated promising capabilities in achieving higher performance in classification tasks than the single classifier [1], which due to the overfitting problem [3], [4]. Overfitting issue could be induced by a small number of training samples used to construct the classifier relative to a large number of features that used to describe the samples [5]. There are several approaches for avoiding model overfitting [6]. One of the most common strategies for avoiding overfitting is the ensemble learning model [7]
.
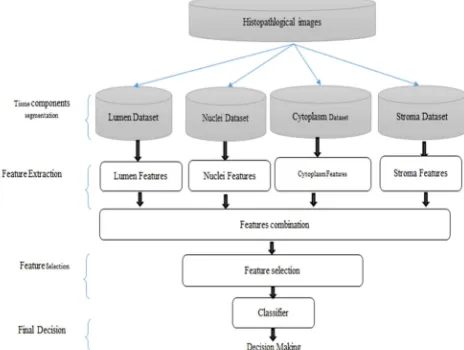
Ensemble divides the dense feature vectors among different classifiers. Thus, by combining the classification result fromthe different base classifiers, the overfitting caused by dense feature vectors can be reduced. Although ensemble learning model has been employed in several medical image applications, a single classifier (typical CAD), as illustrated in Fig. 1, has been become one of the dominant approaches in most digital pathology studies on the computer-aided prognosis for prostate cancer (PCa).
Fig. 1 The general architecture of the typical CAD system for PCa [8]
within the same class (e.g., benign, Grade 3, Grade 4) [9], [10], [11], [12]. The main reasons for this variability are the variation in the amount of stain used, the duration of tissue storage, and the thickness of the tissue [13], which makes classification task quite difficult. For these reasons, a single classifier design may face a great challenge in achieving high performance that meets the requirement of the clinical application. Therefore, this paper overcome the aforementioned limitations by extracting the texture features from the main tissue components of the prostate histopathological image, namely, lumen, nuclei, cytoplasm, and stroma. However, a combination the multi-components of the prostate tissue images construct dense feature vectors (called naïve approach, Fig. 2), which suffer from the overfitting [14].
The main theoretical contributions of the current study can be explained as follows. First, extracting the texture features from the spatial distribution of lumen, nuclei, and cytoplasm and stroma tissue components. These tissue components could prove more expressive power in minimizing the class heterogeneity for each classification task. Second, to propose ensemble framework to solve the overfitting issue that produced by combining the multi-components features in dense feature vectors. In particulars, the proposed ensemble framework constructs four base classifiers for the corresponding main tissue components. The goal is to generate from given tissue components a collection of diverse predictors whose errors are uncorrelated. Each base classifier is trained using the texture features of a specific tissue component. Finally, the output of the ensemble is combined using the product rule.
Moreover, the proposed ensemble framework is used to solve three different prostate cancer classification tasks, namely, Benign vs. Grade 3, Benign vs. Grade 4, and Grade 3 vs. Grade 4. Finally, the performance of the proposed ensemble framework is compared to the typical CAD (Fig. 1) that uses single classifier [8], and the naïve approach [15] (Fig. 4) that combines the features of all tissue components in a single input vector for a classifier (e.g., Support Vector Machine (SVM)).
Fig. 2 Dense feature vectors of all tissue components (called naive approach)
The rest of this paper is organized as follow: Section II presents the related works for the prostate cancer diagnosis and grading. The methodology is presented in Section III. In
Section IV, the experiment results and discussion are presented. Finally, the conclusion and future work are shown in Section V.
Prostate cancer is the most common cancer that occurs in male’s reproductive system [16]. The microscopic analysis of prostatic tissue is the gold standard for diagnosing prostate cancer. In this analysis, tissue samples are processed in the laboratory and stained using Hematoxylin and eosin (H&E) to highlight the cell morphology. Then, the tissue samples are examined under a microscope to establish diagnosis and grading using a specific procedure.
The widely accepted procedure for the histological grading of prostate tissue is the Gleason grading system [17], which is a strong prognostic indicator and correlates with the outcome following radiotherapy [8]. The grading system categorizes the histologic patterns by the extent of glandular differentiation and the pattern of growth of the cancer cells in the prostatic stroma. Five basic grade patterns are used to generate the histologic grading. These grades determine the aggressiveness of the prostate cancer [9]. For example, Grade one corresponds to a well-differentiated tumor, i.e., the tissue with the highest degree of resemblance to normal tissue, and is associated with a low mortality rate. Grade five corresponds to a poorly differentiated tumor and correlates with tumor aggressiveness and a higher mortality rate. The Gleason score is used to measure the heterogeneity of prostate cancer [18]. The Gleason score denotes the sum of the highest and second highest predominant Gleason grades in the tumor. For instance, if the most predominant carcinoma pattern is Gleason grade 4 and the second most common is 5 in the cancer tissue, the final Gleason score for this cancer is 4 + 5 = 9. Therefore, the range of the final Gleason score is from 2 to 10 [9].
In most prostate digital pathology researchers on computer-aided diagnosis for prostate cancer, the typical framework [8] (Fig. 1) consists of four main phases: preprocessing phase, feature extraction and feature selection phases and a classification phase. The preprocessing phase .intended to remove irrelevant background noise or segment important tissue component within the histopathology image. Then, the feature extraction phase emphasizes on extraction the relevant characteristics of the image by measuring the texture or structure features. Next, in feature selection phase, the most important features that best differentiate the Gleason grades are selected using the appropriate method such Support Vector Machine - Recursive Feature Elimination (SVM-RFE) [19]. Finally, the pattern recognition phase employed a specific classifier (e.g., SVM) to diagnosis and grade the region of tissue image.
images [24], [25]. For example, Huang & Lee [24] employed the fractal dimension features for the prostate tissue images and the low-frequency sub-bands to discriminate between high-grade versus low-grade Gleason grade. They reported 86% accuracy for the classification prostate tissue into benign, Grade 3, 4 and 5.
Diamond et al. [26] proposed a framework to classify the sub-region from a tissue image as either a prostatic carcinoma or stroma. They used Haralick texture features [27] that extracted from the co-occurrence matrix to classify the sub-region in either stroma or cancerous tissue and used morphometric features under the assumption that abnormal tissue exhibits smaller areas of the associated lumen to classify the normal sub-region. This study reported 79.3% accuracy when evaluating the algorithm on sub-regions of 8 tissue images (40 times magnification).
In [22], the authors used the co-occurrence texture [20] [21], Gabor filter and first order statistics (mean, median) features to classify the prostate tissue images into cancer vs. non-cancer. They constructed 594 base learners for AdaBoost-ensemble using the Bayes classifier, one classifier for an individual feature. The reported accuracy was 88% on a dataset of 22 images (40x magnification). In [9], Tabesh et al. employed color, morphometric cues and the texture features of the entire image and local features of the tissue components to classify prostate tissue images into low and high grade. By using SVM classifier with fivefold cross-validation using 286 images at 20x magnification, the method achieved 81% accuracy for low grade/ high-grade classification.
Alexandratou et al. [23] compared between 16 machine learning algorithms based on their performance. In each algorithm, the training dataset extracted from the prostate tissue images based on thirteen Gray Level Co-occurrence Matrix (GLCM) to distinguish between the Gleason grades. The reported results low and high grade was 80.8% and 77.8% for accomplishing Gleason grading.
On the other hand, tissue-structure-based CADs utilize geometrical features (e.g., size and shape) vectors extracted from specific tissue components. For instance, Nguyen et al [13] employed K-means in RGB color space to extract the main tissue components, namely nuclei, stroma, lumen, and cytoplasm, to distinguish between two/three-way classification tasks based on the structure and contextual features of lumen and nuclei. In [28], the authors utilized the domain of prostate histopathology knowledge to segment the image into its basic tissue components to distinguish between different pattern Gleason grades. Naik et al. [29] extracted the shape features of glands and lumen to discriminate between different pattern Gleason grades. Using 44 images, they reported: 86.35% for benign versus grade 3, 92.9% for benign versus grade 4, and 95.19% for grade 3 versus grade 4.
II. MATERIAL AND METHOD
A. Dataset
The dataset consists of a total 149 Hematoxylin and Eosin (H&E)-stained prostate images with fixed size 4140 X 3096 pixels. There are 41 images of Grade 3 and 56 of Grade 4, and 52 of benign. The images digitized at 40x optical
magnification. Each region of interest was previously extracted from homogeneous patches of whole tissue slides, and three experienced pathologists graded it. The average classification performance over 50 different runs for the best parameters is reported.
B. The Proposed Framework
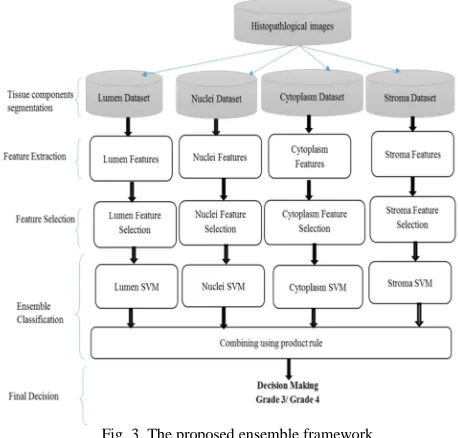
This research presents a new ensemble framework for diagnosis and grading a prostate tissue image based on their main tissue components. The main contributions of this framework are utilizing the texture features of the independent tissue components instead of computing the texture or structure features from the region image as in previous studies (Fig. 1). As a result, this strategy will overcome the heterogeneity within the same class. Moreover, spreading the tissue components’ features into four different groups to achieve the diversity among the base classifiers of the ensemble, and reduce the problem of overfitting that construct from combining all tissue components’ features in dense feature vectors. Fig. 3 depicts the schematic of the proposed ensemble framework, which consists of five stages (1) tissue component identification (2) feature extraction, (3) feature selection, and (4) ensemble learning.
Fig. 3. The proposed ensemble framework
1) Tissue Components Identification
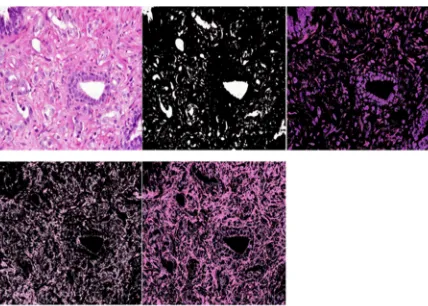
The prostate tissue components have been segmented using K-means clustering method into four clusters. By finding four cluster centers, each pixel in the tissue image is assigned a label corresponding to a particular tissue component (lumen, nuclei, cytoplasm and stroma). Since the colors of the tissue components are quite salient, the K-means method is sufficient to identify them regardless of the intensity variation among the tissue image [13].
cluster is close to lumina, it will take the cluster that has a center value close to lumina cluster’s center value, Fig. 4 (d). Finally, the remaining cluster is assigned to the stroma component Fig. 4 (d).
Fig. 4 A) Prostate Grade3 H&E histological image, B) The lumen tissue component, C) Nuclei tissue component. D) Cytoplasm tissue component. E) Stroma tissue component
2) Feature Extraction
In this step, for individual tissue component, a set of co-occurrence texture features that measure the characteristic of a tissue component have been computed. We extract 21 co-occurrence texture features from each of the individual color channels of the HSV (Hue, Saturation, and Intensity) and L*a*b*(except L channel since it for illumination) color spaces, resulting in 105 features for each tissue component. The following 21 co-occurrence texture feature are computed: entropy, energy, dissimilarity, contrast, inverse difference, correlation, homogeneity, autocorrelation, cluster shade, cluster prominence, maximum probability, sum of squares, sum average, sum variance, sum entropy, difference variance, difference entropy, information measures of correlationⅠ, information measures of correlation Ⅱ, maximal correlation coefficient, and inverse difference normalized (INN) [20] [21]. The following feature vectors represent the extracted features of the individual tissue components:
a , , , , (1)
, , , , (2)
, , , , (3)
, , , , (4)
where, , , , represent the respective features vectors of L, N, C, and S, and a , , , , are the Haralick features for the a*,b*,H, S, and V channels respectively.
3) Feature Selection
Feature selection is a vital pre-processing step in pattern recognition. To obtain a high classification accuracy, it is critical to select the most important set of features for each tissue component dataset that are highly expressed in diagnosing and grading prostate cancer. To derive the most important features, in this methodology SVM-RFE (Guyon et al., 2002) is used to select the most relevant features subset for each tissue component dataset. SVM-RFE utilizes
criteria derived from the weighted coefficients in SVM models to rank features, and recursively in backward removes features that have a small criterion. Comparing to wrapper methods, SVM-RFE (1) uses the full training set whereas the wrapper uses the cross-validation on the training data; (2) much faster; (2) less prone to overfitting; (3). Therefore, this study proposes SVM-RFE for selecting the most important features from individual tissue components’ features.
4) Ensemble Learning Components
In this research, the ensemble learning consists of two main components: base classifiers and a fusing rule. The base classifiers include four independent base support vector machine (SVM) [31] classifiers. SVM is a binary learning algorithm proposed by Vapnik [31], which is used to analyze and recognizes patterns.
In this study, the four base SVM classifiers are built based on the selected features of corresponding tissue components. For each base SVM, a Radial- Basis-Function (RBF) kernel was used in the experiments. Initially, the selected features in the training and testing sets were normalized to the interval [-1,+1]. To find the SVM parameters C and γ that perform best for the selected features. To optimize the classification performance, the parameters were determined by using the LibSVM [32] grid-search algorithm. We tried the following values
{2
-20, ..., 2
1…, 2
20}
for C and γ, respectively. The values which gave the best accuracy performance with threefold cross-validation are picked and used to train on the training set.5) Ensemble Fusing Rule
In machine learning, ensemble classifier is becoming increasingly important as they have repeatedly displayed the ability to improve upon the performance of a single classifier in theory and practice [33]. The ensemble classifier consists of a set of independent trained base classifiers whose predictions are fused to classify new samples. The outputs of all these base classifiers are fused to create an ensemble final output based on a fusion rule. The fusion rules are categorized as (i) a fusion rule that applies to class label, and (ii) class-specific continuous outputs [34]. For example, majority voting is classified as the former group (i). In a comparison of different fusing rules for ensemble learning, majority voting is as effective as other complicated rules. However, it not work as good as other techniques with the problem of binary classes [35]. Thus, this study utilizes the continuous output because it looks to solve the two-class classification problems. Among the continuous output fusion rules, the product rule most efficient and simple rule for combining the output of the base classifiers, which is fast and uses all the information available in the outputs of the base classifiers [2]. Moreover, the product rule is utilized when the base classifiers operate in independent feature spaces and have small errors. Thus, in this study, the product rule is employed to fuse the output of the lumen and nuclei base classifiers to produce the final decision of the ensemble. In product rule (Eq. 5), the posterior probability outputs (I) for class j of t different base classifiers are fused by:
then, the class with the maximum probability product is considered as the final class label belonging to the test tissue image(I).
III.RESULTS AND DISCUSSION
A. Performance Measures
In this study, multiple classification measures are used to obtain a more reliable comparison. In each binary classification task, e.g., Grade 3 versus Grade 4, correspond to negative and positive samples, respectively. In this context, true positive (TP) and true negative (TN), respectively, represent the number of Grade 3 and Grade 4, which are correctly classified. Similarly, false positive (FP) and false negative (FN), characterize the number of Grade3 and Grade 4 samples, which are miss-classified, respectively. The performance of the proposed and the other frameworks are measured in terms of averaged area under ROC curves (AUC), accuracy, specificity, and sensitivity. These criteria are measured in the ensemble framework based on the product rule (Eq. 5). First, AUC represents the system over its entire operating range, and it computed by plotting the sensitivity and (1-specificity) of the classification system. Second, accuracy criterion (Eq. 6), which represent the number of correctly classified samples (i.e. TP and TN). Third, sensitivity criterion (Eq. 7), which determines the probability of the true positive cases such that the test image has the Grade 3. While, specificity criterion (Eq. 8), determines the probability of the results that are true negative such that the test image does not have Grade 3.All of these criteria are multiply by 100% . Finally, a paired t-test at significant level 95% is performed to determine any significant difference in the obtained results between the proposed ensemble framework and the other methods.
Accuracy= (TP +TN)/(TP+TN+FP+FN) x100% (6)
Sensitivity=TP/ (TP+FN) x100% (7)
Specificity=TN/ (TN+FP) x100% (8)
B. Empirical Results and Discussion
The proposed ensemble framework was tested on three classification tasks, namely, benign vs. Grade 3, benign vs. Grade 4, and Grade 3 vs. Grade 4, where the number of the images in each grade is described in Section IV.1. The performance of the proposed ensemble framework was compared against the typical CAD framework [8] (Fig. 1) and a naïve base approach (Fig. 2).
In the experiments, the classification performance is evaluated by dividing the dataset randomly into 50% of samples for training and remaining 50% of samples for testing. In each training-test procedure, the frameworks used for comparison are repeated 50 times with different random seeds to guarantee that the comparison among the frameworks does not happen by chance. In this way, 50 experiments results for each framework are obtained. Then, the mean of the 50 performances is used as final results for the proposed ensemble framework, naïve approach, and typical framework respectively.
The results of all experimentations are shown in Table 1. It can be seen that the proposed ensemble framework
significantly outperformed the typical CAD framework [8] and a naïve base approach, in most of the performance measures on different classification tasks. The last two columns in Table 1 show the significance of the differences of performances of the ensemble framework over the Naïve approach and the typical CAD, respectively. For example, in Grade 3 vs. Grade 4, comparing to the other frameworks, the values of AUC significantly (p-value <0.05) were increased with about 2.39% and 1.66% in order of naïve base approach and typical CAD framework, respectively.
The results of Benign vs. G3 are also presented in Table 1, regarding these results, the proposed ensemble framework obtained better AUC accuracy than the typical CAD. Comparing to the naïve approach, the proposed ensemble framework significantly outperformed the naive approach, this is due to solving the overfitting problem. Similarly, there was a significant increase in accuracy (1.81%) and sensitivity (3.19%) values.
Although the proposed framework obtained competitive performances in the Benign vs. Grade 4 classification task, their results were not significant due to sensitivity value, which achieved the lowest value 90.64%. One reason for this low value is that in Gland 4 the glands are fuse with each other. Thus, their size becomes large and affect the texture of their individual tissue components, while the Benign tissue image has a large glands size. Thus, the tissue components of the Benign and Gland 4 have become close in their tissue components.
TABLE I
AVERAGE CLASSIFICATION PERFORMANCE (IN %) AND STATISTICAL SIGNIFICANCE OVER 50 RUNS OF THE PROPOSED ENSEMBLE AND OTHER
FRAMEWORKS ON DIFFERENT TWO-CLASS PROSTATE CALSSIFICATION TASK. THE BEST RESULT IS INDICATED IN BOLD FACE
framework performed well over all the cases studied here in term of their AUC, accuracy, sensitivity and specificity.
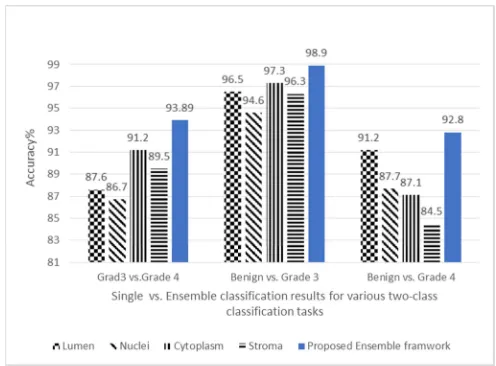
Besides, this study has compared the proposed ensemble framework with the individual tissue components. The results are given in Fig. 5. It can be seen that the proposed Ensemble framework outperformed the induvial tissue components (i.e., single classifier) in term of accuracy. In particularly, using the ensemble framework, classification performance substantiality improved with around 7.1%, 4.3% and 5.1 for nuclei tissue component (i.e., the most critical component for grading) in Grade3 vs. Grade 4, Benign vs. Grade 3, and Benign vs. Grade 4, respectively. Moreover, the results show that the cytoplasm tissue component produced the highest performance than the other tissue components. However, comparing to the proposed ensemble framework, the latter also outperformed the cytoplasm with around 2.69%, 1.6%, and 5.7% for the two-class classification tasks, respectively. These results indicate that the proposed ensemble framework is suitable for the PCa grading.
Nevertheless, despite the superiority of the proposed ensemble framework, it is likely that ensemble framework performance can be enhanced by selection the most relevant features. In this study, the selection of the most relevant features was achieved by utilizing a powerful feature selection method, namely, SVM-RFE [19], which is robust to overfitting.
In this study, the ensemble framework was also compared to the typical previous CAD, which has been widely used in most of the previous studies [8], [9], [23]. However, the typical CAD had been focused on the study of the application of the single based solutions. It has been widely accepted in most of the previous study that distinguishes between Grade 3 versus Grade 4 in prostate histopathology domain is quite challenging, mainly due to heterogeneity among the same class and restricted training dataset. As such, the construction of a single classifier that performs well for such challenging classification task may be quite difficult. To overcome the previous issue, this paper extracted the texture feature from individual tissue components. Then,
build an ensemble learning model that consist of diverse base classifiers for the corresponding tissue components. Thus, the obtained results of the ensemble framework significantly outperformed the typical previous CAD, which, due to reducing the intra-class.
IV.CONCLUSION
In this study, a novel ensemble framework, based on the multi-components, has been proposed for classification and grading cancer in prostate histopathological images. The current ensemble framework is strongly motivated to solve the overfitting issue, which, due to dense feature vectors that construct by combining the texture features of the main tissue components. The study successfully has demonstrated that through performance evaluations, the proposed ensemble framework of the multi-tissue components can achieve accurate and reliable classification prostate tissue images superior to the naïve approach that combines the texture features of all tissue components, and the typical CAD.
A key characteristic of the proposed ensemble framework is that the texture features are extracted from individual tissue components, which play a critical role in minimizing the heterogeneity among the same class and increase the performance of diagnosis and grading. Finally, this ensemble framework may be expected to work well for other machine learning applications in the medical histopathological image. In future work, we plan further to investigate other machine learning techniques, such as feature selection methods, to select the most important features with minimum redundancy for each tissue component that leads to improving the accuracy of Grade 3 versus Grade 4 classification task.
ACKNOWLEDGEMENTS
The authors would like to thank the Faculty of Information Science and Technology - Universiti Kebangsaan Malaysia for providing facilities and Financial Support under Fundamental Research Grant Scheme No. DIP-2015-023 entitled "Object Descriptor via Optimized Unsupervised Learning Approaches”.
REFERENCES
[1] M. C. Lee, L. Boroczky, K. Sungur-Stasik, A. D. Cann, A. C. Borczuk, S. M. Kawut, and C. a Powell, “Computer-aided diagnosis
of pulmonary nodules using a two-step approach for feature selection and classifier ensemble construction.,” Artif. Intell. Med.,
vol. 50, no. 1, pp. 43–53, 2010.
[2] A. Abdullah, R. C. Veltkamp, and M. a. Wiering, “An Ensemble of
Deep Support Vector Machines for Image Categorization,” 2009 in Int. Conf. Soft Comput. Pattern Recognit., 2009, no. 1, p. 301.
[3] X. Zeng, D. F. Wong, and L. S. Chao, “Constructing better classifier
ensemble based on weighted accuracy and diversity measure,” Sci. World J., vol. 2014, 2014.
[4] Y. Zhang and Z. Zhang, “Feature subset selection with cumulate
conditional mutual information minimization,” Expert Syst. Appl.,
vol. 39, no. 5, pp. 6078–6088, 2012.
[5] I. Guyon and A. Elisseef, “An Introduction to Variable and Feature
Selection 1 Introduction,” J. Mach. Learn. Res., vol. 3, pp. 1157–
1182, 2003.
[6] Y. Aksu, D. J. Miller, G. Kesidis, and Q. X. Yang,
“Margin-maximizing feature elimination methods for linear and nonlinear kernel-based discriminant functions,” IEEE Trans. Neural Netw., vol.
21, no. 5, pp. 701–17, May 2010. Fig. 5 Classification accuracies of the proposed ensemble framework and the
[7] T. G. Dietterich, “Ensemble Methods in Machine Learning,” in
Multiple Classifier Systems, vol. 1857, 2000, pp. 1–15.
[8] C. Mosquera-Lopez, S. Agaian, A. Velez, and I. Thompson, “Computer-aided Prostate Cancer Diagnosis from Digitized
Histopathology: A Review on Texture-based Systems,” IEEE Rev.
Biomed. Eng., vol. 8, pp. 98–113, Jul. 2015.
[9] A. Tabesh, M. Teverovskiy, H. Y. Pang, V. P. Kumar, D. Verbel, A. Kotsianti, and O. Saidi, “Multifeature prostate cancer diagnosis and
gleason grading of histological images,” IEEE Trans. Med. Imaging,
vol. 26, no. 10, pp. 1366–1378, 2007.
[10] O. S. Al-Kadi, “Texture measures combination for improved
meningioma classification of histopathological images,” Pattern
Recognition., vol. 43, no. 6, pp. 2043–2053, Jun. 2010.
[11] M. D. DiFranco, H. M. Reynolds, C. Mitchell, S. Williams, P. Allan, and A. Haworth, “Performance assessment of automated tissue
characterization for prostate H and E stained histopathology,” In
SPIE Medical Imaging, 2015, Vol.9420, P.94200M.
[12] M. D. DiFranco, G. O’Hurley, E. W. Kay, R. W. G. Watson, and P. Cunningham, “Ensemble based system for whole-slide prostate
cancer probability mapping using color texture features.,” Comput.
Med. Imaging Graph., vol. 35, no. 7–8, pp. 629–45, 2011.
[13] K. Nguyen, B. Sabata, and A. K. Jain, “Structure and context in
prostatic gland segmentation and classification,” In International
Conference on Medical Image Computing and Computer-Assisted Intervention, 2012, vol. 7510, pp. 115–123.
[14] A. Abdullah, R. C. Veltkamp, and M. a. Wiering, “Spatial pyramids
and two-layer stacking SVM classifiers for image categorization: A comparative study,” In International Joint Conference on Neural
Networks IEEE, 2009, p. 5.
[15] A. Abdullah, R. C. Veltkamp, and M. A. Wiering, “Ensembles of
novel visual keywords descriptors for image categorization,” in 11th
International Conference on Control, Automation, Robotics and Vision, ICARCV, ” 2010, no. 4, p. 1206.
[16] J. Pääkkönen, N. Päivinen, M. Nykänen, and T. Paavonen, “An
automated gland segmentation and classification method in prostate biopsies: an image source-independent approach,” Mach. Vis. Appl.,
vol. 26, no. 1, pp. 103–113, 2015.
[17] D. F. Gleason, “Histologic grading and clinical staging of prostatic
carcinom,” Urol. Pathol. prostate, pp. 171–197, 1977.
[18] K. Nguyen, B. Sabata, and A. K. Jain, “Prostate cancer grading:
Gland segmentation and structural features,” Pattern Recognition.
Lett., vol. 33, no. 7, pp. 951–961, May 2012.
[19] I. Guyon, J. WESTON, S. BARNHILL, and V. VAPNIK, “Gene
Selection for Cancer Classification using Support Vector Machines,”
Mach. Learn., vol. 46, pp. 389–422, Jan. 2002.
[20] R. M. Haralick and K. Shanmugam, “Textural Features for Image
Classification,” IEEE Trans. Syst. Man. Cybern., vol. 3, no. 6, pp.
610–621, Nov. 1973.
[21] R. M. Haralick, “Statistical and Structural Approaches To Texture.,” in Proceedings of the IEEE, 1979, vol. 67, no. 5, p. 786.
[22] S. Doyle, M. Feldman, J. Tomaszeweski, and A. Madabhushi, “A
Boosted Bayesian Multiresolution Classifier for Prostate Cancer Detection From Digitized Needle Biopsies,” IEEE Trans. Biomed.
Eng., vol. 59, no. 5, pp. 1205–1218, 2012.
[23] E. Alexandratou, V. Atlamazoglou, T. Thireou, G. Agrogiannis, D. Togas, N. Kavantzas, E. Patsouris, and D. Yova, “Evaluation of
machine learning techniques for prostate cancer diagnosis and Gleason grading,” International Journal of Computational
Intelligence in Bioinformatics and Systems Biology, vol. 1, no. 3. pp. 297–315, 2010.
[24] P.-W. Huang and C.-H. Lee, “Automatic classification for
pathological prostate images based on fractal analysis.,” IEEE
Trans. Med. Imaging, vol. 28, no. 7, pp. 1037–50, Jul. 2009. [25] C. M. Lopez and S. Agaian, “A new set of wavelet- and
fractals-based features for Gleason grading of prostate cancer histopathology images,” in Proceedings SPIE-IS&T Electronic
Imaging (Burlingame, CA), 2013, vol. 8655, p. 865516.
[26] J. Diamond, N. Anderson, P. Bartels, Peter H, Montironi, Rodolfo, and P. W. Hamilton, “The use of morphological characteristics and
texture analysis in the identification of tissue composition in prostatic neoplasia,” Hum. Pathol., vol. 35, no. 9, pp. 1121–1131,
Sep. 2004.
[27] Haralick RM and Shapiro LG, Computer and robot vision. Addison-Wesley, 1992.
[28] R. Farjam, S.-Z. Hamid, J.-K. Kourosh, and Z. Reza, “An Image
Analysis Approach for Automatic Malignancy Determination of Prostate Pathological Images,” Cytometry Part B :Clinical
Cytometry, vol. 85, no. 4, pp. 227–240, 2007.
[29] S. Naik, S. Doyle, S. Agner, A. Madabhushi, M. Feldman, and J. Tomaszewski, “Automated gland and nuclei segmentation for
grading of prostate and breast cancer histopathology,” In 5th IEEE
International Symposium on Biomedical Imaging: From Nano to Macro, 2008, p. 284.
[30] Y. Peng, Y. Jiang, L. Eisengart, M. a Healy, F. H. Straus, and X. J. Yang, “Computer-aided identification of prostatic adenocarcinoma:
Segmentation of glandular structures,” J. Pathol. Inform., vol. 2, no.
33, pp. 1–10, Jan. 2011.
[31] C. Cortes and V. Vapnik, “Support-Vector Networks,” Mach. Learn., vol. 297, no. 20, pp. 273–297, 1995.
[32] C.-C. Chang and C.-J. Lin, “LIBSVM: A library for support vector
machines,” ACMTransactions Intell. Syst. Technol., vol. 2, no. 27,
pp.1–27, 2011.
[33] N. V Chawla and J. Sylvester, “Exploiting Diversity in Ensembles:
Improving the Performance on Unbalanced Datasets,” Mult. Classif.
Syst., vol. 4472, pp. 397–406, 2007.
[34] R. Polikar, “Ensemble based systems in decision making,” IEEE CIRCUITS Syst. Mag., vol. 6, no. 3, pp. 21–45, 2006.
[35] Y. Chen, X. Zhao, and Z. Lin, “Optimizing subspace SVM ensemble
for hyperspectral imagery classification,” IEEE J. Sel. Top. Appl.
![Fig. 1 The general architecture of the typical CAD system for PCa [8]](https://thumb-us.123doks.com/thumbv2/123dok_us/10049734.1991398/1.595.309.555.593.679/fig-general-architecture-typical-cad-pca.webp)