R E S E A R C H A R T I C L E
Open Access
Validation and development of a shorter version
of the resilience scale RS-11: results from the
population-based KORA
–
age study
Alexander von Eisenhart Rothe
1, Markus Zenger
2, Maria Elena Lacruz
3, Rebecca Emeny
1, Jens Baumert
1,
Sibylle Haefner
1and Karl-Heinz Ladwig
1*Abstract
Background:The aim of this study was to assess reliability and validity of the Resilience Scale 11 (RS-11) and develop a shorter scale in a population-based study.
Methods:The RS-11 scale was administered to 3942 participants (aged 64–94 years) of the KORA-Age study. To test reliability, factor analyses were carried out and internal consistency (Cronbach’sα) was measured. Construct validity was measured by correlating scores with psychological constructs. The criterion for a shorter scale was a minimum internal consistency of .80. Shorter models were compared using confirmatory factor analysis. Sensitivity and specificity of RS-5 to RS-11 was analyzed.
Results:Factor analysis of the RS-11 gave a 1-factor solution. Internal consistency wasα= .86. A shorter version of the scale was developed with 5 items, which also gave a 1-factor solution and showed good validity. Internal consistency of this shorter scale: Resilience Scale 5 (RS-5) wasα= .80. Sensitivity and specificity of RS-5 compared with RS-11 were .79 and .91 respectively. Both scales correlated significantly in expected directions with related constructs.
Conclusions:The RS-11 and the RS-5 are reliable, consistent and valid instruments to measure the ability of elderly individuals to successfully cope with change and misfortune.
Keywords:Resilience, Psychometrics, Mental health, Aging
Background
“Resilience” (or psychosocial stress-resistance) is the term used to describe a person’s capability to adapt posi-tively to adverse conditions (Luthar et al. 2000).
Studies suggest that resilient elderly have better mental health (Hardy et al. 2002; Wagnild 2003), less depression in late life (Mehta et al. 2008) and that resilience corre-lates with self-rated successful aging (Lamond et al. 2008), better health outcomes (Smith 2006) and survival of the elderly (Shen & Zeng 2010). Furthermore, it has been demonstrated a tendency that resilient persons
suffering from diabetes have better glycosylated haemo-globin (Steinhardt et al. 2009; Yi et al. 2008).
The “Resilience Scale”, (Wagnild & Young 1993), de-scribes resilience as being a positive personality trait which facilitates personal adaptation, i.e. coping with change or misfortune. Construct validity for versions of the Resili-ence scale has been measured by correlations with depres-sion, physical health, life satisfaction, morale, anxiety, stress and health promoting activities (Heilemann et al. 2003; Ahern et al. 2006; Abiola & Udofia 2011).
In this study we aimed to assess the reliability and valid-ity of the German version of the resilience scale (RS-11) (Schumacher et al. 2005) and subsequently we aimed to develop a shorter version of the scale in a large, elderly German population. In large cohort studies it is not possible to include many lengthy questionnaires, this holds particularly true in studies of older individuals. * Correspondence:[email protected]
1Helmholtz Zentrum München, German Research Center for Environmental
Health, Institute of Epidemiology II, Ingolstädter Landstr. 1, Neuherberg 85764, Germany
Full list of author information is available at the end of the article
Thus, there is an urgent need for short-scales, particu-larly with regard to resilience, for which population-based research is lacking. The inclusion of the concept in large, population-based studies will allow for analysis of the effects of fostering resilience, and analysis into how this concept might fit within the ever increasingly understood mechanisms of psychosocial factors on health. The development of an abbreviated version should encourage the inclusion of the instrument in large cohort studies and reduce missing data. The main hypothesis to be tested is that the short version of the RS-11, which must have a good internal consistency, will demonstrate acceptable model fit indices as com-puted with confirmatory factor analysis (CFA).
Methods Sample
Data was taken from the KORA (Cooperative Research in the Region of Augsburg) - Age study (2008–2009) (Lacruz et al. 2010; Peters et al. 2011), which is a follow-up study of older participants from the population-based MONICA(MOnitoring Trends and Determinants in CArdiovascular Disease )/KORA Augsburg studies. The local authorities approved the study and all participants provided written informed consent. The study protocol was submitted and approved by the Ethical Committee of the Bavarian medical association (Ethik- Kommission Nr. 08064). More information about the study design of KORA is given elsewhere (Holle et al. 2005).
The KORA-Age study involved a follow-up health questionnaire administered to all participants of the co-hort who were born between 1915 and 1943 (n = 4565; response rate = 76%); a telephone interview to determine multimorbidity and mental health status of the partici-pants (N = 4127; response rate = 69%), and medical ex-aminations and personal interviews to a sub-sample of the cohort (n = 1079; response rate = 54%).
The RS-11 was administered in the telephone interview. We excluded participants who did not answer the tele-phone interview themselves (n = 185) and those with cog-nitive impairment (n = 146) as determined with TICS-m (Telephone interview for cognitive status – modified) (Breitner & Welsh 1995; Crooks et al. 2005; Perneczky 2003) using a cut off value of 27 (Knopman et al. 2010).
Eighty-four participants with missing values on the re-silience scale were excluded. Excluded participants were more likely to be older (OR = 4.54, 95% CI: 2.55–8.09), reporting any disability (OR = 3.15, 95% CI: 1.96–5.08), not living alone (OR = 2.17, 95% CI: 1.41–3.35), to have low self-rated health (OR = 2.25, 95% CI: 1.46 – 3.49), low well-being (OR = 2.79, 95% CI: 1.1 – 7.08) and de-pressed mood (OR = 3.64, 95% CI: 1.43 – 9.3). No sig-nificant differences were found in distributions of sex, loneliness or anxiety.
Thus, the analyzed study sample consisted of 3 712 participants (52% women, 48% men). Age ranged from 64 to 94 years (median = 72; mean = 73; SD ± 5.8).
Measures
Resilience was measured using the German RS-11 scale (see Additional file 1) (Schumacher et al. 2005). The RS-25 has an internal consistency of .91. The scale has a 2-factor structure. These are titled“Personal Competence” and“Acceptance of Self and Life”. Construct validity was assessed by correlations with depression (r =−.37), phys-ical health (r =−.26), life satisfaction (r = .30) and morale (r = .28) (Wagnild & Young 1993). Since their develop-ment, RS scales have been validated in a wide range of populations including adolescents (Hunter & Chandler 1999; Black & Ford-Gilboe 2004) and older populations (Wagnild 2003) and in many different ethnicities and languages, reporting internal consistencies ranging from .72 to .94 (Ahern et al. 2006; Abiola & Udofia 2011; Ruiz-Parraga et al. 2012; Damasio et al. 2011).
The abbreviated German RS-11 was developed in 2,031 participants of a large community sample of the German population (aged 14 to 95). A 1-factor structure was reported. The internal consistency of this scale was shown to be excellent with α= .91 (Schumacher et al. 2005). The RS-11 score is calculated by summing up the values 1 (=strongly disagree) to 7 (=strongly agree) across all eleven questions. The resulting sum score thus ranges from 11 to 77, where higher scores represent greater resilience. In the present analysis, subjects in the top third of the resilience scale distribution were defined as resilient.
Depression was measured using the GDS-15 (Geriatric Depression Scale) from Sheikh and Yesavage (Sheikh & Yesavage 1985). This scale is comprised of 15 dichotom-ous items. In this study, participants with a score equal to or above 10 were classified as depressed.
The German version of the Generalized Anxiety Dis-order scale (GAD-7) was used to determine feelings of anxiousness. The scale consists of 7 items on a 4-point Likert scale. The resulting score ranges from 0 to 21 (Spitzer et al. 2006). Participants with a score above or equal to 10 were classified as anxious, following (Kroenke et al. 2007).
being was measured using the WHO-Five Well-being Index. This is a five-item questionnaire on a 6-point Likert scale (0 = not present to 5 = constantly present) which is translated into a score ranging from 0 to 100. Higher scores mean higher well-being. Partici-pants with a score below 25 screened negative for well-being (Bech 2004).
(Berkman 1982) and is detailed and reproduced in the WHO: MONICA Psychosocial Optional Study (MOPSY) (WHO 1989). The SNI collects information on 12 types of social relationships. The scores of this index range from 1 to 4, with higher scores representing greater so-cial network (WHO 1989). A dichotomous outcome was built to determine high vs. low social network.
Loneliness was measured by a shortened, German ver-sion of the UCLA-Loneliness-Scale which assesses sub-jective feelings of loneliness or social isolation (Russell et al. 1980). The scale consists of 12 items leading to a score ranging from 12 to 48. Higher scores indicate greater degrees of loneliness (Russell 1996). Subjects in the top third of the Loneliness-scale distribution were classified as being lonely.
Self-rated health was measured by a one-item ques-tion: respondents were asked,“How would you rate your current state of health?” Those who answered “very good”or“good”were classified as having good self-rated health.
Physical disability was measured using the Health As-sessment Questionnaire Disability Index (HAQ-DI) (Bruce & Fries 2003). The outcome of the index is con-tinuous and ranges from 0 to 3, where a score of 0 to1 represents mild/moderate disability, 1 to 2 moderate and 2 to 3 severe disability. Respondents with scores = 0 were classified as reporting no disability, and those with scores > 0 being classified as reporting any disability.
An age-specific median-split variable was determined (participants aged 72 years or older were classified as older). Age was additionally stratified in groups of five years. Due to small numbers in the oldest groups, these were summarized together. Thus, the four categories were defined as follows: 64–69, 70–74, 75–79 and 80 + .
Statistical analyses Descriptive analysis
The distribution of the RS-11 score was found to be non-normal (p = 0.01), using the Shapiro-Wilk test, even after taking the logarithm transformation. The Mann–Whitney U and Kruskal-Wallis tests were used to compare continuous variables with two, or more than two groups, respectively.
Validation of RS-11
The study population was split into two equal sized random samples. No significant differences were found between both random samples regarding all items of the questionnaire and socio-demographic variables (all p-values > .07).
In the first random sample (N = 1,856), an exploratory factor analysis (EFA) of the RS-11 was conducted using the principal axis factors method (extracting factors via the Kaiser criterion) and internal consistency (Cronbach’s α),
average variance extracted (AVE) and composite reli-ability (CR) were calculated to explore the relireli-ability and validity of RS-11 in an older population. To assess con-struct validity the scale was correlated (Spearman coeffi-cient) with variables related to the construct of resilience, based on previous studies (Wagnild & Young 1993; Wagnild 2009). In the second random sample (N = 1,856), a CFA was computed to test the unidimensional structure reported in a population-based study (Schumacher et al. 2005).
Development and validation of a shorter scale
The main criteria for the shortened scale is a good Cronbach’s alpha value (≥.80) (Gliem & Gliem 2003). Al-though the originally postulated 2-factor structure is ques-tionable (Schumacher et al. 2005; Windle et al. 2011), it is preferable that the new scale contains at least one item from each of the originally postulated dimensions. The
“alphamax” macro was used (Hayes 2005) to establish combinations of items which result in a good Cronbach’s alpha (≥.80). In the second random sample, CFA was used to compare potential abbreviated questionnaire models. The CFA models were estimated with the maximum likeli-hood method approach, and the following fit indices were used: CMIN/DF, CFI, GFI, RMSEA, TLI and AIC.
Additional analyses were conducted to test the invari-ance of the model across gender and age using multi-group CFA. Measurement invariance was tested in three steps using first the configural model (no constraints), then a metric invariant model (with item loadings con-straint to be equal across groups), and then a scalar in-variant model (with item loadings and item intercepts simultaneously constraint to be equal across groups) (Gregorich 2006). Following the hierarchy of these nested models, they were compared to each other. Since the < chi > 2 statistic has often been criticized for its sen-sitiveness to the sample size, we focused mainly onΔCFI
and ΔRMSEA as indicators in the comparison of
models. Values smaller than .01 indicate invariance of the models (Cheung & Rensvold 2002).
Furthermore, the chosen model was subjected to a sensitivity/specificity analysis in the full dataset, to calcu-late to what extent participants would be categorized as resilient when considering the top tertiles of both sum score distributions to be resilient. The Youden’s index was calculated for subgroups of related sociodemo-graphic and psychological variables. A score of above 0.6 indicates a sufficient ability to discriminate (Hilden & Glasziou 1996). The shortened scale should have a satis-factory Youden’s Index when compared to the original scale, and should correlate strongly with the RS-11. Additionally, AVE and CR were measured.
performed with the statistical software package SAS (Version 9.1, SAS-Institute Inc., Cary, NC, USA), and AMOS 18 (Arbuckle 2009).
Results
Descriptive analysis
In the whole study population (n = 3 712) the RS-11 sum score distribution had a mean of 61.8, a median of 63, and a skewness of -.91. No median differences in re-silience scores between males and females (p = .520) were found. Median resilience scores differed between the younger (<72 years) and older (≥72 years) partici-pants (p < .001).
The Kruskal-Wallis test for all participants showed sig-nificant differences among age groups (p < .001). This indi-cates a trend that persons in older age groups were less resilient. This result was confirmed in a stratified analysis of the female (p < .001) and the male groups (p = .008).
RS-11: reliability and validity
The factor analysis revealed a 1-factor solution prior to rotation via the Kaiser criterion, and scree plot analysis (data not shown). The factor loadings for each item ranged from r = .46 to r = .72. Inter-correlations between items ranged from r = .24 to r = .61 (p < .001). The in-ternal consistency of the RS-11 scale was good (α= .86). AVE for the RS-11 was 19.6% and CR was .76.
Resilience was negatively correlated with depression (r =−.40), anxiety (r =−.32), loneliness (r =−.37), dis-ability (r =−.26), and positively with self-rated health (r = .27) and well-being (r = .36). All correlations were significant (p < .001).
Results of the CFA are given in Table 1. None of the fit indices indicated a good model fit. Thus the unidi-mensional model of the RS-11 does not fit the data ana-lyzed in this study.
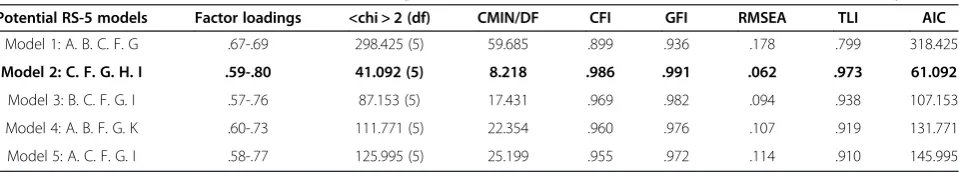
Development of a shorter scale: RS-5
The“alphamax”macro determined that a minimum of five questions are required to build a scale with a Cronbach’s α> .80. Table 2 lists the 5 possible 5-item scales, which fulfill the internal consistency criteria. Questions G and C are similarly worded, yet they revealed an inter-correlation of r = .60, which is too weak to warrant the exclusion of ei-ther question.
The EFAs of the 5 models revealed a 1-factor solution in each case. This single factor explained 56-58% of the variance.
The uni-dimensional factor solution found in the EFA was subsequently tested for all five shorter versions using CFA, based on the second sub-sample with N = 1,856 participants. Table 2 shows the fit indices and fac-tor loadings of the different 5-item-scales. Regarding all fit indices, model 2 shows the best values in comparison to all other models. Furthermore, the model with the lowest AIC should be preferred, as was the case for model 2. Table 3 summarises all Resilience Scale models. Regarding model 2, all but one fit measure indicated an excellent model fit. The value of CMIN/DF indicates a bad fit, which means a relevant deviation between the data and the model.
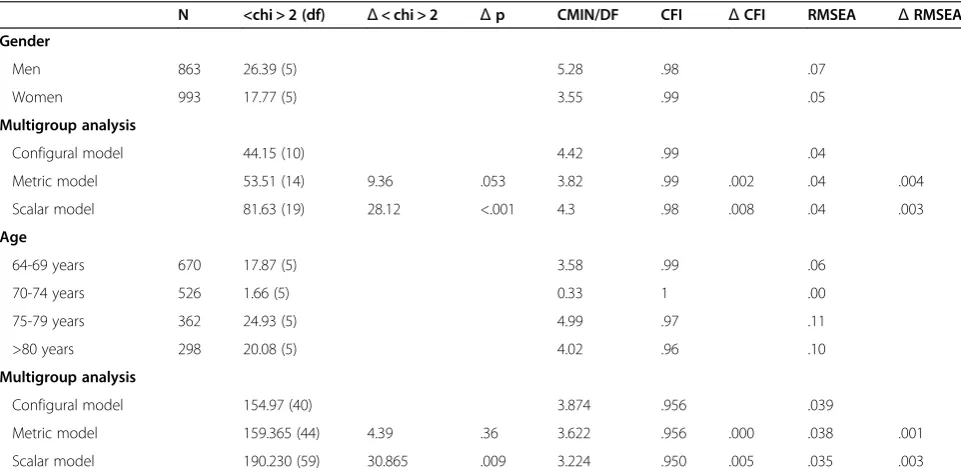
Model 2 was tested for invariance across gender and age. As shown in Table 4, the multi-group analyses re-vealed the invariance of the models across sex and age, because the differences of CFI and RMSEA between the hierarchical nested models are smaller than .01. The < chi > 2 test was nonsignificant for the test of metric in-variance, but significant for the test of scalar invariance.
RS-5: reliability and validity
Model 2 (including questions C, F, G, H, I) was found to be the best of the tested 5 item versions and further ana-lyses were conducted with this shortened instrument in the full dataset.
For each scale (RS-5 and RS-11) the top tertile of the distribution was classified as resilient to test sensitivity and specificity. There were 221 false positives and 285 false negatives. Falsely classified participants were more likely anxious (OR = 1.5, 95% CI = 1.01 – 2.23) and not lonely (OR = 1.89, 95% CI = 1.24–2.87). Furthermore, it
Table 1 CFA of the RS-11 - factor loadings and fit indices (N = 1,856)
Factor loadings <chi > 2 (df) CMIN/DF CFI RMSEA TLI
RS-11 .47-.69 709.219 (44) 16.119 .899 .090 .874
Table 2 CFA of abbreviated models–factor loadings and fit indices of 5-item-scales with an internal consistency≥80
Potential RS-5 models Factor loadings <chi > 2 (df) CMIN/DF CFI GFI RMSEA TLI AIC
Model 1: A. B. C. F. G .67-.69 298.425 (5) 59.685 .899 .936 .178 .799 318.425
Model 2: C. F. G. H. I .59-.80 41.092 (5) 8.218 .986 .991 .062 .973 61.092
Model 3: B. C. F. G. I .57-.76 87.153 (5) 17.431 .969 .982 .094 .938 107.153
Model 4: A. B. F. G. K .60-.73 111.771 (5) 22.354 .960 .976 .107 .919 131.771
Model 5: A. C. F. G. I .58-.77 125.995 (5) 25.199 .955 .972 .114 .910 145.995
Abbreviations: A to I = item number, see Table1; df = Degrees of freedom; CMIN/DF = Minimum discrepancy, divided by its degrees of freedom;
distinguished satisfactorily between participants classi-fied as resilient and non-resilient by the RS-11 in all sub-groups (Youden’s index ranged from .61 to .77) except in the depressed subgroup.
The RS-5 revealed an internal consistency of α= .80. The single factor explained 57% of the total variance. Factor loadings for items of the RS-5 scale ranged from .61 – .71, inter-item correlations ranged from .39– .61 (all p < .001). AVE was 25.9% and CR was .70.
The RS-5 scale correlated negatively with the GDS-15 scale (r =−.34), the GAD-7 scale (r =−.29), the loneliness scale (r =−.33), the HAQ-DI (r =−.17), and positively with self rated health (r = .21), all p < .001. The RS-5 cor-related strongly with the RS-11 (r = .89, p < .001).
Discussion
This study has several key findings. Firstly, the validity and reliability of the 11-item Resilience scale (RS-11) as an in-strument to measure resilience was confirmed in a large, elderly population. Secondly, a shorter scale with good re-liability and validity was developed.
Reliability and validity of the RS-11 scale
The RS-11 scale was shown to have good internal consistency (α= .86) which is slightly lower than in Schumacher’s analysis (α= .91) (Schumacher et al. 2005). This study reflects previous studies, which showed RS-11 to be a valid instrument compared with the original RS-25 (Schumacher et al. 2005; Rohrig et al. 2006).
Factor loadings for all items of the RS-11 scale were above .50 (except for item d), which indicates that these items loaded significantly to a single factor (Hair et al. 1998).
Correlations with related variables were weak (r = 0.26 -0.4), but all in the same range as was found in other stud-ies (Wagnild 2009); (Ahern et al. 2006; Schumacher et al. 2005; Wagnild & Collins 2009).
Thus, the unidimensional RS-11, whose validity and reli-ability as a scale to measure resilience in a population-based sample with a wide age range (14 to 95) has already been shown, has now been confirmed in a population-based sample of elderly individuals (aged 64 to 94).
Reliability and validity of the RS-5 scale
A shorter scale was developed to encourage its inclusion in large cohort studies and studies in older populations.
Table 3 Summary of constructs
Construct Mean Standard deviation
Cronbach’s Alpha
Correlation to RS-11
RS-11 61.8 10.14 .86
RS-5 Model 1
29.27 5.02 .81 .91
RS-5 Model 2
28.88 4.96 .80 .91
RS-5 Model 3
28.94 4.9 .80 .92
RS-5 Model 4
28.94 5.09 .80 .92
RS-5 Model 5
28.93 5.01 .80 .92
Table 4 Test for invariance across gender and age for model 2
N <chi > 2 (df) Δ< chi > 2 Δp CMIN/DF CFI ΔCFI RMSEA ΔRMSEA
Gender
Men 863 26.39 (5) 5.28 .98 .07
Women 993 17.77 (5) 3.55 .99 .05
Multigroup analysis
Configural model 44.15 (10) 4.42 .99 .04
Metric model 53.51 (14) 9.36 .053 3.82 .99 .002 .04 .004
Scalar model 81.63 (19) 28.12 <.001 4.3 .98 .008 .04 .003
Age
64-69 years 670 17.87 (5) 3.58 .99 .06
70-74 years 526 1.66 (5) 0.33 1 .00
75-79 years 362 24.93 (5) 4.99 .97 .11
>80 years 298 20.08 (5) 4.02 .96 .10
Multigroup analysis
Configural model 154.97 (40) 3.874 .956 .039
Metric model 159.365 (44) 4.39 .36 3.622 .956 .000 .038 .001
Scalar model 190.230 (59) 30.865 .009 3.224 .950 .005 .035 .003
With regard to the RS-11, being over 72 years old was associated with missing data (OR = 4.54, 95% CI: 2.55 – 8.09). A shorter scale should be less cognitively challen-ging and easier to administer.
The abbreviated RS-5 satisfies the a priori conditions set. CFA of the new RS-5 has confirmed the uni-dimensionality of the questionnaire. All but one fit index indicated that the model fits the data very well. This measure (<chi > 2) is, however, sensitive to sample size. Even a small misspecification would lead to the rejection of the model, and thus we focused on the other fit indi-ces. The RS-5 showed good Youden’s indices for all ana-lyzed subgroups except the depressed subgroup, which had a very small number of cases (n = 65). The RS-5 also correlated strongly with the RS-11 (r = .89, p < .001). The evidence gathered in the development of the RS-11 (Schumacher et al. 2005) put the original 2-factor struc-ture under question. Indeed, a recent review has
ques-tioned the methodology behind these dimensions
(Windle et al. 2011). Nonetheless, content validity based on the original RS-25 has been preserved, as at least one item from the two originally postulated factor dimen-sions are represented in the abbreviated scale. Addition-ally, the measurement invariance of the RS-5 was shown for gender and age, which allows direct comparisons of means between males and females as well as between different age groups.
In conclusion, the RS-5 reproduces the good psycho-metric properties of the RS-11 in a large, elderly, population-based sample of the German population. Thus, the RS-5 offers a short and easily administered questionnaire, which may be advantageous in large co-hort studies with extensive tests for participants and in studies with older individuals.
Study limitations
Due to the cross-sectional design of this study it was not possible to calculate test-retest reliability of either the RS-5 or the RS-11. No concurrent validity was measur-able in this study since no other instrument measuring resilience was included. An optimal assessment of resili-ence would be conducted via clinical interview; however, for the purposes of large cohort studies, the telephone interview is the preferred method.
Future aims
Further investigations regarding the test-retest reliability and the potential for use in other ethnic groups of both the RS-11 and RS-5 scales are warranted. Validation of the RS-5 in younger age groups is also desirable. The shortened RS-5 scale was incorporated into the next stage of the KORA – Age cohort study, allowing for a wide range of longitudinal analyses to determine predic-tors for and health outcomes of resilience.
Conclusions
In conclusion, the RS-11 and RS-5 were shown to be valid and reliable instruments to measure resilience in an elderly German population. The RS-5 displays excel-lent model fit statistics and distinguishes well between participants classed as resilient by the RS-11 and is thus a highly recommended scale for measuring resilience.
Additional file
Additional file 1:Resilience was measured using the German RS-11 scale.
Abbreviations
RS-11:Resilience scale–11 items; CFA: Confirmatory factor analysis; KORA: Kooperative Gesundheitsforschung in der region Augsburg; MONICA: MOnitoring trends and determinants in cardiovascular disease; TICS-m: Telephone interview for cognitive status - modified; OR: Odds ratio; CI: Confidence interval; RS-25: Resilience Scale–25 items; GDS-15: Geriatric depression scale−15 items; GAD-7: Generalized anxiety disorder scale; WHO: World health organization; SNI: Social network Index; MOPSY: WHO: MONICA psychosocial optional study; HAQ-DI: Health assessment questionnaire disability index; EFA: Exploratory factor analysis; AVE: Average variance extracted; CR: Composite reliability; CMIN/DF: Minimum discrepancy, divided by its degrees of freedom; CFI: Comparative-fit index; GFI: Goodness-of-fit-index; RMSEA: Root mean square error of approximation; TLI: Tucker-Lewis-index; AIC: Akaike information criterion.
Competing interests
The authors declare that they have no competing interests.
Authors’contributions
All authors made substantial contributions to conception, design and analysis/interpretation of data. KHL conceived the study and participated in its design and coordination and helped to draft the manuscript. The first draft of the paper was written by AvER. RTE, SH and KHL were involved in drafting the manuscript or revising it critically for important intellectual content. AvER, MZ, JB and MEL were involved in drafting the manuscript and performed statistical analyses. All authors read and approved the final manuscript.
Acknowledgements
The KORA research platform (KORA, Cooperative Research in the Region of Augsburg) was initiated and financed by the Helmholtz Zentrum München -German Research Center for Environmental Health, which is funded by the German Federal Ministry of Education and Research and by the State of Bavaria. The KORA-Age project was financed by the German Federal Ministry of Education and Research (BMBF FKZ 01ET0713) as part of the‘Health in old age’ program.
Author details 1
Helmholtz Zentrum München, German Research Center for Environmental Health, Institute of Epidemiology II, Ingolstädter Landstr. 1, Neuherberg 85764, Germany.2Department of Medical Psychology and Medical Sociology, University of Leipzig, Philipp-Rosenthal-Str. 55, Leipzig 04103, Germany. 3
Institute of Clinical Epidemiology, Martin-Luther University Halle-Wittenberg, Halle (Saale), Germany.
Received: 15 February 2013 Accepted: 14 November 2013 Published: 22 November 2013
References
Abiola, T, & Udofia, O. (2011). Psychometric assessment of the Wagnild and Young’s resilience scale in Kano. Nigeria.BMC Research Notes, 4, 509. Ahern, NR, Kiehl, EM, Sole, ML, & Byers, J. (2006). A review of instruments
Bech, P. (2004). Measuring the dimensions of psychological general well-being by the WHO-5.QoL Newsletter, 32, 15–16.
Berkman, LF. (1982). Social network analysis and coronary heart disease.Advances in Cardiology, 29, 37–49.
Black, C, & Ford-Gilboe, M. (2004). Adolescent mothers: resilience, family health work and health-promoting practices.Journal of Advanced Nursing, 48, 351–360. Breitner, JC, & Welsh, KA. (1995). Diagnosis and management of memory loss and
cognitive disorders among elderly persons.Psychiatric Services, 46, 29–35. Bruce, B, & Fries, JF. (2003). The stanford health assessment questionnaire:
dimensions and practical applications.Health and Quality of Life Outcomes, 1, 20. Cheung, GW, & Rensvold, RB. (2002). Evaluating goodness-of-fit indexes for testing
measurement invariance.Struct Equation Model: Multidiscip J, 9, 233–255. Crooks, VC, Clark, L, Petitti, DB, Chui, H, & Chiu, V. (2005). Validation of multi-stage
telephone-based identification of cognitive impairment and dementia.
BMC Neurology, 5, 8.
Damasio, BF, Borsa, JC, & da Silva, JP. (2011). 14-item resilience scale (RS-14): psychometric properties of the Brazilian version.Journal of Nursing Measurement, 19, 131–145.
Gliem, JA, & Gliem, RR. (2003). Calculating, Interpreting, and Reporting Cronbach’s Alpha Reliability Coefficient for Likert-Type Scales. In2003 Midwest Research to Practice Conference in Adult, Continuing, and Community Education. Columbus, OH: The Ohio State University.
Gregorich, SE. (2006). Do self-report instruments allow meaningful comparisons across diverse population groups? Testing measurement invariance using the confirmatory factor analysis framework.Medical Care, 44, S78–S94.
Hair, JF, Tatham, RL, Anderson, RE, & Black, WC. (1998).Multivariate Data Analysis
(5th ed.). Prentice Hall: Upper Saddle River.
Hardy, SE, Concato, J, & Gill, TM. (2002). Stressful life events among community-living older persons.Journal of General Internal Medicine, 17, 841–847.
Hayes, AF. (2005).A Computational Tool for Survey Shortening Applicable to Composite Attitude, Opinion, and Personality Measurement Scales. Chicago, IL: In Meeting of the Midwestern Association for Public Opinion Research. Heilemann, MV, Lee, K, & Kury, FS. (2003). Psychometric properties of the Spanish
version of the resilience scale.Journal of Nursing Measurement, 11, 61–72. Hilden, J, & Glasziou, P. (1996). Regret graphs, diagnostic uncertainty and
Youden’s Index.Statistics in Medicine, 15, 969–986.
Holle, R, Happich, M, Lowel, H, Wichmann, HE, & Group, MKS. (2005). KORA–a research platform for population based health research.Gesundheitswesen, 67(Suppl 1), S19–S25.
Hunter, AJ, & Chandler, GE. (1999). Adolescent resilience.Image - The Journal of Nursing Scholarship, 31, 243–247.
Knopman, DS, Roberts, RO, Geda, YE, Pankratz, VS, Christianson, TJ, Petersen, RC, & Rocca, WA. (2010). Validation of the telephone interview for cognitive status-modified in subjects with normal cognition, mild cognitive impairment, or dementia.Neuroepidemiology, 34, 34–42.
Kroenke, K, Spitzer, RL, Williams, JB, Monahan, PO, & Lowe, B. (2007). Anxiety disorders in primary care: prevalence, impairment, comorbidity, and detection.Annals of Internal Medicine, 146, 317–325.
Lacruz, ME, Emeny, RT, Bickel, H, Cramer, B, Kurz, A, Bidlingmaier, M, Huber, D, Klug, G, Peters, A, & Ladwig, KH. (2010). Mental health in the aged: prevalence, covariates and related neuroendocrine, cardiovascular and inflammatory factors of successful aging.BMC Medical Research Methodology, 10, 36.
Lamond, AJ, Depp, CA, Allison, M, Langer, R, Reichstadt, J, Moore, DJ, Golshan, S, Ganiats, TG, & Jeste, DV. (2008). Measurement and predictors of resilience among community-dwelling older women.Journal of Psychiatric Research, 43, 148–154.
Luthar, SS, Cicchetti, D, & Becker, B. (2000). The construct of resilience: a critical evaluation and guidelines for future work.Child Development, 71, 543–562. Mehta, M, Whyte, E, Lenze, E, Hardy, S, Roumani, Y, Subashan, P, Huang, W, &
Studenski, S. (2008). Depressive symptoms in late life: associations with apathy, resilience and disability vary between young-old and old-old.
International Journal of Geriatric Psychiatry, 23, 238–243.
Perneczky, R. (2003). The appropriateness of short cognitive test for the identification of mild cognitive impairment and mild dementia.
Aktuelle Neurologie, 30, 114–117.
Peters, A, Doring, A, Ladwig, KH, Meisinger, C, Linkohr, B, Autenrieth, C, Baumeister, SE, Behr, J, Bergner, A, Bickel, H, et al. (2011). [Multimorbidity and successful aging: the population-based KORA-Age study].Zeitschrift für Gerontologie und Geriatrie, 44(2), 41–54.
Rohrig, B, Schleussner, C, Brix, C, & Strauss, B. (2006). [The Resilience Scale (RS): a statistical comparison of the short and long version based on a patient
population].Psychotherapie, Psychosomatik, Medizinische Psychologie, 56, 285–290.
Ruiz-Parraga, GT, Lopez-Martinez, AE, & Gomez-Perez, L. (2012). Factor structure and psychometric properties of the resilience scale in a spanish chronic musculoskeletal pain sample.The Journal of Pain, 13, 1090–1098. Russell, DW. (1996). UCLA Loneliness Scale (Version 3): reliability, validity, and
factor structure.Journal of Personality Assessment, 66, 20–40.
Russell, D, Peplau, LA, & Cutrona, CE. (1980). The revised UCLA Loneliness Scale: concurrent and discriminant validity evidence.Journal of Personality and Social Psychology, 39, 472–480.
Schumacher, J, Leppert, K, Gunzelmann, T, Strauß, B, & Brähler, E. (2005). Die Resilienzskala - Ein Fragebogen zur Erfassung der psychischen Widerstandsfähigkeit als Persönlichkeitsmerkmal.Z Klin Psychol, Psychiatrie, Psychotherapie, 53, 16–39.
Sheikh, JI, & Yesavage, JA. (1985). A knowledge assessment test for geriatric psychiatry.Hospital & Community Psychiatry, 36, 1160–1166.
Shen, K, & Zeng, Y. (2010). The association between resilience and survival among Chinese elderly.Demographic Research, 23, 105–116. Smith, TW. (2006). Personality as risk and resilience in physical health.
Current Directions in Psychological Science, 15, 227–231.
Spitzer, RL, Kroenke, K, Williams, JB, & Lowe, B. (2006). A brief measure for assessing generalized anxiety disorder: the GAD-7.Archives of Internal Medicine, 166, 1092–1097.
Steinhardt, MA, Mamerow, MM, Brown, SA, & Jolly, CA. (2009). A resilience intervention in African American adults with type 2 diabetes: a pilot study of efficacy.The Diabetes Educator, 35, 274–284.
Wagnild, G. (2003). Resilience and successful aging. Comparison among low and high income older adults.Journal of Gerontological Nursing, 29, 42–49. Wagnild, G. (2009). A review of the resilience scale.Journal of Nursing
Measurement, 17, 105–113.
Wagnild, GM, & Collins, JA. (2009). Assessing resilience.Journal of Psychosocial Nursing and Mental Health Services, 47, 28–33.
Wagnild, GM, & Young, HM. (1993). Development and psychometric evaluation of the resilience scale.Journal of Nursing Measurement, 1, 165–178.
WHO. (1989).MONICA Psychosocial Optional Study Manual: Suggested Measurement Instruments. Copenhagen: WHO Regional Office for Europe. Windle, G, Bennett, KM, & Noyes, J. (2011). A methodological review of resilience
measurement scales.Health and Quality of Life Outcomes, 9, 8.
Yi, JP, Vitaliano, PP, Smith, RE, Yi, JC, & Weinger, K. (2008). The role of resilience on psychological adjustment and physical health in patients with diabetes.
British Journal of Health Psychology, 13, 311–325.
doi:10.1186/2050-7283-1-25
Cite this article as:von Eisenhart Rotheet al.:Validation and development of a shorter version of the resilience scale RS-11: results from the population-based KORA–age study.BMC Psychology20131:25.
Submit your next manuscript to BioMed Central and take full advantage of:
• Convenient online submission
• Thorough peer review
• No space constraints or color figure charges
• Immediate publication on acceptance
• Inclusion in PubMed, CAS, Scopus and Google Scholar
• Research which is freely available for redistribution