Removing Nitrate from Drinking Water
Salah Abheiri
BSc: Environmental Science
This work is presented for the degree of
Research Master with Training, Murdoch University
School of Environmental Science
I
I declare that this thesis is my own account of my research and
contains as its main content work which has not previously been
submitted for a degree of any tertiary educational institution.
II
Abstract
Water resources in many parts around the world are becoming critical
because of human activity. This leads many countries around the
world to rely more on their groundwater as an essential source of
drinking water. The situation in Libya is critical because there is no
access to surface fresh water. The rainfall rate is very low, but there is
a huge quantity of ground water with good quality (average TDS
around 1030 mg/l) and this leads the country to rely on this water
source. The Great Man-Made River Authority (GMRA) was established
to produce and transfer water from the southern part of the country
(desert) where ground water is available to the northern coastal strip
where most of the population is concentrated. However, the water in
some wells in the East Japal Hassouna (EJH) well-field has a high
nitrate concentration, more than 50 mg/L as NO3-. To solve this problem and reduce the nitrate content to less than the limits of WHO
Guidelines (50 mg/l as NO3- and10 mg/L NO3--N), one of the available techniques of nitrate removal has to be applied. Previous studies have
assessed techniques for nitrate removal from drinking water including
analysis of their efficiency, ease of operation, impact on the
environment and cost of production. Moreover, the characteristics of
ground water (good quality) in the EJH well-field and the potential to
use solar energy during the whole year was considered. Experimental
III
energy to remove nitrate from synthetic water similar to water in EJH
wellfield by operating a RO unit in a closed system and using a single
solar pump to deliver feed water to the RO unit and through the unit
as well. A range of nitrate concentrations treated by applying different
pressures for each nitrate concentration. Nitrate removal percentages
ranged between 78% to 90% depending on the initial nitrate
concentration of feed water and the applied pressure. An ion exchange
experiment was also conducted to remove nitrate from synthetic water
similar to water in the EJH wellfield and from a nitrate solution by
performing column and batch test experiments. Several nitrate
concentrations and contact times were applied. Nitrate removal for the
synthetic water were excellent (100% nitrate removal) but chloride
concentration in the produced water increased over the limits of WHO
guidelines. When the same nitrate concentration (20 mg/L NO3--N) in feed water was applied in both techniques, both of them gave a good
result in terms of nitrate removal capacity as mentioned above.
However, the produced water by ion exchange still contained chloride
concentrations over the limits of WHO guidelines in contrast to
IV
ACKNOWLEDGEMENTS
For his interest and valued guidance I wish to express my
appreciation and thanks to Prof. Goen Ho.
I would like to thank Dr. Stewart Dallas who co-supervised this work
for his valuable advice.
I am grateful to Woodside Company for their sponsorship and
Murdoch Link for their support during this work.
I would like to thank my employer (GMRA) for their support and
enabling me to finish this course.
I acknowledge Geoff and Karin from BW solar company for providing
the Lorentz PS 600 solar pump and the Dow Chemical Company for
providing me with NSR-1 Anion Exchange Resin.
I am thankful to Prof. Nick Costa for his help and support during my
study.
I would like to thank the ETC staff for their support in conducting the
RO experiment.
I would like to thank Mr. Ahmed Ammari for his support in computer
skills.
Finally, a special thanks to my family for their support in particular
V
Table of Contents
1 INTRODUCTION ... 1
1.1 BACKGROUND ... 1
1.2 GREAT MAN-MADE RIVER PROJECT ... 2
1.2.1 Great Man-Made River project Systems ... 4
1.2.2 Hasouna Jeffara System ... 5
1.2.3 Location... 5
1.3 HEALTH EFFECTS OF NITRATES ... 6
1.4 THE RELEVANCE AND NEED FOR THE PROJECT ... 8
1.5 OUTLINE OF THESIS STRUCTURE ... 8
2 LITERATURE REVIEW ... 9
2.1 BACKGROUND ... 9
2.2 ION EXCHANGE ... 10
2.3 REVERSE OSMOSIS... 13
2.3.1 Reverse Osmosis Membrane ... 14
2.4 RENEWABLE ENERGY SOURCES ... 15
2.5 ELECTRODIALYSIS ... 17
2.6 BIOLOGICAL DENITRIFICATION ... 18
2.7 TREATMENT ASSESSMENT ... 19
2.8 CONCLUSION ... 25
3 MATERIALS AND METHODS ... 26
3.1 NITRATE REMOVAL TECHNIQUES ... 26
3.2 CHEMICALS FOR EXPERIMENTS ... 26
3.3 REVERSE OSMOSIS TECHNIQUE ... 26
3.4 3.3.1REVERSE OSMOSIS EXPERIMENT ... 26
3.4.1 3.3.2 Typical RO experiment ... 27
3.4.2 3.3.3 Flow measurements ... 30
3.3.4 Sampling programme ... 30
3.3.5 Power regeneration by PV cells ... 30
3.3.6 Power consumption ... 31
3.5 ION EXCHANGE EXPERIMENT... 31
3.4.1 Regeneration of NSR1 Resin ... 32
3.4.2 Batch test ... 32
3.4.3 Column experiment ... 34
4 RESULTS ... 39
VI
4.1.1 First reverse osmosis experiment 8.3 mg/L NO3- -N concentration ... 39
4.1.2 Second reverse osmosis experiment 15.4 mg/L NO3- -N concentration ... 42
4.1.3 Third reverse osmosis experiment 27.6 mg/L NO3- -N concentration ... 44
4.1.4 Fourth reverse osmosis experiment 35.2 mg/L NO3- -N concentration ... 45
4.1.5 Fifth reverse osmosis experiment 9.6 mg/L NO3- -N concentration ... 46
4.1.6 Sixth reverse osmosis experiment 20.5 mg/L NO3- -N concentration ... 48
4.2 ION EXCHANGE EXPERIMENT ... 49
4.2.1 Column experiment ... 49
4.2.2 Batch tests ... 52
5 DISCUSSION ... 55
5.1 REVERSE OSMOSIS EXPERIMENTS ... 55
5.1.1 Recovery Ratio ... 55
5.1.2 Quality of results ... 55
5.1.3 Permeation constant ... 56
5.2 ION EXCHANGE EXPERIMENT ... 56
5.2.1 Batch tests ... 56
5.2.2 Column experiment ... 57
5.2.3 Comparision between batch test and column experimet (breakthrough point) ... 58
5.3 DISCUSSION OF BOTH TECHNIQUES ... 60
5.3.1 Nitrate removal capacity ... 60
5.3.2 Treated water quality ... 60
5.3.3 Power consumption ... 62
5.3.4 Brine disposal ... 62
5.3.5 Cost of treatment ... 62
5.3.6 Sustainable Environment ... 63
5.3.7 Conclusion ... 63
6 CONCLUSION AND RECOMMENDATIONS ... 64
6.1 CONCLUSION ... 64
VII
List of Tables
TABLE 1: WATER SITUATION IN LIBYA IN 1998 ... 2
TABLE 2 : CURRENT SOURCES MUNICIPAL WATER SUPPLY IN WATER SCARCE COUNTRIES ... 2
TABLE 3: IMPORTANT DETAILS ABOUT GMRA SYSTEMS (SAHLI, 2004) ... 4
TABLE 4 : COMPARISION BETWEEN CONVENTIONAL AND ADVANCED WATER TREATMENT METHODS TO REMOVE INORGANIC IONS... 9
TABLE 5: DESALINATION PRODUCTION AND PERCENTAGE OF VARIOUS PROCESSES IN 2000 (HISHAM, 2002) ... 21
TABLE 6: ENERGY CONSUMPTION PER UNIT OF PRODUCT WATER FOR VARIOUS DESALINATION TECHNIQUES ... 22
TABLE 7: NITRATE CONCENTRATION AND NITRATE REJECTION RATIO AGAINST PRESSURE ... 39
TABLE 8 : THE RELATIONSHIP OF PRESSURE AGAINST FLOW RATES AND RECOVERY RATIO... 40
TABLE 9: PERMEATION CONSTANTS ... 41
TABLE 10: THE RELATIONSHIP BETWEEN NITRATE CONCENTRATION AND PRESSURE ... 42
TABLE 11: THE RELATION BETWEEN PRESSURE AND FLOW RATE ... 43
TABLE 12: PERMEATION CONSTANT VALUES ... 44
TABLE 13 : NITRATE CONCENTRATION AND NITRATE REJECTION RATIO AGAINST PRESSURE ... 45
TABLE 14: FLOW RATES AND RECOVERY RATIO AGAINST PRESSURE ... 45
TABLE 15: NITRATE CONCENTRATION AND REJECTION RATION AGAINST PRESSURE ... 46
TABLE 16 : FLOWRATES AGAINST PRESSURE ... 46
TABLE 17 : NITRATE CONCENTRATION AND NITRATE REJECTION RATIO AGIANST PRESSURE ... 47
TABLE 18 : FLOW RATES AND PRESSURE RELATIONSHIPS... 47
TABLE 19 : NITRATE CONCENTRATION AND NITRATE REJECTION RATIO AGIANST PRESSURE ... 48
TABLE 20 : FLOW RATES AND PRESSURE RELATIONSHIPS... 48
TABLE 21 : NITRATE REMOVAL (GR) AND FEED WATER TREATED VOLUMES (L) IN COLUMN EXPERIMENTS... 52
TABLE 22 : BATCH TEST OF ION EXCHANGE ... 53
TABLE 23 : BATCH TEST OF HIGH NITRATE CONCENTRATION ... 53
VIII
List of Figures
FIGURE1:A MAP OF LIBYA SHOWING GMRA WELLFIELDS (ABDELGADER 2009)... 3
FIGURE 2:OSMOSIS AND REVERSE OSMOSIS (ELYANOW,2005) ...13
FIGURE 3:RO EXPERIMENT ...27
FIGURE 4:ION EXCHANGE EXPERIMENT ...34
FIGURE 5:RELATIONSHIP BETWEEN PRESSURE AND NITRATE REJECTION RATIO ...40
FIGURE 6:RELATION OF RECOVERY RATIO WITH PRESSURE ...41
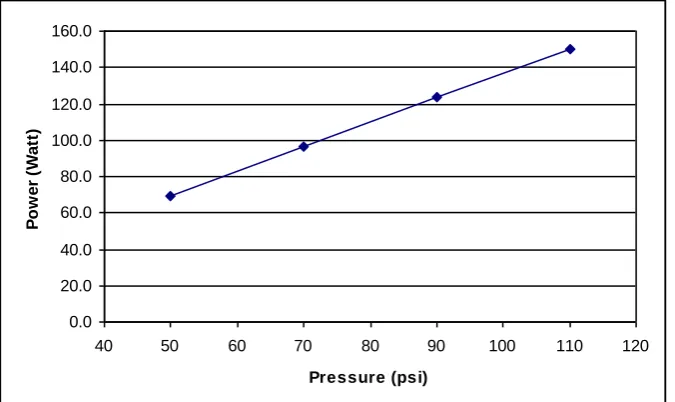
FIGURE 7: RELATIONSHIP BETWEEN PRESSURE AND POWER ...41
FIGURE 8: RELATION BETWEEN PRESSURE WITH NITRATE REJECTION RATIO ...42
FIGURE 9:THE RELATIONSHIP BETWEEN PRESSURE AND RECOVERY RATIO ...43
FIGURE 10:THE RELATIONSHIP BETWEEN PRESSURE AND POWER ...44
FIGURE 11:THE RELATION BETWEEN NITRATE CONCENTRATION OF EFFLUENT AND TIME FOR EXPERIMENTS 1&2 ...49
FIGURE 12:ION EXCHANGE EXPERIMENT 3 ...50
FIGURE 13:ION EXCHANGE EXPERIMENT 4 ...51
FIGURE 14:ION EXCHANGE EXPERIMENT 5 ...51
FIGURE 15:A REGRESSION LINEAR BETWEEN DESIRED (PREPARED) AND MEASURED NITRATE CONCENTRATION...53
IX
List of Equations
EQUATION 1:CATION EXCHANGE REACTION (1) ...10
EQUATION 2:ANION EXCHANGE REACTION (2) ...10
EQUATION 3:NSR1 EXCHANGE REACTION (3) ...11
EQUATION 4:REGENERATION REACTION (4) ...11
EQUATION 5:DENITRIFICATION REACTION (1) ...18
EQUATION 6: DENITRIFICATION REACTION (1) ...18
EQUATION 7:TO CALCULATE NITRATE REJECTION RATIO ...29
EQUATION 8:TO CALAULATE RECOVERY RATIO ...29
EQUATION 9:TO CALCULATE NITRATE BALANCE ...29
EQUATION 10:TO CALCULATE PERMEATION CONSTANT...29
EQUATION 11:TO CALCULATE FLOW RATE ...36
1
1
Introduction
1.1 Background
The availability of fresh water in arid and semi-arid countries such as
Algeria, Egypt, Morocco, Libya and Tunisia is constrained by the lack
of rainfall (Abufayed & El Ghuel, 2001). Libya as one of these
countries does not have access to surface fresh water (no rivers or
lakes), and as a part of Saharan Desert has limited rainfall. The
annual average rainfall is 200 mm per year with more than 95% of the
country receiving less than 100 mm per year. Evaporation rates are
among the highest in the world, because of the dry climate with
daytime maximum temperatures exceeding 40 deg C in some parts of
the country. The shortage of fresh water is heightened when the
demand on water was increased near the Mediterranean coast where
most of the population is concentrated (Abufayed & El Ghuel, 2001).
For the previous reasons, Libya is classified as one of 18 countries
which faces water scarcity. (Fresh water resources are under 1000
m3/cap/y) (Bremere et al., 2001). All these factors forced the country to introduce desalination plants to produce drinking water in the
1970s. Nowadays, the country is also reliant on its relatively high
quality ground water reservoirs which were discovered in the 1960s
during oil exploration deep in the southern Libyan Desert. Even
though, ground water was considered as a good solution of water
shortage in Libya, Table 1 shows shortage in annual water demand
2
Table 1: Water situation in Libya in 1998
Available
water Million m3
Water
consumption Million m3
Groundwater 2557.62 Agriculture 3259.27
Surface water 61 Domestic 448.3
Desalination 47.86 Industrial 135.64
Waste water 24.16
Total 2690.64 Total 3843.21
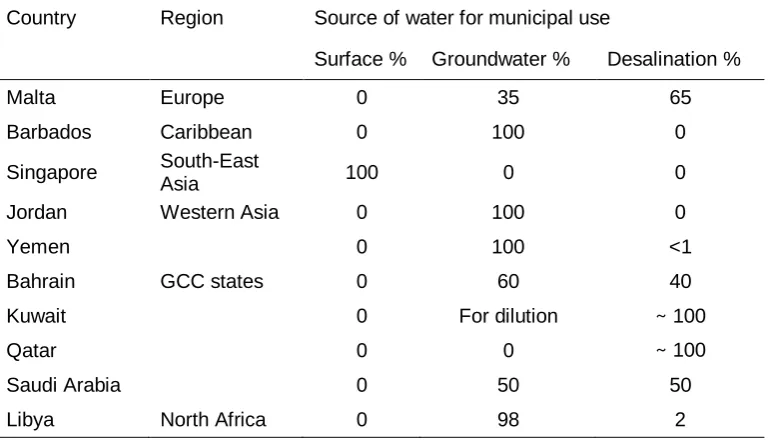
Ground water is the main source for municipal use which represents
98% of this use compared with 2% for desalination and 0% for surface
water (Table 2) ( FAO, 1997).
Table 2 : Current sources municipal water supply in water scarce
countries
Country Region Source of water for municipal use
Surface % Groundwater % Desalination %
Malta Europe 0 35 65
Barbados Caribbean 0 100 0
Singapore South-East
Asia 100 0 0
Jordan Western Asia 0 100 0
Yemen 0 100 <1
Bahrain GCC states 0 60 40
Kuwait 0 For dilution ~ 100
Qatar 0 0 ~ 100
Saudi Arabia 0 50 50
Libya North Africa 0 98 2
1.2 Great Man-Made River Project
The Great Man-Made River Authority (GMRA) was established in 1984
to transfer water through closed concrete conveyance lines from
3
reserves are located to the northern coastal strip where the population
is concentrated (Abdelrhem et al., 2008). This water is used for
municipal, agricultural and industrial purposes not just for drinking
water. GMRA project consists of five phases; the first two phases are
already completed. Phase I transfers water from Sarir to Sirt and from
Tazerbo to Benghazi. Phase II involves transferring water from Jabal
Hasouna wellfield to Tripoli (Figure 1).
Figure1: A map of Libya showing GMRA wellfields (Abdelgader 2009)
Groundwater usually contains a number of chemical compounds as
impurities. One particular ion that is sometimes found in
groundwater is nitrate. The World Health Organisation (WHO) have
set the maximum nitrate in potable water at 50 mg/L NO3-(10 mg/L NO3- -N) (WHO, 1993a, 2004). Water is currently supplied to Tripoli from the Jabal Hasouna wellfield. The East Jebal Hasaona EJH(S)
4
even over 100 mg/L in some wells. The average nitrate concentration
in EJH ( EJHS, EJHN and EJHW) is 53.23 mg/L NO3- ranging from 0.25 to 208 mg/L NO3- (Sahli, 2004). It is important to reduce the nitrate content to under WHO guidelines to avoid any health problems
caused as a result of using water with high nitrate concentrations.
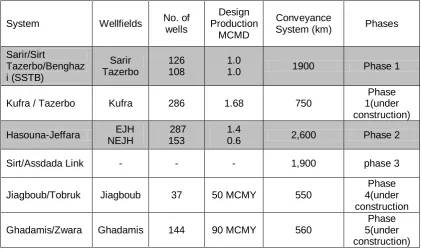
1.2.1 Great Man-Made River project Systems
GMRA was launched in 1984 to transfer 6.5 million cubic meters per
day from several wellfields in the southern part to the coastal zone.
These important water supply systems are listed below (Sahli, 2004):
I- Sarir/Sirt, Tazerbo/Benghazi System (SSBT)
II- Hasouna/ Jefara System
III- Sirt/ Sedada Link
IV- Jiagboub/ Tobruk System
V- Gedammes/ Zwara System
Table 3: Important details about GMRA systems (Sahli, 2004)
System Wellfields No. of
wells
Design Production
MCMD
Conveyance
System (km) Phases
Sarir/Sirt
Tazerbo/Benghaz i (SSTB)
Sarir Tazerbo
126 108
1.0
1.0 1900 Phase 1
Kufra / Tazerbo Kufra 286 1.68 750
Phase 1(under construction)
Hasouna-Jeffara EJH
NEJH
287 153
1.4
0.6 2,600 Phase 2
Sirt/Assdada Link - - - 1,900 phase 3
Jiagboub/Tobruk Jiagboub 37 50 MCMY 550
Phase 4(under construction
Ghadamis/Zwara Ghadamis 144 90 MCMY 560
5
MCMD: Million m3 per day MCMY: Million m3 per year
1.2.2 Hasouna Jeffara System
The Hasouna-Jeffara system (phase 2) is part of the GMRA project
and it includes Hasouna wellfields and the conveyance line is
designed to convey two millions cubic metre of water per day to Tripoli
(capital of Libya) and the Jeffara Plain. The Hasouna wellfield is the
main subject of this study. It consists of three wellfields contains 484
production wells and the overall average of nitrate concentration is
53.2 mg/L NO3- ranging from 0.25 to 208 mg/L NO3-. The distribution of wells for each wellfield is as follows (Sahli, 2004):
1- East Japal Hasouna South (EJHS): this wellfield consists of 90
wells and nitrate concentration is ranged from 26 -81 mg/L NO3- with an average 46 mg/L NO3-.
2-East Japal Hasouna North (EJHN): this wellfield consists of 78 wells
and the average of nitrate concentration is 52.3 mg/L NO3- ranging from 2.4 to 133 mg/L NO3-.
3-East Japal Hasouna West (EJHW): this wellfield consists of 316
wells that have a variation in nitrate concentration from 0.25 to 208
mg/L NO3- with an overall average 55.3 mg/L NO3-.
1.2.3 Location
The Hasouna wellfield is located as indicated in Figure 1, in the east
of Japal Hasouna (Hasouna Mountain) in the southwest part of Libya,
6
longitudes 14o13’ 00’00‖ and 14o 48 00 ― E and by latitudes 29o 42’00‖ and 29o16’00‖ N (Sahli, 2004).
1.3 Health effects of nitrates
The health problem to humans as a result of nitrates in drinking
water is due to the body's reduction of nitrate (NO3-) to nitrite (NO2-). The nitrite combines and oxidise haemoglobin (red blood cell
oxygen-carrying component) to form a methaemoglobin especially in bottle fed
infants. Up to 100% of nitrate is converted to nitrite in infants
compared to 10% in adults and children older than a year old.
Methaemoglobin is normally present at 1-3% in the blood. The
oxidised form of haemoglobin cannot act as an oxygen carrier in the
blood. When the quantity of methaemoglobin increases and reaches
5-10%, the ability of the red blood cells to carry oxygen is reduced.
This condition is called methemoglobinemia. The symptoms can
include lethargy and shortness of breath and the victim becomes blue
coloured (Schmoll et al., 2006). Anoxia and death can occur at very high uptakes of nitrite and nitrate from drinking water when 45-65%
of the haemoglobin has been converted (Schmoll et al, 2006).
Methaemoglobinaemia is observed in populations where the food for
infants is prepared with water containing nitrate more than 50 mg/l,
but other factors are also involved in the disease. Based on
methaemoglobinaemia in infants, the WHO has established a
7
hazardous especially to young children, children with gastroenteritis
and pregnant women. Most nitrates in the body are excreted in the
urine largely unchanged, while some nitrate is converted by bacteria
to nitrite in the stomach. Up to 25% of nitrate is recirculated in saliva
and most is converted to nitrite by bacteria. Nitrite reacts in an acidic
environment to form N-nitroso compounds with amines and amides in
the intestines, which may be associated with gastric and bladder
cancer (ECETOC, 1988). N-nitroso compounds are closely related to
animal carcinogens associated with cancer of the oesophagus,
stomach, colon bladder and haematopoietic system. However, there is
a little epidemiological evidence to link nitrate directly to cancer in
humans (Cantor, 1997; Ward et al., 2005). Nitrate concentrations
above 100mg/L can affect pregnant women and adults with a rare
metabolic condition called congenital glucose-6-phosphate
dehydrogenase deficiency (an inability to metabolise sugar)
(Department Health WA, 2008). Some studies found an increased risk
of spontaneous abortion and birth defects when mothers drank water
with high nitrate concentration. Pregnant women or the women who
are trying to be pregnant should not drink water with more than 50
mg/L as NO3- (Health Department Washington, 2007). The potential health problems which may arise from nitrate contamination obligate
the removal of nitrate in the EJH wellfield water supply to levels
8
1.4 The relevance and need for the project
The major concern regarding the use of ground water with an
excessive nitrate concentration is related to health effects. Therefore,
the main aim of this study was to identify what is the most suitable
technique for nitrate removal according to the characteristics of the
GMRA water. The specific objectives of this study were as follow:
1. Compare and contrast the effectiveness and efficiency of a
commercial Reverse Osmosis (RO) unit and an Ion-Exchange
resin unit to remove nitrate from GMRA water in keeping with
WHO Guidelines capable of achieving the designed demand of
Jabal Hasouna wellfield.
2. Investigate the option of using solar energy to operate the most
effective and efficient method of nitrate removal at Jabal Hasouna
wellfield.
1.5 Outline of Thesis Structure
Chapter 1 presents background information that includes water
situation in Libya and the health effects of nitrate on human.
Chapter 2 gives a literature review on removing nitrate from drinking
water, and the techniques which are used to achieve the desired
results.
Chapter 3 provides the methodology of the research and includes the
proposed design for both RO and Ion exchange units.
Chapter 4 presents the results of the experiments.
9
In chapter 6 conclusions and recommendations for further research
are presented.
2
Literature review
2.1 Background
The nitrate concentration in ground water used for drinking purpose
is becoming a big problem as a result of its health effects. The
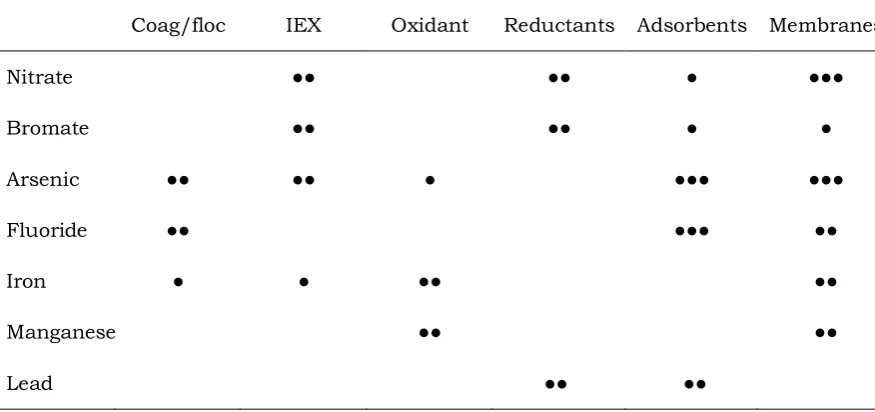
conventional drinking water treatment is not effective for removing
nitrate. To remove nitrate from drinking water to the safe levels (10
mg/L NO3-N) special treatment processes are needed and, Table 4 shows the ability of conventional and advanced water treatment
processes to remove nitrate and other inorganic ions (Parsons, 2006).
Table 4 : Comparision between conventional and advanced water
treatment methods to remove inorganic ions
Coag/floc IEX Oxidant Reductants Adsorbents Membranes
Nitrate ●● ●● ● ●●●
Bromate ●● ●● ● ●
Arsenic ●● ●● ● ●●● ●●●
Fluoride ●● ●●● ●●
Iron ● ● ●● ●●
Manganese ●● ●●
Lead ●● ●●
10
Moreover, the easiest option is to blend high nitrate concentration
water with low nitrate water but this is not always feasible either
because the low nitrate water is not available or transferring this
water is very expensive. Nitrate removal is therefore required. A
number of techniques have been developed such as ion exchange (IX),
reverse osmosis(RO), electrodialysis (ED) and biological denitrification
(Parsons,2006; Bae et al., 2002).
2.2 Ion exchange
IX is a reversible interchange of undesirable ions in water by other
ions from exchange resin (ion exchanger), and this leads to release of
ions such as hydroxide (OH-), chloride (Cl-), and sodium (Na+) ions to the product water (CGER, 1997). Ion exchangers are classified into
anion and cation exchangers. Anion exchangers are used to remove
anions such as sulphate(SO4-2), nitrate(NO3-) and carbonate(HCO3-) and cation exchangers remove cations like calcium and magnesium.
The ions in the resin A+ are replaced by undesirable ions in untreated water B+ and an ion exchange reaction takes place that may be represented by the following equation (Harland, 1994):
R- A+ + B+ → R- B+ + A+ Equation 1: Cation exchange reaction (1)
Solid solution solid solution
This equation is an example of cation exchange and anions in solution
are not removed in the exchange. Anions can be removed by applying
anion exchanger and the anion exchange reaction is similar to the
previous equation and can be written (Harland, 1994):
11
For nitrate removal a strong base resin is used and this resin uses a
functional exchange group that holds, for example, chloride. When
nitrate flows over the resin beads, chloride is exchanged with nitrate
and the chloride flows out with the treated water. This process
continues until all the resin's functional groups are saturated with
contaminated ions ( Parsons and Jefferson, 2006).
R+ Cl- + NO3- → R+ NO3- + Cl- Equation 3: NSR1 exchange reaction (3)
The resin needs to be regenerated with 2-3 volumes of a saturated
brine solution and the exchange reaction is as follows ( Parsons and
Jefferson, 2006):
R+ NO3- + Na+ Cl- → R+ Cl-+ Na+ NO3- Equation 4:Regeneration reaction (4)
During the treatment the resin also removes similar anions such as
bicarbonate and sulphate. Since conventional ion exchange resins
have a general selectivity sequences of SO4-2, NO3-, Cl- and HCO3- , sulfate ions in feed water interfere with nitrate removal and lead to
short service runs. This problem has been solved by developing a
nitrate selective resin and successfully has been used to remove
nitrate from ground water with high sulphate concentration (Guter,
1997). The nitrate selective resin prefers to exchange its chloride for
nitrate over sulphate at normal drinking water concentration. These
resins contain triethylammonium instead of trimethylammonium
which is found in the conventional resins. The ion exchange capacity
in conventional resin is greater than the selective resin. Using
conventional resins can be more economic where sulphate
12
nitrate selective resins are more economic to use (Croll, 1992). The ion
exchange seems to be the preferred technique to remove nitrate from
small water supplies because of its ease of operation, effectiveness
and low cost of operation (Bae et al., 2002). However a serious
problem arises when just one IX vessel is used to remove nitrate,
because of variation of chloride and alkalinity. In particular, chloride
variations are undesirable for some industrial customers. Moreover,
high chloride and low alkalinity waters able to dissolve zinc from
brass fitting in pipe systems. However, water with pH of more than
8.3 can form corrosion products and may block pipes (Croll, 1992).
This problem should be solved before the product water reaches the
customers and solving the problem can be done by blending the
product water with untreated water to meet the nitrate removal target.
Another option is to follow brine regeneration with a suitable rinse of
sodium bicarbonate. This will replace part of chloride by bicarbonate
ion so, during the treatment process some of nitrate will replace
bicarbonate and lead to reduce chloride concentration and increase
alkalinity. Improving water quality can be done using a plant
containing three vessels, with two vessels operating and the third
under regeneration processes (Croll, 1992). However, the most
unresolved problem that faces ion exchange is the disposal of spent
brine which is produced from regeneration of exhausted resin and
contains high concentration of nitrate, sodium, chloride, sulphate and
other ions (Parsons and Jefferson, 2006). To solve this problem many
13
brine. One such procedure is ion exchange combined with
denitrification processes (Bae et al., 2002). Recently, there are more
interest to use electrochemical cells to treat waste brine and reduce
nitrate to nitrogen gas ( Parson and Jefferson, 2006)
2.3 Reverse Osmosis
Osmosis phenomenon is the flow of a liquid from a dilute solution to a
higher concentration solution in plants and animals cells and this
phenomenon was discovered more than 200 years ago (Amjad,1993).
Reverse osmosis is a reverse of the osmosis phenomenon by applying
pressure to force solvent to pass through a semipermeable membrane
without its contaminants (Figure 2). To apply this process, the applied
pressure has to be larger than the osmotic pressure. The required
amount of pressure to separate the pure water from the contaminants
is based on the type and the concentration of contaminants in water
(Amjed, 1993).
Dilute Concentrate Applied pressure
: Osmosis and Reverse osmosis (Elyanow, 2005) Figure 2
Reverse Osmosis (RO) can improve water quality by reducing the
amount of organic, inorganic and bacterial contaminations which may
be found in raw water. Moreover, membrane selection is an important
factor of RO which affects its performance.
14
2.3.1 Reverse Osmosis Membrane
The RO membrane is the most important part in any RO unit. The
membrane technology has been widely developed since 1950s when
the first membrane was produced. The cost of membranes can take
up to 15-40 % of the total cost of reverse osmosis desalination plant
and must be replaced periodically (Zaho, 2006). The main types of
membrane are thin film (TF) and cellulose triacetate (CTA) membranes
(Remco Engineering, 2006). Moreover, commercially, there are three
types of RO membranes available: plate-and-frame, hollow fiber, and
spiral wound. Spiral wound membranes are the most popular because
of their widespread utilization, low cost and easy availability from
manufacturers (Zaho, 2006).
Membrane selection is based on the characteristics of the raw water
such as, hardness, acidity, total dissolved solids and chlorine content.
Every membrane has a different permeation constant that depends on
operating and design parameters. For example a membrane with high
salt rejection requires a high pressure difference to produce a
determined flow rate of permeate.
RO can produce high quality water, but it does not mean it can
remove all contaminants. The RO efficiency for removing nitrate is
between 83-92% (Karmin et al.,1990). Recovery ratio is defined as the
ratio of permeate flow to feed flow. The recovery for RO unit varies and
for brackish water is in the range of 50-80 % of feed water (Tannehill
et al., 1997). Recovery can be increased by using RO membranes in
15
One of the most common problems of RO techniques is the disposal of
the brine. The amount of brine from brackish water is ranged from 20
- 50 % (Tannehill et al., 1997)
2.4 Renewable energy sources
Using renewable energy source with RO desalination plants has
increased interest and development. The plants in operation are small
scale (<10m3/day) and represent only 0.02% of the total world desalination capacity (Mathioulakis et al., 2007). These plants are
largely demonstration or research plants and often operate non
continuously; in addition, renewable energy still frequently used is
more expensive than traditional sources (Helal et al., 2008; Lami et
al., 2008). Therefore, the unit cost of operation for RO coupled with
renewable energy is higher than for typical RO plants. Communities
that would typically benefit from coupled renewable energy with RO
are located in rural areas (Mathioulakis et al., 2007) . Renewable
energy sources have been coupled with brackish water RO
desalination. In Australia, small scale (0.4-1 m3/day) RO desalination system powered by solar energy have been tested (Harison, 2003;
Masson et al., 2005; Richard and Schaefer, 2002; Werner and
Schaefer, 2007). These systems were used in remote areas in central
Australia, where communities are small and fresh water is limited.
While large RO plants play an important role in larger coastal cities,
small RO units with simple design and renewable energy can
successfully provide water to rural communities (Werner and
16
The three main renewable energy sources available are solar
(photovoltaic and thermal), wind and geothermal energy. The thermal
energy source is normally used with distillation desalination, while
wind and photovoltaic solar energy are commonly paired with RO
desalination. The RO systems can use seawater or brackish water as
the feed source and are typically small to medium plants. Overall, the
energy source most often used has been solar energy ( 70% of
market), and RO has the majority (62%) of the renewable energy
desalination market (Mathioulakis et al., 2007). Brackish water
systems using photovoltaic energy have a range of production from
0.1 to 60 m3/day (Garcia-Rodriguez, 2003). Solar powered desalination is possibly the most promising alternative energy choice,
and both distillation and membrane plants have been designed and
operated. In particular, countries already advanced in conventional
RO desalination, such as Spain, Italy, and Saudi Arabia, have
successfully implemented solar photovoltaic energy and seawater RO
plants (Garcia-Rodriguez, 2003; Herold et al., 1998; Tzen et al.,1998).
Other countries, with arid and sunny climates, and rural
communities that have limited access to electrical power grids or
central water distribution network, have also investigated similar
renewable energy –RO systems for both seawater and brackish water
sources (Bouguescha et al., 2005; Garcia-Rodriguez, 2003; Herold et
17
2.5 Electrodialysis
Electrodialysis (ED) is an electrical driven unit operation in which
ions are transported through semi-permeable membranes from one
solution to another under the influence of a direct current (DC)
electrical field. Electrodialysis membranes are typically used in cell
pairs. The pairs are placed alternately as cation and anion transfer
membranes. When a DC potential is passed through the membrane
array, ions are selectively transferred through the membrane. As a
result alternate compartments are formed in which the ionic content
is greater or less than the concentration in the original water. By
manifolding the appropriate compartments, treated water (low
electrolyte concentration) and brine (high electrolyte concentration)
can be collected (Zaho,2006).
Electrodialysis has a good track record on the GMRA and has been
used on both the Sarir and Brega pipe plants (which are used to
produce concrete pipes for GMRA conveyances lines), at the
construction camps to produce water for industrial purposes. These
units are used to treat raw water different from GMRA wellfields
water. Electrodialysis is very expensive in energy cost, and the
process is more effective in removing divalent ions, e.g. sulphate,
calcium and magnesium, than monovalent ions such as nitrate and
18
2.6 Biological Denitrification
In biological denitrification certain micro-organisms are introduced to
the nitrate contaminated water and carbon source is added as a food
supply. Nitrate is converted to harmless nitrogen gas through
two-step reactions. Most of bacteria that are used in this process are
hetrophic which can use a wide range of carbon compounds. The
most used carbon sources are methanol and ethanol. The two step
reactions are: (Dahab, 1991)
6NO3- + 2CH3OH → 6NO2- + 2CO2 + 4H2O Equation 5 6NO2- + 3CH3OH → 3N2 + 3CO2 + 3H2O + 6OH- Equation 6
Denitrification can occur naturally in a groundwater environment.
Studies have shown this process happens in both shallow and deep
aquifer systems (Dahab, 1991). For treatment the biological
denitrification can be conducted in either suspended or attached
growth system. In the suspended growth system the bacterial biomass
is suspended in the reactor unit and in the attached growth system a
solid matrix is used to support the bacterial biomass in the reactor
unit (Hiscock, 1991). This technique has proven its effectiveness in
the removal of nitrate in several pilot plants and in full scale
demonstration plants in both Germany and France. However,
biological dinitrification is not currently used to treat drinking water
in United States (Dahab, 1991). During this treatment a small
19
process can be more expensive than the traditional treatments
because of its complexity that include adding carbon sources in the
appropriate stoichiometric amount and post-treatments that have to
be applied to remove micro-organisms, excess carbon and turbidity.
The post-treatments generally include aerated sand or activated
carbon filtration and ozonation or chlorination (Clifford, 1993).
Therefore, biological denitrification is widely used in the treatment of
waste water before discharging to water bodies (Schoeman, 2002).
2.7 Treatment assessment
Several water treatment methods are available for nitrate removal,
and the challenge or selection between these techniques depends on
desired water quality, plant capacity, skilled staff to operate the unit
and the cost of treatment including unit operation and maintenance.
Nitrate removal by biological denitrification is usually the preferred
solution for nitrate removal because nitrate is transformed into
gaseous nitrogen with a very high yield. Biological denitrification,
however, shows some drawback in process control and output water
quality. Nitrates are formed if insufficient carbon or energy is
available and substrate is in excess. This problem, especially when
random changes in the feed composition occur, can also be
complicated by the presence of excess biomass in the final water.
Therefore, post-treatment, disinfection and oxidation are normally
20
Processes based on IX, RO, ED are preferred for medium and small
applications (Schoeman, 2002). These techniques are more
economics, lower level in feed, process parameters control and
does not require an extensive post treatment. A comparison made
between IX and RO states RO is more expensive, but the data refer to
traditional membranes for desalination with low nitrate rejection
about 70%. New membranes with high nitrate rejection can improve
RO costs (Schoeman,2002). Additionally, IX is a form of ion removal
but is commonly used for removing scale forming ions such as
calcium and magnesium from hard water (water softening) as
compared to desalting. Ion exchange as mentioned before is the use of
ion exchange deionisers using synthetic resins to remove practically
all ionic material, however it generally cannot remove organics and
can become a breeding ground for bacteria. Regular generation of the
resin is required if an increase in salt concentration is to be avoided.
RO is more efficient than deionisation (IX) due to the used of
chemicals required to regenerate the resin for that process (Osmonics,
1997). Zhao in his Masters degree thesis (2006) compared RO with
other desalination techniques such as solar distillation, multistage
flash distillation (MSF), multi effect distillation (MED), vapour
compression (VC), freeze separation methods and ED. However, this
assessment was based on the use of RO in desalination, and was not
applicable to nitrate removal. In fact RO has become a major
21
reason for this is RO does not involve steam production and leads RO
to be more energy efficient than the other techniques. With all these
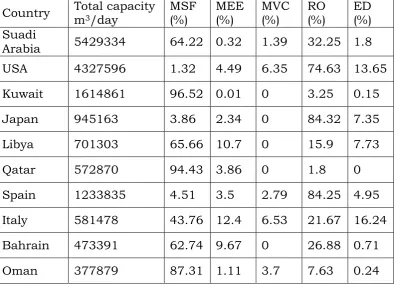
advantages, reverse osmosis has become the major desalination
techniques in many developed countries (Table 5).
Table 5: Desalination production and percentage of various
processes in 2000 (Hisham, 2002)
Country Total capacity m3/day MSF (%) MEE (%) MVC (%) RO (%) ED (%) Suadi
Arabia 5429334 64.22 0.32 1.39 32.25 1.8
USA 4327596 1.32 4.49 6.35 74.63 13.65
Kuwait 1614861 96.52 0.01 0 3.25 0.15
Japan 945163 3.86 2.34 0 84.32 7.35
Libya 701303 65.66 10.7 0 15.9 7.73
Qatar 572870 94.43 3.86 0 1.8 0
Spain 1233835 4.51 3.5 2.79 84.25 4.95
Italy 581478 43.76 12.4 6.53 21.67 16.24
Bahrain 473391 62.74 9.67 0 26.88 0.71
Oman 377879 87.31 1.11 3.7 7.63 0.24
Table 5 shows the high percentages of both developed and developing
countries are using RO technique compared with ED.
Moreover, as Dallas presented in his report (2007), in terms of energy
consumption for water production per each unit which is presented
22
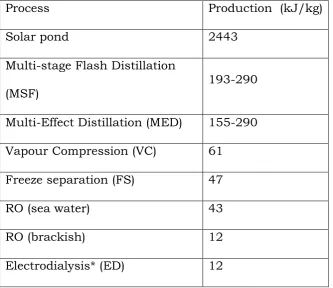
Table 6: Energy consumption per unit of product water for
various desalination techniques
Process Production (kJ/kg)
Solar pond 2443
Multi-stage Flash Distillation
(MSF)
193-290
Multi-Effect Distillation (MED) 155-290
Vapour Compression (VC) 61
Freeze separation (FS) 47
RO (sea water) 43
RO (brackish) 12
Electrodialysis* (ED) 12
*Does not remove pathogens and thus sterilisation is required
Source: Al-Mutaz and Al-Ahmed (1989) in Harrison , (2001)
It can be concluded that both RO (brackish) and ED are the most
efficient, although ED does not remove pathogens. This limitation of
ED lead Dallas to consider RO as the most inherently efficient
technique available for desalination and pathogen removal (Dallas,
2007). The desalination units listed in table 6 was assessed by
Harrison in terms of suitability for new communities with marginal
water quality considering many important factors such as health,
stability, environment, cost, functionality, automation and security.
This assessment showed RO with energy recovery was the preferred
method subject to any site specific situation which may affect this
conclusion. Moreover, a study by Herold and Neskakis (2001) ranked
23
low power requirement compared to ED, MED and VC; more suitable
in arid middle east regions; flexibility in water quality, quantity, site
location, unit operation. Brine disposal produced from the
desalination process is always problematic. Brine can comprise
between 20-50% of the treated water volume, depending on the
quality of raw water. Brine is usually disposed in evaporation ponds.
And this is very expensive (Schoeman & Steyn,2002).
A study included six different methods to remove nitrate and
hardness includes: ion exchange, reverse osmosis and electrodialysis
and combinations of lime softening with ion exchange, ion exchange
softening with ion exchange for nitrate removal and membrane
softening with ion exchange nitrate removal. This study was based on
treatment cost as an important factor which was evaluated in relation
to water quality production. Even this review included blending
treated water with raw water to provide water within the drinking
water regulations. It was clear; ion exchange technique was shown to
be the most economic process for nitrate removal but it did not solve
the high hardness of the water and did not provide water with as good
quality as the other processes. Additionally, the high cost of waste
disposal ponds made IX nitrate removal more expensive on a capital
basis even than brackish water RO. When the cost of brine disposal
was included RO became just slightly more expensive than IX by 12%.
Considering the overall and especially producing a better water
24
would choose this technique for construction (Christopher et al.,
1995).
Good quality water is available in GMRA in Libya in East Jebal
Hasaona (EJH) wellfield (approximately 1030 mg/l). However nitrate
concentration is more than 50 mg/l in many wells and even over 100
mg/l in some wells. Furthermore, it can be concluded from the
previous discussion that RO could be an appropriate technology to
remove nitrate from drinking water in GMRA in EJH well-field. In
addition, low dissolved solids require less pressure and of course less
energy so decrease the cost of water production. Phase 2 is already
established to provide Tripoli (the capital city of Libya) and the other
cities located along side the conveyance line with 2 million cubic
meter per day for domestic, agriculture and industrial use. There are
two choices to remove the nitrate, the first one is just to treat the
quantity of water that will be used for drinking purpose . The second
choice is to install the most suitable technique for nitrate removal
such as RO system on the highest nitrate concentration wells, and
manage water production by blending the produced water from RO
units with the water from the other wells to produce water with
acceptable nitrate concentration under WHO standards.
Because the raw water in EJH well-field is good quality (less salts)
which can increase the RO recovery ratio, so the rejected water can be
less than the normal rate. Moreover, there are many options for brine
disposal: discharging into sewage treatment plant, field irrigation or
25
purpose except for drinking, for example washing cars, cleaning
streets, flushing toilets or any other purpose appropriate for this type
of water.
Even Libya, which is considered a rich country that has access to
natural gas and diesel (fuels to generate electricity), friendly
environmental solutions should be applied to reduce the impact on
the environment and to use the available resources in a sustainable
way. Using renewable energy to run the RO units must be considered
and the best source that is available in the Libyan desert (where the
EJH well-field is located) is solar power, so a combination of RO with
the renewable energy is considered as a good sustainable solution for
removing nitrate from drinking water in GMRA in EJH well-field.
Furthermore, ion exchange is considered as the best technique in
removing nitrate from ground water in terms of cost of treatment.
2.8 Conclusion
In brief, removing nitrate from drinking water in GMRA in Libya under
the standards of WHO is an important issue to avoid health effects
particularly with respect to bottle fed infants under the age of 3
months. In addition, as it has been discussed in this chapter RO and
IX are the suitable techniques of removing nitrate from drinking
water. Thus the aim of this study is to investigate both of them to
choose the most suitable one for nitrate removal, considering the
existing characteristics and water quality in EJH well-field which may
26
3
Materials and Methods
3.1 Nitrate removal techniques
There are many methods available for the removal of nitrate from
water, such as reverse osmosis, ion exchange, electrodialysis and
denitrification (Byung, 2001). This study will focus on Reverse
Osmosis and Ion Exchange Techniques. Experimental trials were
conducted for both techniques to assess which is the most
appropriate technique according to the characteristics of water in
Jabal Hasouna wells in Libya and the other relevant factors
(availability of sunshine and using solar energy to power the RO unit).
3.2 Chemicals for experiments
Nitrate solutions for all experiments were prepared from potassium
nitrate (KNO3) and nitrate measurements were done using a HACH spectrophotometer DR 2800 and applying Nitrate, HR (0 to 30 mg/L
NO3- -N) (cadmium reduction method) number 8039 .
3.3 Reverse osmosis technique
Reverse osmosis can improve water quality by reducing total dissolved
solids and is also able to reduce bacteria which may be found in raw
water. The ability of RO to remove nitrate from drinking water is
between 83 and 92% (Karmin et al., 1990).
3.4 3.3.1 Reverse Osmosis Experiment
Reverse osmosis experiments were conducted by using an existing RO
unit in Environmental Technology Centre in Murdoch University. This
27
carried out in a closed system to avoid having to prepare fresh nitrate
solution for each pressure level. Moreover, a solar submersible pump
(Lorentz PS600 HR-04H) was used to discharge raw water from the
feed tank and through the RO unit as well, which is not the same as
the normal system which normally uses a high pressure pump after
pretreatment to discharge raw water through the RO membrane. The
RO unit was modified as it is illustrated in figure 3.
Note : RO membrane specification and pump specification are presented in
appendices D and F.
3.4.1 3.3.2 Typical RO experiment
All RO experiments were conducted using the following nitrate
concentration (8.3, 15.4, 20.5, 27.6 and 35.2 mg/l NO3- as N). These nitrate concentrations were applied because the WHO standard limits
nitrate in drinking water to below 10 mg/L NO3--N so chosen nitrate concentrations were selected to be below and above 10 mg/L NO3—N to reflect the concentrations found in EJH wellfield. Feed water was
Feed water Tank
Pre-filters 5 and 25 micron
Brine RO membrane
Permeate
Ball valve and Pressure gauge
Figure 3: RO experiment
28
prepared by adding a potassium nitrate solution to scheme water in
storage tank to prepare the desired nitrate concentration and was left
for two days before running the experiment to make sure the chlorine
in scheme water was released from raw water to protect RO
membrane. Chlorine in feed water can cause damage to the
membrane. Then the RO unit was turned on and the pressure was
adjusted to start the experiment with 50 psi. Feed water was pumped
directly to the pre-filtration unit of 5 and 20 micron to remove the
suspended solids or any substances that may affect the membrane.
Then the feed water passed through the RO membrane and using a
gate valve and pressure gauge to apply a variable pressure to force
water to pass through the membrane to produce permeate and reject
brine. Both permeate and brine were returned to the tank, because
the experiments were run in a closed system. During an experiment
samples from feed water, permeate and brine were taken every half an
hour and nitrate concentration was analysed and when the steady
conditions were reached the pressure was changed to 70 psi and the
same procedure was repeated.
The experimental conditions were varied to a pressure of 90 and 110
psi. Flow rate was measured for inlet and outlet during the
experiment and for each different pressure. Under each nitrate
concentration and applied pressure, nitrate concentration of permeate
29
Moreover, nitrate rejection ratio, recovery ratio, nitrate balance and
membrane permeation constant were calculated through the following
equations.
SRR= (( Cf – Cp )/Cf )* 100 (Harrison, 2001) Equation 7: To calculate nitrate rejection ratio
Where
SRR Nitrate rejection ratio %
Cf Nitrate concentration of feed water (mg/L NO3- as N) Cp Nitrate concentration of Permeate (mg/L NO3- as N)
Y = (Qp/Qf) * 100 (Harrison, 2001) Equation 8: To calaulate Recovery ratio
Where
Y = Recovery ratio (%)
Qp =Permeate stream flow rate (L/sec)
Qf = Feed stream flow rate (L/sec)
Nitrate balance of influent have to be the same as effluent
Qf * Cf = (Qp * Cp) + (Qb * Cb) Equation 9 : To calculate nitrate balance
Qb= Brine stream flow (L/sec)
Cb = Brine nitrate concentration (mg/L NO3- -N)
K = Qp/ (P-л) (Harrison, 2001) Equation 10: To calculate permeation constant
Where
K = Permeation constant (L.sec-1/kPa) P = Pressure (kPa)
30
3.4.2 3.3.3 Flow measurements
Flow rate was measured by taking the first flow meter reading then
after five minutes taking the second reading. The flow rate (L/min)
was calculated by subtracting the second reading from the first
reading then the result was divided by five.
3.3.4 Sampling programme
After running the RO unit and adjusting the pressure on 50 psi,
water samples were collected from raw water, permeate and brine
every half an hour and analysed until the steady condition was
reached (when nitrate concentration in the permeate and brine
remained constant). Then two samples from each stream were
collected and analysed. After that the pressure value (70, 90 and110),
was changed and the same procedure was followed for each pressure
value.
3.3.5 Power regeneration by PV cells
The RO experiments were conducted during full sunshine days
between 9:00 am to 4:00 pm. Moreover, the power was generated
using six solar panels and the solar radiation during the mentioned
period on 3/12/2009 was between 623-1113 Watt/m2 and the average was 965 Watt/m2 (weather station). Furthermore, the power peak production of each PV cell is 140 Watt. In this case the
efficiency of solar panels is 15% of the availble 965 Watt/m2 and this percentage is matching the normal solar power efficiency of 10-15%.
31
transformed to heat instead of electrical energy. Anything can lead to
reflection of the incoming rays on the cell surface and electrical
resistance losses in the connecting cables and the semiconductors.
However, the measured power using a multi meter was different for
each applied pressure and was between 203 and 283 watt and these
readings were compatible for pressures between 50-110 psi. In
addition the calculated power (consumed power by pump) was
calculated by multiplying pressure N/m2 (Pa) and flow rate m3/s ranged from 69 – 150 Watt.
3.3.6 Power consumption
Power generation was calculated by measuring voltage and current
from control box in solar panel using a multimeter (P (Watt) = V (Volt)
* I (Ampere)). This value represents the power which was produced by
solar panels. The actual consumed power was calculated using the
following equations:
The consumed power was related to the applied pressure and the flow
rate of the pump
1- Power W = J/s so = Nm/s because J= Nm
2- Pressure Pa = N/m2 3- Flow m3/s
Pressure multiplied by flow calculates power in Nm/s (Watt).
3.5 Ion Exchange experiment
Ion exchange experiments were conducted using nitrate selective
32
batch tests were run to calculate nitrate removal capacity of the resin
and compared with specification of the resin. Then column
experiments were carried out using nitrate solutions and a synthetic
water similar to water quality in Great Man-made River Project. The
specification of this water is given in appendix C, to investigate the
effect of nitrate concentration, presence of other anions (sulphate,
chloride and bicarbonate) and contact time on nitrate removal
capacity of the resin.
3.4.1 Regeneration of NSR1 Resin
The specification of NSR1 indicates that the Brine NaCl (3-10%) is used to regenerate the resin at nearly 50 °C. Regeneration was
conducted after each experiment using the following procedure:
1- 3.5 % of brine were prepared by dissolving 70 gram on NaCl in two
litres of deionised water. Two litres was prepared to match the resin
specification ( 2-3 volume of the resin).
2- Drain the brine into the column for one hour by adjusting the flow
rate using Huffman valve.
3- drain the brine to the top level of the bead and close the valve and
keep it for one hour.
4- Drain the brine and wash the resin using 3-6 volumes of deionised
water.
3.4.2 Batch test
In this test three experiments were carried out with different contact
33
range of nitrate concentration (10, 20, 40, 60, 80, 100 mg/L NO3–N). Moreover, two experiments were conducted with two minutes contact
time and the nitrate concentrations were different to the previous
three tests (150, 200, 250, 300, 350 mg/L NO3-N). High nitrate concentrations were used to investigate nitrate removal capacity of
the resin. The nitrate concentration solution for the batch test was
prepared as follows:
I- Potassium nitrate was dried in oven for 24 hours.
II- 3.62 g of KNO3 was dissolved in 1 L of deionized water to prepare 500 mg/L NO3 as N.
III- A pipette was used to transfer 2 mL of 500 mg/L NO3 to a 100 mL flask and fill with deionized water up to the mark to prepare
10 mg/L NO3 as N.
IV- Transfer 4, 8, 12, 16 and 20 mL of stock solution to prepare 20,
40, 60, 80 and 100 mg/L NO3 as N.
Batch test was conducted by transferring 50 mL from prepared nitrate
solutions 10 mg/L NO3 as N in a conical flask containing stirring magnet and placing it on a magnetic stirrer. Then one mL of nitrate
selective resin was added and the magnetic stirrer was turned on for
one minute. After one minute the magnetic stirrer was turned off and
10 ml of a solution was taken to measure the remaining concentration
of nitrate. The same procedure was applied with other nitrate
34
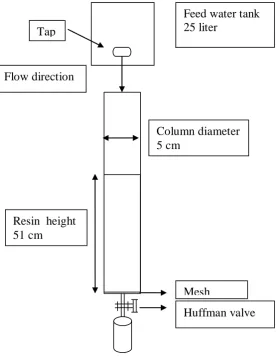
3.4.3 Column experiment
3.4.3.1 Column Setup
Five experiments were conducted by using 0.867 litre of nitrate
selective resin in a transparent plastic column. Feed water was
introduced into the top of the column and contact time was controlled
by controlling the flow rate using Huffman valve in the outlet tube.
The column experiments were set up as it is shown in Figure 4.
Figure 4: Ion exchange experiment
Resin height 51 cm
Column diameter 5 cm
Huffman valve Mesh
Feed water tank 25 liter
35 3.4.3.2 Feed Solution Preparation
Feed water was prepared as follows:
A- Nitrate solution
I- Potassium nitrate was dried and 43.28 gram of it dissolved in
deionized water and then poured into a 50 litre container diluted to
50 litre to prepare 120 mg/L NO3 as N. B- Nitrate solution and other anions
I- The step as the first step in A.
II- 22.4 gram of calcium chloride was dissolved in a litre of
deionized water and added to the 50-litre tank.
III- 17 gram of sodium sulphate was dissolved in a litre of deionized
water and added to the 50 L container.
IV- 12.31 gram of sodium bicarbonate was dissolved in one litre of
deionized water and added to the same tank.
V- The prepared solution was diluted up to 50 litre to prepare the
desired salts concentration (178 mg/L HCO3-, 284 mg/L Cl-, 230 mg/L So4-2 and 120 mg/L No3- as N).
C- Synthetic water
This water was prepared to be similar to the water quality in EJH
well-field as it is illustrated in appendix C.
3.4.3.3 Experimental runs
1- First experiment was conducted by using just nitrate solution
with one-minute contact time to investigate nitrate removal
36
2- The second one was run for reproducibility by using the same
feed water and the same contact time.
3- The third experiment was done by using prepared water
containing other salts beside nitrate to investigate the effect of
the presence of these anions on nitrate removal using the same
nitrate selective resin and contact time was the same as the
first one.
4- The fourth experiment was carried out by using synthetic water
similar to water in EJH wellfield and on minute contact time to
investigate the efficiency of ion exchange technique of nitrate
removal from water, whose quality was the same as the average
of water parameters in EJH wellfield.
5- The fifth one was run using the same synthetic water like the
previous one but the contact time was 2 min to investigate the
effect of contact time on nitrate removal.
3.4.3.4 Flow rate and contact time calculations
Flow rate for the column experiments was calculated by this equation:
V = Q/A Equation 11 : To Calculate flow rate
Where
V = Velocity (h/m)
Q = Flow rate (m3/h) A = Area (m2)
The resin manufacturer recommended that the velocity for NSR1 resin
is between 5-60 m/h (Darcy velocity). Firstly 7.65 m/h was used
37
Q= A * V = 0.00196 * 7.65 = 0.015 m3/h = 15.0 L/h = 0.250 L/min From the calculated flow rate contact time can be calculated by the
following equation:
Flow rate = Volume (ml) / contact time (min) Equation 12 : To calculate contact time
Volume was calculated by using the clear column filled with IX resin.
The column was filled with water to just over the resin bed volume.
The water was drained using Huffman valve until the water level was
exactly at the bottom level of the bed volume. This volume represented
the resin pore space volume and was equal 250 mL.
T = V/Q
Where T = Contact time (min)
V = volume (L)
Q= Flow rate L/min
So the contact time equals:
= 0.25 (L)/0.25 (L/min)= 1 min
Secondly 3.825 m/h velocity was used following the same calculation
as above.
Area = 3.14 * (0.025 m*0.025 m) = 0.00196 m2
Q= A * V = 0.00196 * 3.825 = 0.0075 m3/h = 7.5 L/h = 0.125 L/min Then contact time was calculated using 0.125 L/min flow rate
T = V/Q
= 0.25 (L)/0.125 (L/min)= 2 min
38
In the experiments 1, 2, 3, and 4 were conducted using one minute
contact time (0.250 L/min flow rate) so, every four minutes were
treated 0.25 L/min * 4 min = 1 L
Volume of treated water can be calculated by divded the accumulative
time by 4 when one minute contact time was used and diveded by 8
when two minutes contact time was used ( experiment 5).
39
4
Results
This chapter summarizes the key results from the experiments carried
out for both reverse osmosis and ion exchange techniques. Details of
the result are in Appendix A and B.
4.1 Reverse Osmosis Experiment
The results presented in this section include nitrate concentrations
and flow rates for all streams and their relationship with the applied
pressure besides recovery ratio, nitrate rejection ratio and permeation
constant of the membrane.
4.1.1 First reverse osmosis experiment 8.3 mg/L NO3- -N
concentration
Table 7 shows the results of nitrate concentrations for permeate,
brine and feed water and nitrate rejection ratio for different pressures
in experiment 1.
Table 7: Nitrate concentration and nitrate rejection ratio
against pressure
Pressure
(50 psi)
Pressure
(70 psi)
Pressure
(90 psi)
Pressure (110 psi) Feed water conc.
(mg/L) 8.3 8.3 8.3 8.3
Permeate conc.
(mg/L) 1.4 1.1 0.9 0.8
Brine conc. (mg/L) 8.5 9.8 10.2 10.8
Nitrate rejection
40
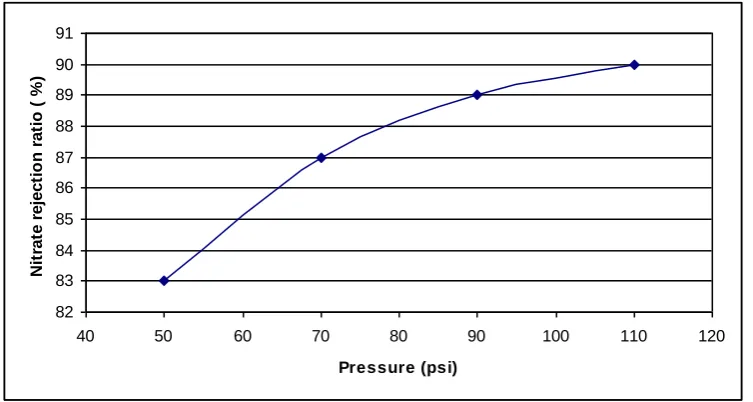
Figure 5 indicates the proportional relation between nitrate rejection
ratio and applied pressure.
82 83 84 85 86 87 88 89 90 91
40 50 60 70 80 90 100 110 120
Pressure (psi) N it ra te r e je c ti o n r a ti o ( % )
Figure 5 : Relationship between pressure and nitrate rejection
ratio
Table 8 indicate the relationship between flow rates for permeate,
brine and feed water with several applied pressures.
Table 8 : The relationship of pressure against flow rates and
recovery ratio
1st experiment
Pressure (50 psi) Pressure (70 psi) Pressure (90 psi) Pressure (110 psi) Total flow
( L/min) 12.0 12.0 11.9 11.9
Permeate flow
( L/min) 1.3 1.8 2.4 3.1
Brine flow
(L/min) 10.7 10.1 9.5 8.7
Recovery ratio
(%) 10.00 15.00 20.00 25.00
Permeation