R E S E A R C H
Open Access
Long-range degree correlations in complex
networks
Michael Mayo
1*, Ahmed Abdelzaher
2and Preetam Ghosh
2*Correspondence:
[email protected] 1Environmental Laboratory, US Army Engineer Research and Development Center, 3909 Halls Ferry Rd, 39183 Vicksburg, MS, USA Full list of author information is available at the end of the article
Abstract
Social networks are often degree correlated between nearest neighbors, an effect termed homophily, wherein individuals connect to nearest neighbors of similar connectivity. Whether friendships or other associations are so correlated beyond the first-neighbors, and whether such correlations are an inherent property of the network or are dependent on other specifics of social interactions, remains unclear. Here we address these problems by examining long-range degree correlations in three undirected online social and three undirected nonsocial (airport,
transcriptional-regulatory) networks. Degree correlations were measured using Pearson correlation scores and by calculating the average neighbor degrees for nodes
separated by up to 5 sequential links. We found that the online social networks exhibited primarily weak anticorrelation at the first-neighbor level, and tended more strongly towards disassortativity as separation distances increased. In contrast, the nonsocial networks were disassortative among first-neighbors, but exhibited assortativity at longer separation distances. In addition, the average degrees of the separated neighbors approached the average network connectivity after
approximately 3-4 steps. Finally, we observed that two algorithms designed to grow networks on a node-by-node basis failed to reproduce all the correlative features representative of the social networks studied here.
Keywords: Social networks; Pearson correlation; Assortativity; Degree correlation
1 Introduction
A complex network is said to be degree correlated if the degrees of nodes at the end of links occur together in a nonrandom manner. The tendency of nodes to connect with others of similar degree is termed assortativity [1], or homophily when referenced specif-ically to social networks [2]. Conversely, nodes connected to others of dissimilar degree are said to be disassortatively mixed [1]. In a social network the nodes represent individu-als, and the links between them conceptualize friendships or other social associations. In this setting, an assortative network emphasizes the surprising result that “...your friends have more friends than you do” [3]. Although results from the literature mostly involve degree mixing among nearest neighbors, little else has been reported regarding degree correlations extending beyond the first neighbors. Can a degree “correlation length” be defined for complex networks? If so, how far do degree correlations extend into a network based from any node?
Some insight into these questions has come from the social sciences. For example, the probability that an individual (termed the “ego”) and his/her acquaintance (termed the “alter”) are jointly obese decreases with geodesic distance (i.e., the number of sequential steps that link two nodes). However, this assortative effect is nearly independent of geo-graphic distance [4], and is therefore a network property. Similar results hold for other health-related outcomes, such as smoking [5]. For a wide variety of social outcomes, such as happiness, divorce, depression, sleep length, marijuana use, Christakis and Fowler [6] reported assortative correlations to up to 4 and 6 steps from the ego.
Several explanations were proposed to explain these nonrandom effects [6]. For exam-ple, individuals could choose to associate with others of similar traits (homophily); individuals could associate with others exposed to similar environments; or traits could spread their influence through “conduction,” like a contagion. However, such hypothe-ses cannot explain all assortative correlations beyond the first step (nearest neighbors), because similar effects have been observed in networks of more “autonomous” agents, such as food webs [7] (see also the commentary in [8]). Nevertheless, Christakis and Fowler conclude that, for social networks, traits extend to, on average, 3 steps beyond the ego [6]. Because node degrees are an elementary feature of networks and tend to cor-relate assortatively, we could ask: Does this 3-step observation hold for degree-degree correlations in general, across many different types of networks? If so, is there a defining mechanism for the effect?
Here we address these questions by comparing degree correlations for several large social networks to exemplary nonsocial ones, including an airline transportation network and two well-annotated transcriptional regulatory networks. We developed and executed an algorithm to evaluate degree correlations between nodes separated by more than one step, which is general enough to be applicable to nearly any undirected network. These methods could also be used to evaluate correlations between properties or features of the nodes beyond those associated directly with the network topology.
2 Methods
2.1 Measuring degree correlations
The degree of a node measures the number of links to its nearest neighbors, and is a criti-cal property of the network topology because it accounts for coupling of each node to the greater network. It is therefore of great interest to examine the distribution of and corre-lation in network degrees. For simplicity, we will assume that all edges of the networks we examine are undirected (Section 2.3, below).
2.1.1 Average neighbor degree
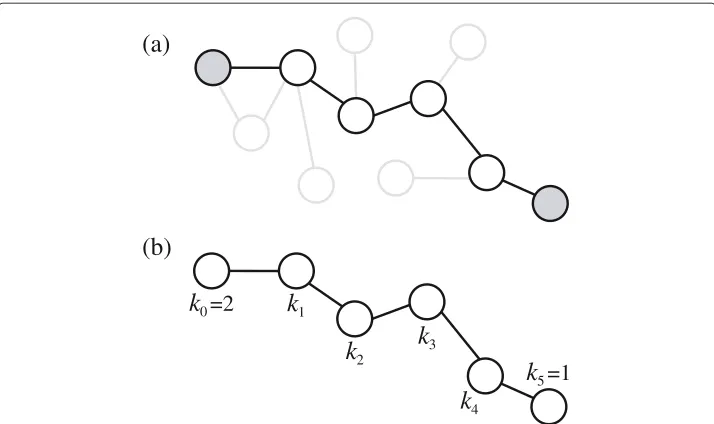
The quantityk1k0may be calculated, which is the correlation function betweenk0, the degree of the “ego” or focal node, andk1, the degree of the “alter” node connected to the ego by 1 link (Figure 1). This two-point correlation function can be expressed as:k1k0 =
k0k1k1k0p(k1,k0), whereinp(k1,k0)is the joint probability that nodes of degreek1and k0appear together at the ends of a link [1]. Here, the sum spansk1,k0=1,. . .,L, withL the number of links in the network. The joint probability can be expressed asp(k1,k0)=
(a)
(b)
k
0=2
k
5=1
k
1k
2k
3k
4Figure 1 A smaller exemplary complex network.(a)A 5-chain path (bold) between the ego and alter nodes (grey).(b)Degrees of nodes along the path of this 5-chain are labeled byk0,. . .,k5. Using sociology
terminology,k0is the degree of the “ego” (focal) node, andk5is the degree of the “alter” node.
One way to determine whether any degree correlation exists is to measure the average nearest neighbor degree as a function of node degree,k1nn(k0). This quantity is directly linked to the conditional probability [9]:
k1nn(k0)= k1
k1p(k1|k0). (1)
If the conditional probability is uncorrelated, thenp(k1|k0) = p(k1), and Eq. 1 can be evaluated to givek1nn(k0) = k20/k0, which is a constant of the network. Here,
knn
1 > k0for nonzero variance, which quantifies the notion that “...your friends have more friends than you do” [3]. Thus, any observed dependence ofk1nnonk0indicates the presence of degree correlations in the network.
Do degree correlations extend beyond direct neighbors? To address this question, we extend Eq. 1 to nodes separated by long chains ofm-many links. By “long chains”, we mean the number of links separating one node (the ego) from another (the alter) that can be reached by following successive links, generation-by-generation, out from the ego without any back-tracking. We will refer to these paths as “m-chains”, which constitute the shortest paths between two nodes of the network, and are identical to the geodesic distance between ego and alter nodes [6]. The basic idea is conceptualized in Figure 1, whereinmdenotes the number of sequential links that compose the path between the ego and alter.
We label the joint probability that a node of degreek0is connected by anm-chain to another of degreekmbypm(km,k0). Form=1, this quantity represents the one described in the previous section for nearest neighbors, and we drop the subscript:p1(k1,k0) =
p(k1,k0). In a similar way that Eq. 1 links the average nearest-neighbor degree to the node degree, we have:
kmnn(k0)= km
Thus, any dependence ofkmnnonk0signifies degree correlations between nodes at the ends of anm-chain.
2.1.2 Pearson correlation
The Pearson correlation, r, is the ratio of the covariance of fluctuations, (k0− k0) (km− km), to the variance in degree,k02 − k02[1]:
r= (k0− k0)(km− km) k02 − k02
, (3)
wherein the average,· · · , is taken over the nodes connected bym-chains. For practical purposes, Eq. 3 can be implemented as a sum overm-chains:
r= L
−1 m
iki0kim−
L−m1i12k0i +kmi 2
L−m1i12
k0i2+ki m2 −
L−m1i 12k0i +kmi
2, (4)
whereinLmis the number ofm-chains. Note thatL1 = Lis the number of links in the network, and thatLm≥L.
The Pearson correlation is often used to measure the assortativity of nodes connected by links (i.e.,m=1), because the variance ink0is equal to the value ofk0km − k0km for a maximally assortative network [1]. Therefore, r is bounded on [−1, 1];r = −1 corresponds to a purely disassortative network, whiler = 1 marks a network as purely assortative. However, this measure obscures thek0-dependence ofpm(km|k0)[10].
2.2 Algorithm to identifym-chain neighbors
We evaluated Eqs. 1 and 2 using a computational algorithm to determine nodes connected bym-chains, form=1,. . ., 5, which is conceptualized in Figure 2. We chose a maximum geodesic distance ofm=5 to balance computational resources with the reports that such correlations nearly vanish form > 3 [6]. Referring to Figure 2 with the understanding that the networks are undirected, the steps of the algorithm can be outlined as follows.
I. Choose an ego node (node 0, Figure 2(a));
II. Follow all links from the ego to its neighboring nodes, and append the IDs of these neighbor nodes into one of five dynamic lists, one list for each geodesic distance,m; III. Now, follow all links from these neighbor nodes to their neighbors (e.g., from node
generations 1 to 2 in Figure 2(b)), excluding nodes already identified in a list from a previous generation/geodesic distance;
IV. Continue this process untilm=5, then return to step I.
We followed a method outlined in Ref. [11] to evaluate Eqs. 1 and 2, but using nodes connected bym-chains obtained from the above algorithm. For each nodeiwith degree k0iin the network (the ego), we identified a set of neighbor nodes found at the end of each m-chain,njm (the alters), each of which has degreekjm. To each ego node, we associated
an averagedm-chain neighbor degree:km
k0i = njm
−1 {njm}k
j
m. Finally, we took
the arithmetic average of all instances of a given degree value,ki0=k, to give [11]:km = |{km}|−1ki0=kkm
1 1
2
2 3
3 4
4 5
5 0
Step 1
1 1
0 1
2
2 Step 2
2 3
3 Step 3
3 4
4 Step 4
4 5
5 Step 5
(a)
(b)
Figure 2 Steps of the computational algorithm.(a)Beginning from the “ego” (here labeled 0), each successive identification step moves away from the current node, without any back-tracking to nodes in previous step-generations. Numbers here mark the geodesic distance from the ego, and dotted lines mark nodes that link each step of the algorithm.(b)At each movement step, nodes’ IDs are recorded into 5 separate dynamic lists, one for each geodesic step from the ego. The resulting lists record the identity of the leaves of the hierarchy for eachm-chain.
2.3 Network datasets
We studied several online social network datasets, and compared their results to those obtained from a transportation network and two transcriptional regulatory networks. By social network, we mean a network wherein the nodes represent individuals and the links between them signify social associations. All of these networks were manifestly directed, but for simplicity we studied them as undirected networks by examining their total degree, which is the sum of in- and out-degrees for each node, and ignoring link-directions. Although many nodes could therefore support multiples links, we found that all of the considered networks, both social and nonsocial, closely followed a “scale-free” degree distribution,p(k)∝k−γ(k0=kfor notational convenience), as shown in Figure 3.
2.3.1 Online social networks
We evaluated a dataset from the Advogato online social network, wherein users can express the level of “trust” between themselves and another [12]. As mentioned above, we are only interested in the structure of the links between all individuals, and there-fore ignored any weights assigned to them. The Advogato network is composed of 3,302 nodes/users linked together by 32,954 links.
100
101 102
103
10-4
10-3
10-2
10-1
100
10-4
10-3
10-2
10-1
100
100 101
102
103
100
101
102
103
p(k)
p(k)
Degree, k Degree, k Degree, k
Advogato Gnutella Wiki-Vote
Airports E. coli S. cerevisiae
γ=−1.34
γ=−2.25
γ=−1.12 γ=−1.12
γ=−1.00
γ=−1.30
Figure 3 Degree distributions of all networks studied here.The top panels represent social networks, and the bottom panels are nonsocial networks. All degree distributions were fit empirically to a power-law function,p(k)∝kγ, using a least-squares method;kis the ego degree andγis the power-law exponent.
The Wiki-Vote network was derived from a complete dump of the Wikipedia page-edit history (3 January, 2008) [14,15]. Wikipedia users may be promoted to administra-tors, who enjoy additional technical and maintenance capabilities of the website, which requires a public vote among its users. In this network, all 8,297 nodes represent indi-vidual users, and each of the 103,689 links indicate that one person voted for the other.
2.3.2 Nonsocial networks
As examples of nonsocial networks, we chose a physical transportation network, labeled “Airports”. This network maps flights scheduled between the 500 busiest airports in the United States (US) in 2002 [16]. In this dataset, a node represents one of 500 US airports, while each of its 2980 links denote whether a flight was scheduled from one airport to another. While this network is manifestly undirected, it is weighted. We therefore ignored the weights in favor of the network topology alone.
We compared this transportation network with two transcriptional regulatory net-works, which relate the expression of genes (nodes) that interact by producing proteins, termed transcription factors, that may alter the expression level of other genes. We employed two experimentally validated datasets from the literature, obtained using the GeneNetWeaver software package [17]; one for the model bacterium Escherichia coli (E. coli), and the common baker’s yeastSaccharomyces cerevisiae(S. cerevisiae). TheE. colinetwork consisted of 1565 nodes and 3758 (directed) links, whereas theS. cerevisiae network supported 4441 nodes and 12873 links. While the degree distribution of these networks generally follows a power-law (Figure 3), its structure differs substantially from a social network in that it is primarily hierarchical [18], with a few apical “master regulator” proteins that control the expression of a great many genes.
3 Results
3.1 Above-averagem-chain neighbor degrees in social networks
1 2 3 4 5 1 2 3 4 5 1 2 3 4 5
Geodesic distance, m Geodesic distance, m Geodesic distance, m
Advogato Gnutella Wiki-Vote
Airports E. coli S. cerevisiae
103
102
101
100
103
102
101
100
<
km<
<
km<
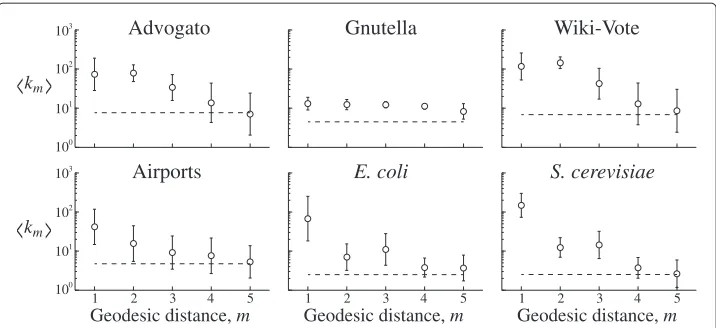
Figure 4 Degrees of nodes at the end ofm-chains.Shown are three social (top row) and nonsocial (bottom row) networks. Error bars denote standard deviations obtained from lognormal distributions. Horizontal dotted lines denote the average degree of nodes in the network,k0.
at the end of the chain should approach the average connectivity of the graph,k0(dotted lines, Figure 4). To estimatekm, we observed thatm-chain degree neighbor distributions appeared lognormal, from which we estimated the mean (circles) and standard devia-tion (error bars); however, the degree distribudevia-tion of the nodes themselves,k0, were power-law distributed (Figure 3).
For the nonsocial networks (bottom row of Figure 4), the conditionkm = k0occurs at approximatelym=3 orm=4, while for the social networks we findm≥4. Addition-ally, the quantitykm(m>0) remains elevated over the identical geodesic length of the nonsocial networks. In other words, not only do your friends have more friends than you do, but so do your friends’ friends’ friends’ friends.
One potential explanation for this effect may come from the tendency for social net-works to form larger clumps of highly-connected nodes that, together, are only sparsely connected [19]. If nodes that are connected throughm-chains can often be found within a highly-connected community, or if a node within a community can be easily reached through anm-chain, thenkmwill be biased toward the connectivity of the community.
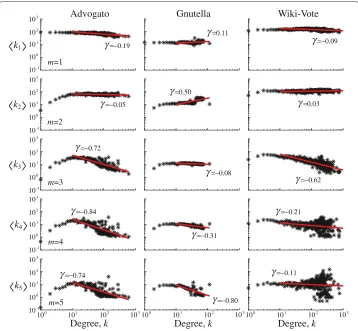
3.2 Assortative mixing beyond the nearest neighbors in social networks
Figure 5 illustrates how the average m-chain neighbor degree, km, varies with ego degree,k, for the three social networks; Figure 6 illustrates this relationship for the three additional nonsocial networks. It has been noted previously that some networks exhibit non-monotone degree correlation [10], with a cross-over point neark = 10, which has been observed before in models of random networks [20]. We therefore used a power-law function,km(k)∼ kγ, whereink0=klabels ego degrees, to empirically model the tail of them-chain neighbor degrees. This feature is not clearly present in the nonsocial networks; so, we fit a power-law function across the whole domain of its degree.
Advogato Gnutella Wiki-Vote 103
102
101
100
10-1
103
102
101
100
10-1
103
102
101
100
10-1
103
102
101
100
10-1
103
102
101
100
10-1
103
102
101
100 100 101 102 103100 101 102 103
m=1
m=2
m=3
m=4
m=5
Degree, k Degree, k Degree, k
<
k2<
<
k1<
<
k3<
<
k4<
<
k5<
γ=−0.19
γ=−0.05
γ=−0.72
γ=−0.84
γ=−0.74
γ=0.11
γ=0.50
γ=−0.08
γ=−0.31
γ=−0.80
γ=−0.09
γ=0.03
γ=−0.62
γ=−0.21
γ=−0.11
Figure 5 Degree-correlation curves for social networks.Average degree of alter nodes separated by
m-chains,km, versus the ego degree,k, for all three social networks studied here.
networks of Figure 5 exhibit nearly flat correlation, the nonsocial networks of Figure 6 appear disassortative ink1. In light of the argument made by Park and Newman [21], the nearly flat behavior ofk1seen in Figure 5 could result from positive correlative trends.
Another observation we can make by comparing Figures 5 and 6, is that the nonsocial networks, specifically the transcriptional networks, exhibit opposite correlations between 1- and 2-chain neighbors,k1andk2, respectively. Additionally, the extended correla-tions (m>2) in the nonsocial networks are consistently positive (Figures 6 and Tables 1 and 2), which should be contrasted against the consistently disassortative correlations (γ <0 andr<0) exhibited by the social networks (Figure 5).
Airports E. coli S. cerevisiae 103 102 101 100 103 102 101 100 103 102 101 100 103 102 101 100 m=1 m=2 m=3 m=4 m=5
Degree, k Degree, k Degree, k
<
k2<
<
k1<
<
k3<
<
k4<
<
k5<
10-1 103 102 101 100 10-1 103 102 101 100 10-1 103 102 101 100 10-1 103 102 101 100 10-1 10-2 10-2 10-2 10-2 10-2 γ=−0.16 γ=0.13 γ=−0.05 γ=−0.06 γ=0.64 γ=−0.64 γ=0.44 γ=−0.02 γ=0.32 γ=0.10 γ=−0.70 γ=0.51 γ=−0.05 γ=0.16 γ=0.24Figure 6 Degree-correlation curves for nonsocial networks.Correlations in the average degree of alter nodes separated bym-chains,km, expressed by dependence on the ego degree,k, for three nonsocial networks studied here.
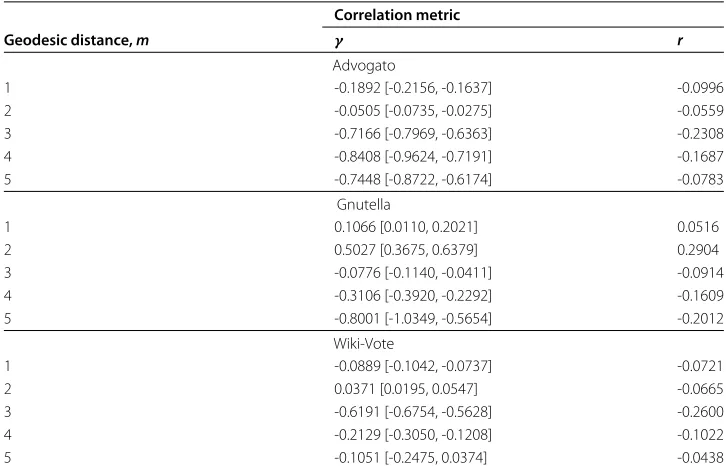
Table 1 Correlation metrics for online social networks
Correlation metric
Geodesic distance,m γ r
Advogato
1 -0.1892 [-0.2156, -0.1637] -0.0996
2 -0.0505 [-0.0735, -0.0275] -0.0559
3 -0.7166 [-0.7969, -0.6363] -0.2308
4 -0.8408 [-0.9624, -0.7191] -0.1687
5 -0.7448 [-0.8722, -0.6174] -0.0783
Gnutella
1 0.1066 [0.0110, 0.2021] 0.0516
2 0.5027 [0.3675, 0.6379] 0.2904
3 -0.0776 [-0.1140, -0.0411] -0.0914
4 -0.3106 [-0.3920, -0.2292] -0.1609
5 -0.8001 [-1.0349, -0.5654] -0.2012
Wiki-Vote
1 -0.0889 [-0.1042, -0.0737] -0.0721
2 0.0371 [0.0195, 0.0547] -0.0665
3 -0.6191 [-0.6754, -0.5628] -0.2600
4 -0.2129 [-0.3050, -0.1208] -0.1022
5 -0.1051 [-0.2475, 0.0374] -0.0438
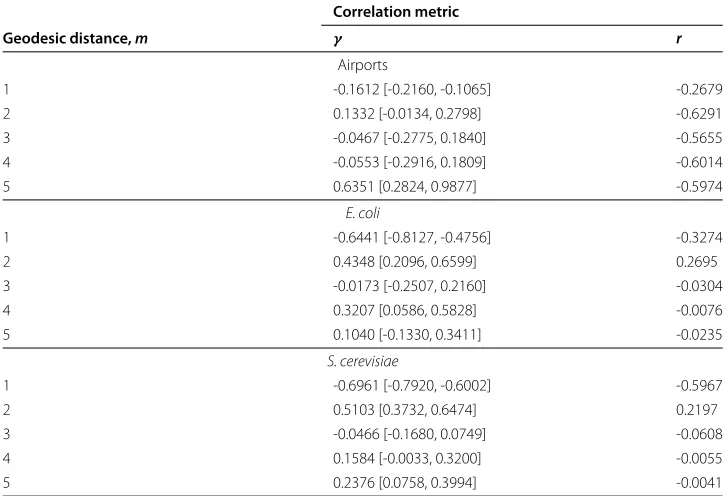
Table 2 Correlation metrics for nonsocial networks
Correlation metric
Geodesic distance,m γ r
Airports
1 -0.1612 [-0.2160, -0.1065] -0.2679
2 0.1332 [-0.0134, 0.2798] -0.6291
3 -0.0467 [-0.2775, 0.1840] -0.5655
4 -0.0553 [-0.2916, 0.1809] -0.6014
5 0.6351 [0.2824, 0.9877] -0.5974
E. coli
1 -0.6441 [-0.8127, -0.4756] -0.3274
2 0.4348 [0.2096, 0.6599] 0.2695
3 -0.0173 [-0.2507, 0.2160] -0.0304
4 0.3207 [0.0586, 0.5828] -0.0076
5 0.1040 [-0.1330, 0.3411] -0.0235
S. cerevisiae
1 -0.6961 [-0.7920, -0.6002] -0.5967
2 0.5103 [0.3732, 0.6474] 0.2197
3 -0.0466 [-0.1680, 0.0749] -0.0608
4 0.1584 [-0.0033, 0.3200] -0.0055
5 0.2376 [0.0758, 0.3994] -0.0041
Power-law exponents from Figure 6 reported with 95% confidence intervals, and Pearson correlation scores calculated using Eq. 4.
allows for a variable number of links to be drawn at each attachment step. More specif-ically, we choose to attachl-many links at each attachment step by roundingNP(x≤k) up to the nearest whole numberl, whereinP(x≤k)is the cumulative degree distribution andNis the sum-total of nodes, both evaluated at the current attachment step. Because all random networks are grown on a node-by-node basis, wherein the number of links are determined by the step-wise attachment algorithm, we “grew” each network to the size of a chosen representative social network, the Advogato network, which hosts a total of 3302 nodes.
The other node-by-node attachment mechanism was reported by Vàzquez [20], and termed the “random walk” model. Here, nodes are attached following the linear attach-ment kernel of the Barabàsi-Albert model as stated above, but an additional step is added: a neighbor node is chosen at random with uniform probability, and with probabilityqe, a link is drawn from the candidate node (the one just attached) to the neighbor node. If this secondary link attachment is successful, then this “random walk” procedure contin-ues until the check of each newqefails. A primary feature of networks grown using this model is that their degree correlations are “mixed”; that is, lower-degree nodes exhibit positive correlations, while the higher degree nodes exhibit disassortative tendencies. We have previously observed such behavior in a wide variety of directed, real-world net-works [10], but this behavior can also be seen in the behavior ofkm(k)for the social networks illustrated in Figure 5.
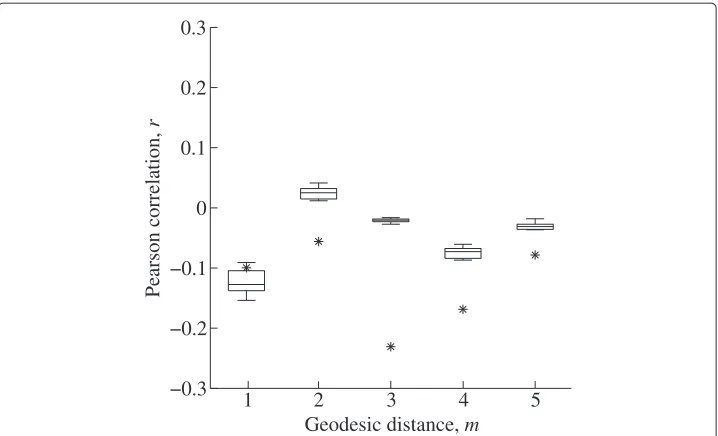
−0.3 −0.2 −0.1 0 0.1 0.2 0.3
5
1 2 3 4
Geodesic distance, m
Pearson correlation,
r
Figure 7 Pearson correlations for the Advogato network.Pearson correlations,r(Eq. 4), for the Advogato network (asterisks) compared against results from 10 generated random networks (box plots) using a variant on the Barabàsi-Albert model [22] of scale-free networks described within the text.
higher degree nodes (Figure 5), the Pearson scores show a weaker overall correlation at long geodesic distances; however, the random network models show nearly no correlation except among first-neighbors (m=1, Figure 7).
This can be contrasted against results from the random walk model of Vàzquez [20], illustrated for various values ofqein Figure 8. These random networks generally show assortative degree correlations in first-neighbors for all values ofqe, but mostly disassor-tative degree mixing among nodes at longer geodesic distances. This result is generally consistent with the trends observed for the social networks (see Figure 5, and asterisks in
qe=0.10
0.4
0.2
0
-0.2
-0.4
-0.6
-0.8
-1.0
qe=0.17 qe=0.30 qe=0.52 qe=0.90
Pearson correlation,
r
1 2 3 4 5 1 2 3 4 5 1 2 3 4 5 1 2 3 4 5 1 2 3 4 5
Geodesic distance, m
Figure 8 Pearson correlations between the Advogato and random networks.Pearson correlations,r
Figure 8). Nevertheless, close matching of the Pearson scores only occurs forqe = 0.9. Such a high value ofqeguarantees many successful sequential attachment rounds in the random walk procedure, and thus increases the overall number of links. Whether the closer matching of Pearson scores at highqeis the result of the increased number of links, or their approximate placement, remains an open question.
4 Summary and Conclusions
In this paper we have studied three online social networks, and compared their long-range degree correlation behavior to those of three nonsocial networks by measuring both the average number of neighbors or calculating the Pearson correlation score. We found that the number of friendships/associations in the social networks remained above the background level for at leastm = 4 “degrees of separation”. In contrast, the nonso-cial networks reached the background level after approximatelym = 3 steps from each node.
We also examined the conditional probability that a node degree is connected to one separated by at least one link, p(km|k0), by measuring the average number of nearest neighbors,km(k0). We found that the social networks generally exhibited a power-law tail with exponentγ <1, for the longer-range interactions (m≥3). We did not observe this phenomenon in the nonsocial networks, which appeared nearly uncorrelated at this geodesic distance.
Finally, we considered the Advogato network as a prototypical social network, and examined whether two network-growing algorithms known to generate degree corre-lations could reproduce the long-range correcorre-lations observed in the social network as measured by the Pearson correlation. While we observed that the “random walk” algo-rithm [20] and a variant of the celebrated Barabàsi-Albert (preferential attachment) model [22] showed similar uncorrelated results at the farthest separation (m = 5), correlations in the Advogato network deviated substantially from the random mod-els for m < 5. We conclude that these random node-attachment mechanisms can-not fully explain how social networks gain new users, but could can-not entirely reject this possibility. Further investigations are therefore required to definitively answer this question.
Competing interests
The authors declare that they have no competing interests.
Authors’ contributions
MM and PG conceptualized and designed the study, and interpreted the results. MM and AA executed the research. MM, AA, and PG wrote the paper. All authors read and approved the final manuscript.
Acknowledgements
Funding was provided by the US Army’s Environmental Quality and Installations 6.1 Basic Research program. Opinions, interpretations, conclusions, and recommendations are those of the author(s) and are not necessarily endorsed by the U.S. Army.
Author details
1Environmental Laboratory, US Army Engineer Research and Development Center, 3909 Halls Ferry Rd, 39183 Vicksburg,
MS, USA.2Department of Computer Science, Virginia Commonwealth University, 401 West Main Street, 23284 Richmond, VA, USA.
References
1. Newman, MEJ: Assortative mixing in networks. Phys. Rev. Lett.89, 208701 (2002)
2. McPherson, M, Smith-Lovin, L, Cook, JM: Birds of a feather: Homophily in social networks. Annu. Rev. Sociol. 27, 415–444 (2001)
3. Feld, SL: Why your friends have more friends than you do. Am. J. Sociol.96, 1464–1477 (1991) 4. Christakis, NA, Fowler, JH: The spread of obesity in a large social network over 32 years. New Engl. J. Med.
357, 370 (2007)
5. Christakis, NA, Fowler, JH: The collective dynamics of smoking in a large social network. New Engl. J. Med. 358, 2249 (2008)
6. Christakis, NA, Fowler, JH: Social contagion theory: examining dynamic social networks and human behavior. Stat. Med.32, 556 (2011)
7. Dawah, HA, Hawkins, BA, Claridge, MF: Structure of the parasitoid communities of grass-feeding chalcid wasps. J. Anim. Ecol.64, 708 (1995)
8. Redner, S: Teasing out the missing links. Nature.453, 47 (2008)
9. Pastor-Satorras, R, Vàzquez, A, Vespignani, A: Dynamical and correlation properties of the internet. Phys. Rev. Lett. 87, 258701 (2001)
10. Mayo, M, Abdelzaher, A, Ghosh, P: Mixed degree-degree correlations in directed social networks. In: Zhang, Z, Wu, L, Xu, W, Du, D-Z (eds.) Combinatorial Optimization and Applications. Lecture Notes in Computer Science,
pp. 571–580. Springer, (2014)
11. Serrano, M, Maguitman, A, Boguñá, M, Fortunato, S, Vespignani, A: Decoding the structure of the www: A comparative analysis of web crawls. ACM Trans. Web.1, 10 (2007)
12. Massa, P, Salvetti, M, Tomasoni, D: Bowling alone and trust decline in social network sites. In: Proceedings of the Eighth IEEE International Conference on Dependable, Autonomic and Secure Computing, DASC’09, pp. 658–663. IEEE, (2009)
13. Ripeanu, M, Foster, I, Iamnitchi, A: Mapping the gnutella network: Properties of large-scale peer-to-peer systems and implications for system design. IEEE Internet. Comput.6, 50–57 (2002)
14. Leskovec, J, Huttenlocher, D, Kleinberg, J: Signed networks in social media. In: Proceedings of the SIGCHI Conference on Human Factors in Computing Systems, pp. 1361–1370. ACM, (2010)
15. Leskovec, J, Huttenlocher, D, Kleinberg, J: Predicting positive and negative links in online social networks. In: Proceedings of the 19th International Conference on World Wide Web, pp. 641–650. ACM, (2010) 16. Colizza, V, Pastor-Satorras, R, Vespignani, A: Reaction-diffusion processes and metapopulation models in
heterogeneous networks. Nature Physics.3, 276–282 (2007)
17. Schaffter, T, Marbach, D, Floreano, D: Genenetweaver: in silico benchmark generation and performance profiling of network inference methods. Bioinformatics.27(16), 2263–2270 (2011). doi:10.1093/bioinformatics/btr373 18. Ma, H-W, Buer, J, Zeng, A-P: Hierarchical structure and modules in the escherichia coli transcriptional regulatory
network revealed by a new top-down approach. BMC Bioinf.5, 199 (2004)
19. Girvan, M, Newman, MEJ: Community structure in social and biological networks. P. Natl. Acad. Sci. USA. 99, 7821–7826 (2002)
20. Vàzquez, A: Growing network with local rules: Preferential attachment, clustering hierarchy, and degree correlations. Phys. Rev. E.67, 056104 (2003)
21. Park, J, Newman, MEJ: Origin of degree correlations in the internet and other networks. Phys. Rev. E.68, 026112 (2003) 22. Barabàsi, A-L, Albert, R: Emergence of scaling in random networks. Science.286, 509–512 (1999)
23. Krapivsky, PL, Redner, S: Organization of growing random networks. Phys. Rev. E.63, 066123 (2001)
Submit your manuscript to a
journal and benefi t from:
7Convenient online submission
7Rigorous peer review
7Immediate publication on acceptance
7Open access: articles freely available online
7High visibility within the fi eld
7Retaining the copyright to your article