O R I G I N A L R E S E A R C H
Open Access
Partial-volume correction in dynamic
PET-CT: effect on tumor kinetic parameter
estimation and validation of simplified
metrics
M. C. F. Cysouw
1*, S. V. S. Golla
1, V. Frings
1, E. F. Smit
2, O. S. Hoekstra
1, G. M. Kramer
1, R. Boellaard
1and on behalf
of the QuIC-ConCePT Consortium
Abstract
Background:Partial-volume effects generally result in an underestimation of tumor tracer uptake on PET-CT for small lesions, necessitating partial-volume correction (PVC) for accurate quantification. However, investigation of PVC in dynamic oncological PET studies to date is scarce. The aim of this study was to investigate PVC’s impact on tumor kinetic parameter estimation from dynamic PET-CT acquisitions and subsequent validation of simplified semi-quantitative metrics. Ten patients with EGFR-mutated non-small cell lung cancer underwent dynamic18F-fluorothymidine PET-CT before, 7 days after, and 28 days after commencing treatment with a tyrosine kinase inhibitor. Parametric PVC was applied using iterative deconvolution without and with highly constrained backprojection (HYPR) denoising, respectively. Using an image-derived input function with venous parent plasma calibration, we estimated full kinetic parametersVT,K1, andk3/k4(BPND) using a reversible two-tissue compartment model, and simplified metrics (SUV and tumor-to-blood ratio) at 50–60 min post-injection.
Results:PVC had a non-linear effect on measured activity concentrations per timeframe. PVC significantly changed each kinetic parameter, with a median increase in VTof 11.8% (up to 25.1%) and 10.8% (up to 21.7%) without and with HYPR, respectively. Relative changes in kinetic parameter estimates vs. simplified metrics after applying PVC were poorly correlated (correlations 0.36–0.62;p< 0.01). PVC increased correlations between simplified metrics and VTfrom 0.82 and 0.81 (p< 0.01) to 0.90 and 0.88 (p< 0.01) for SUV and TBR, respectively, albeit non-significantly. PVC also increased correlations between treatment-induced changes in simplified metrics vs. VTat 7 (SUV) and 28 (SUV and TBR) days after treatment start non-significantly. Delineation on partial-volume corrected PET images resulted in a median decrease in metabolic tumor volume of 14.3% (IQR−22.1 to−7.5%), and increased the effect of PVC on kinetic parameter estimates.
Conclusion:PVC has a significant impact on tumor kinetic parameter estimation from dynamic PET-CT data, which differs from its effect on simplified metrics. However, it affected validation of these simplified metrics both as single measurements and as biomarkers of treatment response only to a small extent. Future dynamic PET studies should preferably incorporate PVC.
Trial registration:Dutch Trial Register,NTR3557.
Keywords:Dynamic PET-CT, Kinetic parameter estimation, Partial-volume correction, Oncology
* Correspondence:[email protected]
1Department of Radiology and Nuclear Medicine, Amsterdam UMC, Vrije
Universiteit Amsterdam, Cancer Center Amsterdam, De Boelelaan 1117, Amsterdam, the Netherlands
Full list of author information is available at the end of the article
Background
In clinical oncology, positron-emission tomography (PET) is a valuable tool allowing guidance of treatment on a
per-patient basis [1]. Clinical decision-making using
PET-CT is commonly limited to visual analysis, where local disease and the presence of nodal or distant
metasta-ses is evaluated [2,3]. However, since PET is an inherently
quantitative technique, it may also be used for quantitative assessment of tumor metabolic, proliferative, or drug tar-geting characteristics [1,4,5].
For quantitative PET-CT to be of practical clinical util-ity, metrics need to be easily extracted from static whole-body PET-CT images as performed in routine clin-ical practice. To this end, standardized uptake values (SUV) are typically used as simplified semi-quantitative
measures of tracer uptake [6]. However, pharmacokinetic
modeling using dynamic PET-CT acquisitions with arterial or venous blood sampling is an essential first step to tech-nically validate the clinical use of these simplified metrics as biomarkers of, e.g., response to treatment [4,5,7,8].
As is well known, quantification of tracer distribution on PET-CT scans is hampered by several sources of error. Among these are attenuation, Compton scatter, random coincidences, and decay, all accounted for by contemporary image reconstruction algorithms. How-ever, due to the inherently limited spatial resolution of PET-CT, acquired images still suffer from partial-volume
effects [9]. Partial-volume effects lead to spill-in and
spill-out of measured activity distributions, generally resulting in net underestimations of tracer uptake, the extent of which depend on tumor size, shape, and
con-trast [9]. Hence, partial-volume correction (PVC) is
needed for accurate quantification, especially for small
and/or heterogeneous lesions [9–12].
In oncological studies, PVC has been predominantly applied to static PET-CT images (in contrast with brain
[13–22] or cardiac [23, 24] PET imaging). However, in
dynamic acquisitions, the activity spill-over in and from tumors due to partial-volume effects may vary over time. The impact of PVC on tumor kinetic parameter esti-mates could therefore differ from its impact on simpli-fied measures of uptake. Consequently, it may not only affect absolute quantitative reads but also validation of simplified parameters for clinical implementation.
The present study aims to evaluate the impact of frame-wise parametric PVC in dynamic PET-CT studies on tumor kinetic micro- and macroparameter estima-tions, and evaluate the correlation between its effect on kinetic parameters and simplified metrics. Secondly,
PVC’s effect on technical validation of simplified
18
F-fluorothymidine (18F-FLT) PET-CT metrics as
bio-markers of response to treatment of non-small cell lung cancer (NSCLC) with tyrosine kinase inhibitors (TKI) will be investigated.
Methods and materials Patients
The present study is a retrospective analysis of a
pro-spective cohort study [5]. Patients with metastatic
epi-dermal growth factor receptor (EGFR) mutated NSCLC scheduled for treatment with an EGFR-TKI were
in-cluded. All patients were scanned with18F-FLT PET-CT
on three occasions: at baseline, 7 days after, and 28 days after commencing treatment with a TKI (gefitinib or er-lotinib), respectively. The Amsterdam UMC (location VUmc) institutional review board approved this study (Dutch Trial Register, NTR3557), and all included pa-tients provided informed consent for study participation.
PET-CT image acquisition and reconstruction
The EARL-compliant imaging protocol was described
pre-viously [5]. All scans were acquired on a Philips Gemini
TF-64 PET-CT scanner (Philips Healthcare). Patients were instructed not to eat 4 h prior to each scan. A thoracic field of view was placed such that it contained the primary tumor, using a transmission scan for positioning. A 60-min dynamic PET acquisition started directly after
in-jection of 370 MBq18F-FLT in 5 mL saline (flushed with
20 mL saline). Afterwards, a low-dose CT was acquired for attenuation correction (120 kV, 50 mAs). The PET emission scan was binned into 36 frames with varying du-rations (1 × 10, 8 × 5, 4 × 10, 3 × 20, 5 × 30, 5 × 60, 4 × 150, 4 × 300, and 2 × 600 s). Images were reconstructed with a
time-of-flight 3D row action maximum likelihood
algorithm (3 iterations, 33 subsets), as provided by the vendor, with corrections for Compton scatter, random co-incidences, attenuation, and decay. PET image dimensions were 144 × 144 × 45 voxels with voxel dimensions of 4 × 4 × 4 mm. Venous blood samples were drawn at 5,
10, 20, 30, 40, and 60 min post-injection of18F-FLT. From
each sample, the whole blood and plasma activity concen-trations and parent fractions were measured.
Image processing
For PVC, we applied a post-reconstruction iterative
de-convolution algorithm (Lucy-Richardson [LR]) [25]. This
parametric (voxel-wise) method aims to deblur images by iteratively correcting the activity spill-over, only assuming
approximate knowledge of the PET-CT scanner’s spatial
resolution. We set the full-width at half-maximum (FWHM) of a spatially invariant Gaussian point spread function at 7.5 mm, as previously calibrated in phantom
experiment for the used scanner [11], with ten iterations
allowing for sufficient convergence. PVC was applied to each image frame. As iterative deconvolution is known to result in lower signal-to-noise ratios (SNR), in order to evaluate effect of image noise we additionally applied a highly constrained backprojection (HYPR) algorithm
Iterative deconvolution was applied without and with HYPR denoising (denotated as LR and LR + HYPR, re-spectively). HYPR settings were optimized, comparing a
single composite image (HYPRsingle) and several moving
frame composite images (HYPRmoving), using a Gaussian
7.5 mm FWHM low-pass filter (F). The HYPR implemen-tation can be described as follows [21,26]:
IH ¼IcIw ð1Þ
Ic¼XIiΔti ð2Þ
Iw¼ FFIoIc ð3Þ
whereIH is the HYPR image;Ic is the composite image,
which is a duration weighted summed average of either all frames in the dynamic image (HYPRsingle) or a set of
frames around the to be denoised frame (HYPRmoving),
with Δti as the individual frame duration; Io is the
ori-ginal dynamic frame being denoised; and Iw is the
weighting image computed as the ratio between the spatially filtered original frame and spatially filtered composite image.
Kinetic modeling and semi-quantitative analysis
Lesions were delineated using in-house developed soft-ware (VU University Medical Center) on a
volume-of-interest (VOI) basis [28]. Tumor delineation was
performed on a summation of the last three PET frames of the original (non-PVC) image. In short, a rough man-ual delineation was performed, warranting all peak
18
F-FLT-avid tumor activity was contained in the VOI and no non-tumor structures with high uptake were in-cluded. Second, this VOI was shrunk to an isocontour based on 50% of the peak value (mean activity in a 12-mm sphere positioned to provide the highest uptake value), with correction for local background activity. VOIs were then projected onto each frame of both the original and partial-volume corrected PET images to ac-quire time activity curves from both the datasets (with-out and with PVC). To explore the effect of PVC on tumor delineation, tumors were also delineated on the LR + HYPR images using the same approach. Metabolic-ally active tumor volume (MATV) was defined as the sum of voxel volumes within a VOI.
A 2 × 2 voxel (8 × 8 mm) region was placed centrally in ascending aorta on five adjacent slices to acquire an image-derived input function (IDIF), aiming to avoid partial-volume effects. Parent plasma input functions were generated by calibrating IDIFs using the activity concentrations measured in the venous blood samples, and correcting for metabolites and plasma-to-blood ra-tio. Full quantitative parameters derived from kinetic modeling and simplified measures were extracted using
in-house developed software in MATLAB. We used a re-versible two-tissue model with blood volume parameter, which has been identified as the optimal compartment
model for 18F-FLT by Frings et al. [5]. Pharmacokinetic
parameters rate of influx of the tracer from blood to
tis-sue (K1), volume of distribution (VT), and binding
poten-tial (BPND) of each lesion were derived using non-linear
regression, where:
VT ¼Kk1
2 1þ
k3
k4
ð4Þ
BP¼kk3
4 ð5Þ
VTserved as the preferred reference parameter for
val-idation of simplified metrics for18F-FLT [5]. The
simpli-fied metrics, mean SUV, and tumor-to-blood ratio (TBR;
parent plasma) were derived at a 50–60 min
post-injection scan interval, where:
SUV¼
activity concentration Bq
mL
injected activity Bq½ lean body mass
ð6Þ
TBR¼
tumor activity concentration Bq
mL
blood activity concentration Bq
mL
ð7Þ
Statistical analysis
Data were described as mean with standard deviation (SD), median with interquartile range (IQR), minimum and maximum. Correlations between pairwise data were investigated using Spearman correlation. To assess tech-nical validation of simplified metrics, we assessed correla-tions between both single measurements of kinetic parameter estimations and simplified metrics as well as correlations between relative changes in these parameters during treatment. Differences were tested using the Wil-coxon signed rank test (two related) or the Friedman test
(multiple related), with significance level p< 0.05. SPSS
Statistics v22 (IBM) was used for statistical analyses.
Results Patients
lesions at PET-CT. Twenty-four suspected lesions were
detected on18F-FLT PET-CT [5].
HYPR optimization
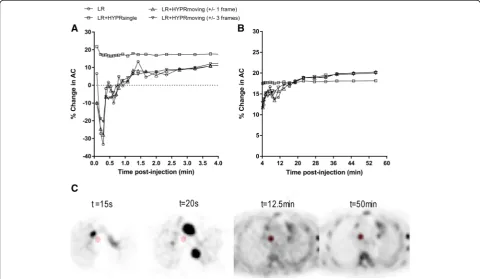
A single composite (HYPRsingle) provided most SNR
im-provement (Additional file1: Figure S1). However, it
elimi-nated the temporal dynamics of PVC (Fig.1). A HYPRmoving
setting with a composite image consisting of ± 3 frames rela-tive to the denoised frame provided an adequate trade-off between SNR improvement and partial-volume correction and was hence used in further analyses.
Image-derived input functions
We verified the assumption that partial-volume effects do not affect ascending aorta-derived IDIFs (based on the 2 × 2 voxel VOI approach used that minimized or avoided partial volume effects). First, PVC introduced only small relative differences in IDIF area under the
curve (AUC; Table 1), which were mitigated by
HYPR-moving and reduced to 0% by HYPRsingle (the latter
pro-viding most noise mitigation). As a consequence, IDIF AUCs of uncorrected and PVC images were highly
cor-related (Additional file1: Table S1). Similar results were
observed for parent plasma calibrated input curves. Also, kinetic parameter estimates derived from uncorrected
images using uncorrected vs. PVC input functions were
very similar (Additional file 1: Table S2); small but
sig-nificant differences in VTand K1were observed for LR
and LR + HYPRmoving IDIFs, but not when HYPRsingle
was applied. Therefore, we continued our analyses using the parent plasma calibrated input functions derived from uncorrected PET images.
Kinetic parameter estimates and simplified metrics Relative differences between uncorrected and PVC data
forK1,VT, BPND, SUV, and TBR are presented in Table2.
Both LR and LR + HYPRmovingsignificantly (p< 0.001)
in-creased each parameter. Overall, LR provided larger
changes in parameters than LR + HYPRmoving for both
kinetic parameters and simplified metrics. Regarding
kin-etic parameters, largest changes were seen for VT, which
was increased by median 13.2% up to 25.1% using LR.
Changes inK1and BPNDwere very similar (median 6.8%
and 6.0%, respectively, using LR). Changes in SUV and TBR after PVC were almost identical, as expected, and
were comparable to changes in VT. LR and LR +
HYPR-moving decreased VT, K1, and BPND in some lesions, but
only provided increases for SUV and TBR. Changes inVT,
K1, and BPND after PVC had low but significant
correla-tions with changes in SUV and TBR after PVC (Table3);
highest correlations were seen between relative changes in
VTand changes in SUV and TBR (up to 0.62).
We plotted relative changes inVT,K1, BPND, and SUV
after PVC as a function of lesion (original) MATV to provide insight into the effect of lesion size on PVC
per-formance (Fig. 2). For LR, the correlations between
MATV and relative change in VT, K1, BPND, SUV, and
TBR were −0.39, −0.47, −0.36, −0.80, and −0.80,
re-spectively (p< 0.01). For LR + HYPR, these correlations
were −0.43, −0.34, −0.24, −0.81, and −0.80,
respect-ively (p< 0.01, except for BPND;p= 0.07).
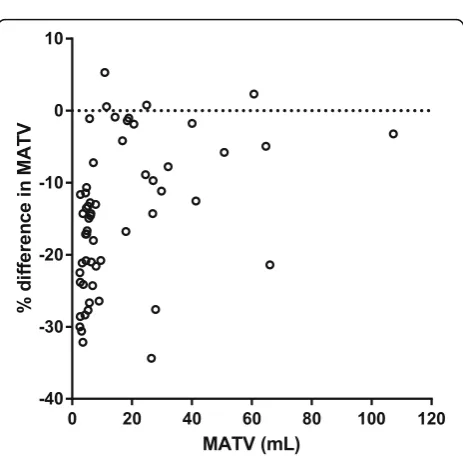
Compared to tumor delineation on uncorrected im-ages, delineation on partial-volume corrected images
(LR + HYPRmoving) provided a median relative decrease
in MATV of 14.3%, (IQR −22.1 to −7.5, minimum −
69.2, maximum 5.3; Fig. 3). Also, the effect of PVC on
kinetic parameters and simplified metrics was higher when using VOIs generated on PVC images compared
to when using original VOIs (Additional file 1: Table
S3). Here, largest increases after PVC were seen forVT,
SUV, and TBR with median increases of 13.9% (IQR 7.6–18.7; max 37.8%), 15.8% (IQR 8.4–20.4; max 31.5), and 15.8% (IQR 8.4–20.7; max 34%), respectively.
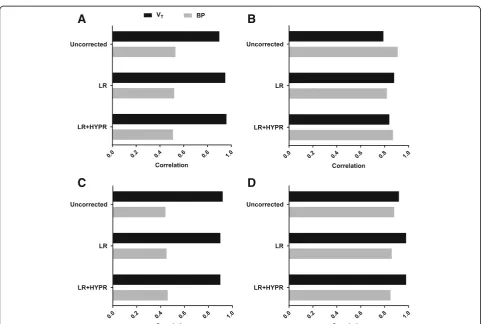
Technical validation of simplified metrics
PVC increased the correlations between SUV and VT
and K1, but not for BPND (Table 4). PVC increased the
correlations between TBR and VT, K1, and BPND
(Table 4). Largest increases in these correlations were
seen between VT and SUV (0.82 to 0.90; Fig. 4).
However, confidence intervals of these correlations over-lapped and therefore were not statistically significant.
During treatment, VT, BPND, SUV, and TBR
signifi-cantly decreased, while K1 did not change (as was also
observed in Frings et al. [5]), regardless of PVC (pvalues
in Additional file 1: Table S4). At 7 and 28 days after
starting treatment, original MATV demonstrated a
me-dian decrease of 16.1% (IQR −38.9 to−0.6), and 17.6%
(IQR −58.3 to 4.3). We correlated treatment-induced
relative changes in kinetic parameters to treatment-in-duced relative changes in simplified metrics during treat-ment with TKIs for the uncorrected data as well as those
with PVC (Fig.5). At both 7 and 28 days after treatment
start, changes in VTand BPND were significantly
corre-lated (0.79–0.98 and 0.44–0.91, respectively) with changes in SUV and TBR (with the exception of
correl-ation between changes in BPND vs. TBR on LR images at
7 days; 0.45,p> 0.05), regardless of PVC. PVC (both LR
and LR + HYPR) did not improve correlations between treatment induced changes in BP and changes in SUV
or TBR. PVC increased the correlation between
treatment-induced changes in SUV andVTat 7 days and
28 days (increases in correlation ranging 0.05–0.09, with overlapping confidence intervals). Also, PVC increased the correlation between treatment-induced changes in
TBR with changes in VTat 28 days, but not at 7 days,
after treatment start by 0.06 for both LR and LR + HYPR, with overlapping confidence intervals.
Table 1Median relative differences (% with IQR) in IDIF AUC of PVC-images compared to uncorrected images
Entire curve Peak only (2.5 min)
Image-derived PP calibrated Image-derived PP calibrated
LR −0.8 (−1.2 to 0.6) −0.7 (−1.3 to−0.2)* −2.0 (−3.4 to−0.9)* −1.8 (−3.7 to−0.9)*
LR + HYPRmoving −0.7 (−1.2 to 0.6) −0.6 (−1.1 to−0.1)* −2.2 (−3.2 to−0.5)* −2.0 (−3.3 to−1.1)*
LR + HYPRsingle −0.8 (−1.2 to 0.6) 0.0 (0.0 to 0.0) −0.9 (−1.2 to 0.7) 0.0 (−0.1 to 0.1) *p< 0.05.PPparent plasma
Table 2Relative changes (%) in kinetic parameter estimates and simplified metrics after PVC
Mean Median SD IQR Min Max pvalue
LR
VT 11.8 13.2 7.1 6.0–16.4 −15.2 25.1 < 0.001
K1 6.6 6.8 7.5 2.6–11.1 −16.7 32.3 < 0.001
BP 6.1 6.0 8.8 2.1–10.7 −21.9 34.6 < 0.001
SUV 13.1 13.2 6.1 7.3–17.1 3.3 28.4 < 0.001
TBR 13.1 13.2 6.1 7.3–17.1 3.3 28.3 < 0.001
LR + HYPR
VT 10.8 11.7 6.1 6.1–15.5 −13.6 21.7 < 0.001
K1 5.7 4.3 6.9 2.3–10.0 −14.9 25.1 < 0.001
BP 3.7 4.4 6.4 0.1–7.1 −20.6 19.8 < 0.001
SUV 12.6 12.9 5.8 7.0–16.7 2.1 24.7 < 0.001
TBR 12.8 12.9 6.0 7.0–17.0 3.1 27.3 < 0.001
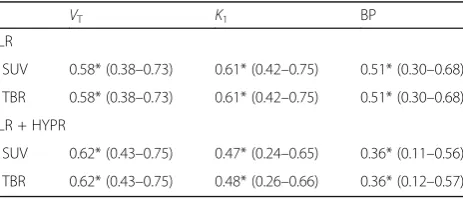
Table 3Correlation (Spearman, with 95% confidence intervals) between PVC-induced relative changes in kinetic parameter estimates and simplified metrics
VT K1 BP
LR
SUV 0.58* (0.38–0.73) 0.61* (0.42–0.75) 0.51* (0.30–0.68)
TBR 0.58* (0.38–0.73) 0.61* (0.42–0.75) 0.51* (0.30–0.68)
LR + HYPR
SUV 0.62* (0.43–0.75) 0.47* (0.24–0.65) 0.36* (0.11–0.56)
TBR 0.62* (0.43–0.75) 0.48* (0.26–0.66) 0.36* (0.12–0.57)
Discussion
In the present study, we evaluated the impact of frame-wise parametric PVC on tumor kinetic parameter estimation derived from dynamic PET-CT scans and the resulting effect on validation of simplified metrics. PVC
significantly increased both tumor micro- and
A
B
C
D
Fig. 2Relative change (%) in quantitative parameters after PVC (LR) as a function of lesion MATV (mL) forVT(a),K1(b), BP (c), and SUV (d). TBR is not displayed since it was virtually identical to SUV
Fig. 3Relative difference (%) in lesion MATV (mL) between uncorrected and PVC images (LR + HYPR) as function of MATV on uncorrected images.Y-axis was scaled to−40%; for one lesion of 5.8 mL MATV was 69% smaller on PVC image
Table 4Correlation (Spearman, with 95% confidence intervals) between kinetic parameter estimates and simplified metrics, with and without PVC
VT K1 BP
Uncorrected
SUV 0.82* (0.72–0.89) 0.43* (0.19–0.62) 0.89* (0.82–0.93)
TBR 0.81* (0.69–0.88) 0.47* (0.24–0.65) 0.82* (0.72–0.89)
LR
SUV 0.90* (0.83–0.94) 0.45* (0.22–0.63) 0.89* (0.82–0.93)
TBR 0.88* (0.81–0.93) 0.48* (0.26–0.65) 0.84* (0.74–0.90)
LR + HYPR
SUV 0.90* (0.83–0.94) 0.48* (0.26–0.65) 0.89* (0.81–0.93)
TBR 0.88* (0.81–0.93) 0.51* (0.30–0.68) 0.83* (0.73–0.90)
macrokinetic parameters, and we observed that partial-volume effects varied over time due to blood pool activity and changing tumor contrast. Hence, the effect of PVC on kinetic parameter estimates was not in full concordance with its effect on simplified metrics (SUV and TBR), and as a consequence, PVC was found to affect the validation
of SUV using VT both for single measurements and as
biomarker of treatment response to a small extent (albeit non-significantly).
Application of PVC in oncologic dynamic PET-CT studies is scarce. Mankoff et al. (2003) applied PVC in dynamic FDG-PET of breast cancer patients using a simple method with recovery coefficients, assuming le-sions are spherical with homogenous tracer distributions
[29]. They observed that applying PVC in response
mea-surements reduced changes in metabolic rate of FDG and blood flow of responding patients, reducing signifi-cance of parameter changes (albeit still statistically sig-nificant). By using this method, however, kinetic parameters were solely corrected for (changes in) tumor size, and no correction for spill-in from blood pool structures and/or heterogeneous tumor background was applied. In 2007, Teo et al. validated the use of iterative Fig. 4Scatter plot ofVTversus SUV, without and with PVC. For both
LR and LR + HYPR, the Spearman correlation betweenVTand SUV increased from 0.82 to 0.90 after PVC
A
B
C
D
deconvolution as an image-based PVC method not re-quiring anatomical segmentation or knowledge of lesion size, and suggested its potential application in kinetic modeling, which to the best of our knowledge has not
been performed to date for oncologic PET-CT [30].
Both tumor macroparameters VT and BPND, and
microparameter K1 significantly changed after
tion of PVC. This corresponds with results from applica-tions of PVC in brain dynamic PET studies, where similar increases in kinetic parameter estimations have been observed when applying PVC in the case of activity
spill-out [19–21, 31]. Interestingly, the effect of PVC on
kinetic parameter estimates was poorly (albeit signifi-cantly) correlated with its effect on simplified measures.
As previously described [9], the effect of PVC on SUV of
(hotspot) lesions on static PET-CT scans is straightfor-ward: an expected net increase in activity, mainly dependent on lesion size (and, in lesser extent, shape
and local contrast). This can be seen in Fig. 2, where
change in SUV after PVC is highly (inversely) correlated to tumor volume, while the kinetic parameter estima-tions are not. This illustrates that impact of PVC on tumor kinetic parameter estimation is more complex, as
seen in Fig. 1 which displays the non-linear temporality
of partial-volume effects for a typical mediastinal lymph node metastasis. Here, an early spill-in of activity due to blood pool proximity is noted, with increasing activity spill-out afterwards as tumor uptake increases and back-ground activity decreases. Hence, across lesions, the ef-fect of PVC on kinetic parameters may differ depending not only on size, but as well on the presence of proxim-ate high activity structures, rproxim-ate of tracer uptake during the scan, and background activity.
For quantification of functional tumor characteristic on PET-CT in clinical practice, a simplified quantitative method is necessary, obviating the need for complex and extended dynamic image acquisitions, need for blood sampling, and facilitating the possibility of whole-body acquisitions. To this end, per radiotracer and cancer type simplified metrics needs to be technically validated by
pharmacokinetic modeling using dynamic PET-CT [4].
In the current study, the effect of PVC on kinetic param-eter estimates was different from its effect on simplified metrics, which explains why it might affect validation of
these simplified metrics (usingVT). We observed a trend
that PVC increased correspondence of SUV with VT in
single measurements (correlations improving from 0.82 to 0.90) and as a biomarker of treatment response (cor-relations improving from 0.90 to 0.95 at 7 days and from 0.79 to 0.88 at 28 days after treatment start). However, confidence intervals of these correlations overlapped, which might at least partly be due to the sample size (in-herent to this type of study), and therefore these differ-ences are not statistically significant. Therefore, while
PVC is mandated to acquire accurate quantitative reads, it only increases correspondence of kinetic parameters with simplified metrics to a small extent on a cohort level. This indicates that the impact of image resolution
on technical validation of simplified metrics of 18F-FLT
as biomarkers of response to TKI might be small, and that PET images without PVC seem non-inferior for this purpose. It should be noted that for response assessment to treatments that affect tracer kinetics and blood pool activity to a larger extent than TKIs and for other cancer types more affected by spill-in (e.g., prostate cancer le-sions with urinary tract proximity), PVC may have a lar-ger impact on validation of simplified metrics.
Spill-out due to PVE will result in overestimation of metabolic tumor volumes, which increases the underesti-mation of true tracer uptake since background activity is
included [11]. A parametric PVC method may therefore
theoretically reduce inaccuracies in delineation. However, iterative deconvolution has been proposed with use of VOIs defined on uncorrected images, due to the expected
propagation of image noise after PVC [30]. We evaluated
the impact of delineation on deconvoluted images with HYPR denoising, and found not only substantial decreases
in MATVs (Fig.3) but also an increase in PVCs effect on
kinetic parameter estimates (Additional file 1: Table S3).
Nonetheless, our previous study demonstrated that the re-duction in MATV after PVC may not necessarily lead to
more accurate definition of tumor volumes [11].
In brain PET studies, frequently a small vessel such as the carotid artery needs to be utilized for IDIF generation.
This mandates PVC due to the small artery diameter [32,
33]. In this study on thoracic oncological PET-CTs, the
as-cending aorta, a large vessel, was used for IDIF generation. We noted that PVC introduced negligible differences in IDIF area under the curves, and that without denoising this introduced small but significant differences in kinetic
parameter estimates (Additional file1: Table S2). However,
since HYPR denoising using a single composite image (providing maximum noise reduction) appeared to com-pletely mitigate this effect, the effect of PVC on these in-put functions seems to be based on PVC-induced noise-propagation. Therefore, when input functions de-rived from large blood pool structures are used, PVC is preferably avoided to evade noise-induced inaccuracies in kinetic parameter estimates (assuming no spillover from nearby high activity structures).
Iterative deconvolution algorithms are known to propagate image noise, which may necessitate denoising methods to be applied to preserve image quality. Several approaches have been proposed, such as wavelet-based denoising for static PET-CT and HYPR denoising for
dy-namic acquisitions, respectively [26, 34]. We observed
using a single composite image (maximal denoising) it seems to lose the temporal dynamic course of the PVC
(Fig. 1). Including HYPRmoving resulted in very similar
outcomes compared to PVC alone, and slightly mitigated the increase in kinetic parameter estimates after PVC. The latter may not only be attributed to reduced statistical noise but also to some smoothing effects in-herent to the algorithm. Also, at late time frames, it had
no effect on intratumoral COV% (Additional file 1:
Figure S1). This might be explained by the high tumor contrast and high count number (due to the long frame
duration), as Golla et al. previously demonstrated [21].
The increase in COV% at late time frames thus seems to be a resultant of increased intratumoral heterogeneity by PVC itself. Therefore, in region-based non-linear regres-sion analyses, the impact of PVC-induced increased image noise on kinetic parameter estimation seems neg-ligible. However, it may have significant impact when tu-mors are analyzed on a parametric level.
While the presence of PVE and the consequent need for PVC are well recognized, to date PVC has rarely been applied in oncological PET studies. This may be be-cause to date there is no consensus on the optimal cor-rection strategy and data yielded from application of PVC does not seem to have triggered routine clinical
ap-plication [12, 35]. Our study now demonstrates that
PVC should not only be performed in future regular static PET-CT studies, but in dynamic PET-CT studies as well, also when simplified quantitative metrics are val-idated for clinical applications. If not applied, small le-sions should preferably be excluded from analyses, as recommended and performed in previous studies using
a 2–3-cm-diameter cut-off to avoid PVE [36, 37]. Still,
our data demonstrate that lesions above these size
thresholds are also affected by PVE (Fig.2).
Only data from 18
F-FLT PET-CT was used. However, the current dataset from a widely used whole body TOF PET-CT scanner allowed for both kinetic modeling and extraction of simplified parameters per lesion, at time points used in clinical practice due to the long acquisi-tion time (0–60 min post-injecacquisi-tion). Also, the dataset in-cluded both large and small lesions, both nearby and remote from large blood pool structures. Additionally, it facilitated evaluation of PVCs effect on validation of sim-plified parameters both in single measurements and during systemic treatment. Since we have demonstrated the significant effect of PVC in kinetic parameter estima-tion, future dynamic PET studies focusing on other PET-tracers in small tumors (e.g., PSMA-ligand PET-tracers in prostate cancer metastases) should apply PVC as a simi-lar (or simi-larger) impact of PVC may be expected. In the current study, no correction was made for potential mo-tion blurring effects, which is another factor possibly
af-fecting accuracy of kinetic parameter estimations [38].
Efforts should be made to incorporate both PVC and motion correction methodologies simultaneously for dy-namic PET studies. Also, the impact of PVC on paramet-ric kinetic analyses of oncologic dynamic PET warrants further investigation, which will require HYPR denoising to be optimized for this purpose.
Conclusion
Parametric PVC using iterative deconvolution had a sig-nificant impact on tumor kinetic macro- and micropara-meter estimations from dynamic PET-CT. The relative effects of PVC on kinetic parameter estimations and sim-plified metrics were poorly correlated. This resulted in a
non-significant trend in higher correlation betweenVTand
SUV in single reads and affected its technical validation as a biomarker of treatment response to a small extent. Therefore, the impact of image resolution on technical val-idation of simplified metrics for clinical use seems to be small. When optimized according to tracer kinetics, HYPR denoising may adequately reduce PVC-induced image noise for low count and low contrast timeframes. However, it has only limited effect on kinetic parameter estimations and thus may be obviated for region-based non-linear re-gression analysis. Future oncologic dynamic PET-CT stud-ies should preferably incorporate PVC to acquire accurate quantitative reads.
Additional file
Additional file 1:Table S1.Spearman correlations between IDIF AUCs of PVC-images and uncorrected images. All correlations were significant withp< 0.001.Table S2.Median relative differences (% with IQR) in K1, Vt, and k3/k4 of uncorrected images using uncorrected versus corrected IDIFs (PVC without and with HYPR denoising). *p< 0.05 Wilcoxon-signed-rank test.Table S3.Relative changes (%) in kinetic parameter estimates and simplified metrics after PVC using VOIs delineated on PVC images (LR + HYPR).Table S4.P-values of testing (Friedman’s test) between changes in kinetic parameter estimates and simplified metrics (with and without PVC) during treatment with TKI at 7 and 28 days after treatment start.Figure S1.Time-activity curves of intralesional image noise (COV%) without and with PVC using several HYPR settings. Frames of 0–4 min (A) and 4–60 min (B) post-injection. Results of a typical mediastinal lymph node metastasis are shown. (DOCX 450 kb)
Abbreviations
18F-FLT:3′-Deoxy-3′-18F-fluorothymidine; AUC: Area under the curve;
BPND: Non-displaceable binding potential; HYPR: Highly constrained
backprojection; IDIF: Image-derived input function;K1: Influx of tracer from blood to tissue; LR: Lucy-Richardson iterative deconvolution; NSCLC: Non-small cell lung cancer; PET: Positron-emission tomography; PVC: Partial-volume correction; SUV: Standardized uptake value; TBR: Tumor-to-blood ratio; TKI: Tyrosine kinase inhibitor; VOI: Volume of interest; VT: Volume of
distribution
Acknowledgements
Research U.K., the University of Manchester, Westfälische Wilhelms-Universität Münster, Radboud University Nijmegen Medical Center, Institut National de la Santé et de la Recherche Médical, Stichting Maastricht Radiation Oncology“Maastro Clinic,”VUmc Amsterdam, King’s College London, Universitair Ziekenhuis Antwerpen, Institute of Cancer Research–Royal Cancer Hospital, Erasmus Universitair Medisch Centrum Rotterdam, Imperial College of Science Technology and Medicine, Keosys S.A.S., Eidgenössische Technische Hochschule Zürich, Amgen NV, Eli Lilly and Company Ltd., GlaxoSmithKline Research & Development Limited, Merck KGa, Pfizer Limited, F. Hoffmann–La Roche Ltd., and Sanofi-Aventis Research and Development.
Funding
This research was supported by the Innovative Medicines Initiative Joint Undertaking (www.imi.europa.eu; grant agreement no. 115151), whose resources are composed of a financial contribution from the European Union’s Seventh Framework Programme (FP7/2007–2013) and an in-kind contribution from the companies of the European Federation of Pharmaceutical Industries and Associations.
Availability of data and materials
Data necessary to support the conclusions of this article are presented in “Results”section and supplementary data. Additional data is available on request to the corresponding author.
Authors’contributions
MC contributed to the concept, data analysis, data interpretation, and writing the manuscript. SVSG contributed to data-analysis, data interpretation, and critical reviewing of the manuscript. VF contributed to acquisition of data and critical reviewing of the manuscript. EFS contributed to acquisition of data and critical reviewing of the manuscript. OSH contributed to the concept, data interpretation, and critical reviewing of the manuscript. GMK contributed to data analysis, data interpretation, and critical reviewing of the manuscript. RB contributed to the concept, data interpretation, and critical reviewing of the manuscript. All authors read and approved the final manuscript.
Ethics approval and consent to participate
This study was approved by the medical ethical committee of the Amsterdam UMC (location VUmc), and all participants provided informed consent for study participation.
Consent for publication
Each participant provided consent for data publication.
Competing interests
The authors declare that they have no competing interests.
Publisher’s Note
Springer Nature remains neutral with regard to jurisdictional claims in published maps and institutional affiliations.
Author details
1Department of Radiology and Nuclear Medicine, Amsterdam UMC, Vrije
Universiteit Amsterdam, Cancer Center Amsterdam, De Boelelaan 1117, Amsterdam, the Netherlands.2Department of Thoracic Oncology,
Netherlands Cancer Institute, Plesmanlaan 121, Amsterdam, the Netherlands.
Received: 29 November 2018 Accepted: 25 January 2019
References
1. Boellaard R, Delgado-Bolton R, Oyen WJ, Giammarile F, Tatsch K, Eschner W, et al. FDG PET/CT: EANM procedure guidelines for tumour imaging: version 2.0. Eur J Nucl Med Mol Imaging. 2015;42:328–54.https://doi.org/10.1007/ s00259-014-2961-x.
2. Gallamini A, Zwarthoed C, Borra A. Positron emission tomography (PET) in oncology. Cancers (Basel). 2014;6:1821–89.https://doi.org/10.3390/ cancers6041821.
3. Han S, Woo S, Kim YJ, Suh CH. Impact of (68)Ga-PSMA PET on the management of patients with prostate cancer: a systematic review and meta-analysis. Eur Urol. 2018;74:179–90.https://doi.org/10.1016/j.eururo.2018.03.030.
4. Lammertsma AA. Forward to the past: the case for quantitative PET imaging. J Nucl Med. 2017;58:1019–24.https://doi.org/10.2967/jnumed.116.188029. 5. Frings V, Yaqub M, Hoyng LL, Golla SS, Windhorst AD, Schuit RC, et al.
Assessment of simplified methods to measure 18F-FLT uptake changes in EGFR-mutated non-small cell lung cancer patients undergoing EGFR tyrosine kinase inhibitor treatment. J Nucl Med. 2014;55:1417–23.https://doi.org/10.2967/ jnumed.114.140913.
6. Boellaard R, Krak NC, Hoekstra OS, Lammertsma AA. Effects of noise, image resolution, and ROI definition on the accuracy of standard uptake values: a simulation study. J Nucl Med. 2004;45:1519–27.
7. Castell F, Cook GJ. Quantitative techniques in 18FDG PET scanning in oncology. Br J Cancer. 2008;98:1597–601.https://doi.org/10.1038/sj.bjc.6604330. 8. Verwer EE, Oprea-Lager DE, van den Eertwegh AJ, van Moorselaar RJ,
Windhorst AD, Schwarte LA, et al. Quantification of 18F-fluorocholine kinetics in patients with prostate cancer. J Nucl Med. 2015;56:365–71. https://doi.org/10.2967/jnumed.114.148007.
9. Soret M, Bacharach SL, Buvat I. Partial-volume effect in PET tumor imaging. J Nucl Med. 2007;48:932–45.https://doi.org/10.2967/jnumed.106.035774. 10. Erlandsson K, Buvat I, Pretorius PH, Thomas BA, Hutton BF. A review of partial volume correction techniques for emission tomography and their applications in neurology, cardiology and oncology. Phys Med Biol. 2012;57: R119–59.https://doi.org/10.1088/0031-9155/57/21/R119.
11. Cysouw MCF, Kramer GM, Hoekstra OS, Frings V, de Langen AJ, Smit EF, et al. Accuracy and precision of partial-volume correction in oncological PET/CT studies. J Nucl Med. 2016;57:1642–9.https://doi.org/10.2967/jnumed.116.173831. 12. Cysouw MCF, Kramer GM, Schoonmade LJ, Boellaard R, de Vet HCW,
Hoekstra OS. Impact of partial-volume correction in oncological PET studies: a systematic review and meta-analysis. Eur J Nucl Med Mol Imaging. 2017; 44:2105–16.https://doi.org/10.1007/s00259-017-3775-4.
13. Wong DF, Harris JC, Naidu S, Yokoi F, Marenco S, Dannals RF, et al. Dopamine transporters are markedly reduced in Lesch-Nyhan disease in vivo. Proc Natl Acad Sci U S A. 1996;93:5539–43.
14. Giovacchini G, Lerner A, Toczek MT, Fraser C, Ma K, DeMar JC, et al. Brain incorporation of 11C-arachidonic acid, blood volume, and blood flow in healthy aging: a study with partial-volume correction. J Nucl Med. 2004;45:1471–9. 15. Price JC, Klunk WE, Lopresti BJ, Lu X, Hoge JA, Ziolko SK, et al. Kinetic
modeling of amyloid binding in humans using PET imaging and Pittsburgh compound-B. J Cereb Blood Flow Metab. 2005;25:1528–47.https://doi.org/ 10.1038/sj.jcbfm.9600146.
16. Ahmad R, Postnov A, Bormans G, Versijpt J, Vandenbulcke M, Van Laere K. Decreased in vivo availability of the cannabinoid type 2 receptor in Alzheimer's disease. Eur J Nucl Med Mol Imaging. 2016;43:2219–27.https:// doi.org/10.1007/s00259-016-3457-7.
17. Greve DN, Svarer C, Fisher PM, Feng L, Hansen AE, Baare W, et al. Cortical surface-based analysis reduces bias and variance in kinetic modeling of brain PET data. NeuroImage. 2014;92:225–36.https://doi.org/10.1016/j. neuroimage.2013.12.021.
18. Bauer M, Karch R, Neumann F, Abrahim A, Wagner CC, Kletter K, et al. Age dependency of cerebral P-gp function measured with (R)-[11C]verapamil and PET. Eur J Clin Pharmacol. 2009;65:941–6.https://doi.org/10.1007/ s00228-009-0709-5.
19. Rousset OG, Deep P, Kuwabara H, Evans AC, Gjedde AH, Cumming P. Effect of partial volume correction on estimates of the influx and cerebral metabolism of 6-[(18)F]fluoro-L-dopa studied with PET in normal control and Parkinson's disease subjects. Synapse. 2000;37:81–9.https://doi.org/10. 1002/1098-2396(200008)37:2<81::AID-SYN1>3.0.CO;2-%23.
20. Bowen SL, Byars LG, Michel CJ, Chonde DB, Catana C. Influence of the partial volume correction method on (18)F-fluorodeoxyglucose brain kinetic modelling from dynamic PET images reconstructed with resolution model based OSEM. Phys Med Biol. 2013;58:7081–106.https://doi.org/10.1088/0031-9155/58/20/7081. 21. Golla SSV, Lubberink M, van Berckel BNM, Lammertsma AA, Boellaard R.
Partial volume correction of brain PET studies using iterative deconvolution in combination with HYPR denoising. EJNMMI Res. 2017;7:36.https://doi. org/10.1186/s13550-017-0284-1.
22. Wolters EE, Golla SSV, Timmers T, Ossenkoppele R, van der Weijden CWJ, Scheltens P, et al. A novel partial volume correction method for accurate quantification of [(18)F] flortaucipir in the hippocampus. EJNMMI Res. 2018; 8:79.https://doi.org/10.1186/s13550-018-0432-2.
24. Wang T, Wu KY, Miner RC, Renaud JM, Beanlands RSB, de Kemp RA. Reproducible quantification of cardiac sympathetic innervation using graphical modeling of carbon-11-meta-hydroxyephedrine kinetics with dynamic PET-CT imaging. EJNMMI Res. 2018;8:63.https://doi.org/10.1186/ s13550-018-0421-5.
25. Tohka J, Reilhac A. Deconvolution-based partial volume correction in Raclopride-PET and Monte Carlo comparison to MR-based method. NeuroImage. 2008;39: 1570–84.https://doi.org/10.1016/j.neuroimage.2007.10.038.
26. Christian BT, Vandehey NT, Floberg JM, Mistretta CA. Dynamic PET denoising with HYPR processing. J Nucl Med. 2010;51:1147–54.https://doi. org/10.2967/jnumed.109.073999.
27. Floberg JM, Mistretta CA, Weichert JP, Hall LT, Holden JE, Christian BT. Improved kinetic analysis of dynamic PET data with optimized HYPR-LR. Med Phys. 2012;39:3319–31.https://doi.org/10.1118/1.4718669.
28. Frings V, van Velden FH, Velasquez LM, Hayes W, van de Ven PM, Hoekstra OS, et al. Repeatability of metabolically active tumor volume measurements with FDG PET/CT in advanced gastrointestinal malignancies: a multicenter study. Radiology. 2014;273:539–48.https://doi.org/10.1148/radiol.14132807. 29. Mankoff DA, Dunnwald LK, Gralow JR, Ellis GK, Schubert EK, Tseng J, et al.
Changes in blood flow and metabolism in locally advanced breast cancer treated with neoadjuvant chemotherapy. J Nucl Med. 2003;44:1806–14. 30. Teo BK, Seo Y, Bacharach SL, Carrasquillo JA, Libutti SK, Shukla H, et al.
Partial-volume correction in PET: validation of an iterative
postreconstruction method with phantom and patient data. J Nucl Med. 2007;48:802–10.https://doi.org/10.2967/jnumed.106.035576.
31. Kim E, Shidahara M, Tsoumpas C, McGinnity CJ, Kwon JS, Howes OD, et al. Partial volume correction using structural-functional synergistic resolution recovery: comparison with geometric transfer matrix method. J Cereb Blood Flow Metab. 2013;33:914–20.https://doi.org/10.1038/jcbfm.2013.29. 32. Mourik JE, Lubberink M, Klumpers UM, Comans EF, Lammertsma AA, Boellaard
R. Partial volume corrected image derived input functions for dynamic PET brain studies: methodology and validation for [11C]flumazenil. NeuroImage. 2008;39:1041–50.https://doi.org/10.1016/j.neuroimage.2007.10.022. 33. Sari H, Erlandsson K, Law I, Larsson HB, Ourselin S, Arridge S, et al.
Estimation of an image derived input function with MR-defined carotid arteries in FDG-PET human studies using a novel partial volume correction method. J Cereb Blood Flow Metab. 2017;37:1398–409.https://doi.org/10. 1177/0271678X16656197.
34. Boussion N, Cheze Le Rest C, Hatt M, Visvikis D. Incorporation of wavelet-based denoising in iterative deconvolution for partial volume correction in whole-body PET imaging. Eur J Nucl Med Mol Imaging. 2009;36:1064–75. https://doi.org/10.1007/s00259-009-1065-5.
35. Alavi A, Werner TJ, Hoilund-Carlsen PF, Zaidi H. Correction for partial volume effect is a must, not a luxury, to fully exploit the potential of quantitative PET imaging in clinical oncology. Mol Imaging Biol. 2018;20:1–3.https://doi. org/10.1007/s11307-017-1146-y.
36. Wahl RL, Jacene H, Kasamon Y, Lodge MA. From RECIST to PERCIST: evolving considerations for PET response criteria in solid tumors. J Nucl Med. 2009;50(Suppl 1):122S–50S.https://doi.org/10.2967/jnumed.108.057307. 37. Frings V, de Langen AJ, Smit EF, van Velden FH, Hoekstra OS, van Tinteren
H, et al. Repeatability of metabolically active volume measurements with 18F-FDG and 18F-FLT PET in non-small cell lung cancer. J Nucl Med. 2010; 51:1870–7.https://doi.org/10.2967/jnumed.110.077255.