ScienceDirect
Available online at Available online at www.sciencedirect.comwww.sciencedirect.com
ScienceDirect
Energy Procedia 00 (2017) 000–000
www.elsevier.com/locate/procedia
1876-6102 © 2017 The Authors. Published by Elsevier Ltd.
Peer-review under responsibility of the Scientific Committee of The 15th International Symposium on District Heating and Cooling.
The 15th International Symposium on District Heating and Cooling
Assessing the feasibility of using the heat demand-outdoor
temperature function for a long-term district heat demand forecast
I. Andri
ć
a,b,c*, A. Pina
a, P. Ferrão
a, J. Fournier
b., B. Lacarrière
c, O. Le Corre
caIN+ Center for Innovation, Technology and Policy Research - Instituto Superior Técnico, Av. Rovisco Pais 1, 1049-001 Lisbon, Portugal bVeolia Recherche & Innovation, 291 Avenue Dreyfous Daniel, 78520 Limay, France
cDépartement Systèmes Énergétiques et Environnement - IMT Atlantique, 4 rue Alfred Kastler, 44300 Nantes, France
Abstract
District heating networks are commonly addressed in the literature as one of the most effective solutions for decreasing the greenhouse gas emissions from the building sector. These systems require high investments which are returned through the heat sales. Due to the changed climate conditions and building renovation policies, heat demand in the future could decrease, prolonging the investment return period.
The main scope of this paper is to assess the feasibility of using the heat demand – outdoor temperature function for heat demand forecast. The district of Alvalade, located in Lisbon (Portugal), was used as a case study. The district is consisted of 665 buildings that vary in both construction period and typology. Three weather scenarios (low, medium, high) and three district renovation scenarios were developed (shallow, intermediate, deep). To estimate the error, obtained heat demand values were compared with results from a dynamic heat demand model, previously developed and validated by the authors.
The results showed that when only weather change is considered, the margin of error could be acceptable for some applications (the error in annual demand was lower than 20% for all weather scenarios considered). However, after introducing renovation scenarios, the error value increased up to 59.5% (depending on the weather and renovation scenarios combination considered). The value of slope coefficient increased on average within the range of 3.8% up to 8% per decade, that corresponds to the decrease in the number of heating hours of 22-139h during the heating season (depending on the combination of weather and renovation scenarios considered). On the other hand, function intercept increased for 7.8-12.7% per decade (depending on the coupled scenarios). The values suggested could be used to modify the function parameters for the scenarios considered, and improve the accuracy of heat demand estimations.
© 2017 The Authors. Published by Elsevier Ltd.
Peer-review under responsibility of the Scientific Committee of The 15th International Symposium on District Heating and Cooling.
Keywords:Heat demand; Forecast; Climate change
Energy Procedia 158 (2019) 3131–3137
1876-6102 © 2019 The Authors. Published by Elsevier Ltd.
This is an open access article under the CC BY-NC-ND license (http://creativecommons.org/licenses/by-nc-nd/4.0/)
Peer-review under responsibility of the scientific committee of ICAE2018 – The 10th International Conference on Applied Energy. 10.1016/j.egypro.2019.01.1013
10.1016/j.egypro.2019.01.1013
© 2019 The Authors. Published by Elsevier Ltd.
This is an open access article under the CC BY-NC-ND license (http://creativecommons.org/licenses/by-nc-nd/4.0/)
Peer-review under responsibility of the scientific committee of ICAE2018 – The 10th International Conference on Applied Energy.
1876-6102
ScienceDirect
Energy Procedia 00 (2018) 000–000
www.elsevier.com/locate/procedia
1876-6102 Copyright © 2018 Elsevier Ltd. All rights reserved.
Selection and peer-review under responsibility of the scientific committee of the 10th International Conference on Applied Energy (ICAE2018).
10
thInternational Conference on Applied Energy (ICAE2018), 22-25 August 2018, Hong Kong,
China
Techno-economic Evaluation of Utilizing a Small-Scale Microgrid
Yuli Astriani
a,b, GM Shafiullah
a*, Martin Anda
a, Hamzah Hilal
baSchool of Engineering and Information Technology, Murdoch University, Perth, Australia bNational Laboratory for Energy Conversion Technology, BPTT, Jakarta, Indonesia
Abstract
Microgrid deployment has offered technical and economical benefits such as improving grid reliability, maximizing penetration of intermittent renewable energy sources, reducing the cost of energy production, etc. However, to realize those advantages, the costs of microgrid implementation may be bloated as microgrid need additional investment for the enabling technologies. Therefore, an appropriate approach to determine the economic viability of microgrid to quantify the values of microgrid benefits is needed. This study performs a techno-economic analysis of a small-scale grid-connected microgrid deployment which consists of photovoltaic (PV) and energy storage system. The analysis is done by considering the possible bussines models available in Indonesia where the microgrid test case is located, i.e, net metering for electricity bill, feed-in tariff for utilizing renewable energy, demand response (DR) implementation by exploiting battery roles in response of price variation during peak and off-peak period and assuming compensation is given every time microgrid is in islanded mode due to fault event occur in the main grid. The feasibility of each model is indicated by the microgrid’s net present value (NPV) and internal rate of return (IRR). The results show that further incentives from the utility or Government is required to make the small-scale microgrid deployment economically sustainable.
Copyright © 2018 Elsevier Ltd. All rights reserved.
Selection and peer-review under responsibility of the scientific committee of the 10th International Conference on Applied Energy (ICAE2018).
Keywords: Microgrid; Photovoltaic (PV); NPV; IRR.
* Corresponding author. Tel.: +61-8-9360-6417; fax: +61-8-9360-6346. E-mail address: [email protected]
Available online at www.sciencedirect.com
ScienceDirect
Energy Procedia 00 (2018) 000–000www.elsevier.com/locate/procedia
1876-6102 Copyright © 2018 Elsevier Ltd. All rights reserved.
Selection and peer-review under responsibility of the scientific committee of the 10th International Conference on Applied Energy (ICAE2018).
10
thInternational Conference on Applied Energy (ICAE2018), 22-25 August 2018, Hong Kong,
China
Techno-economic Evaluation of Utilizing a Small-Scale Microgrid
Yuli Astriani
a,b, GM Shafiullah
a*, Martin Anda
a, Hamzah Hilal
baSchool of Engineering and Information Technology, Murdoch University, Perth, Australia bNational Laboratory for Energy Conversion Technology, BPTT, Jakarta, Indonesia
Abstract
Microgrid deployment has offered technical and economical benefits such as improving grid reliability, maximizing penetration of intermittent renewable energy sources, reducing the cost of energy production, etc. However, to realize those advantages, the costs of microgrid implementation may be bloated as microgrid need additional investment for the enabling technologies. Therefore, an appropriate approach to determine the economic viability of microgrid to quantify the values of microgrid benefits is needed. This study performs a techno-economic analysis of a small-scale grid-connected microgrid deployment which consists of photovoltaic (PV) and energy storage system. The analysis is done by considering the possible bussines models available in Indonesia where the microgrid test case is located, i.e, net metering for electricity bill, feed-in tariff for utilizing renewable energy, demand response (DR) implementation by exploiting battery roles in response of price variation during peak and off-peak period and assuming compensation is given every time microgrid is in islanded mode due to fault event occur in the main grid. The feasibility of each model is indicated by the microgrid’s net present value (NPV) and internal rate of return (IRR). The results show that further incentives from the utility or Government is required to make the small-scale microgrid deployment economically sustainable.
Copyright © 2018 Elsevier Ltd. All rights reserved.
Selection and peer-review under responsibility of the scientific committee of the 10th International Conference on Applied Energy (ICAE2018).
Keywords: Microgrid; Photovoltaic (PV); NPV; IRR.
1.Introduction
Alongside with the emerging development of modern control, information, and communication technology, microgrid, a small and localized power system is introduced to solve some of conventional grid’s problems. Being localized, microgrid is expected to be able to manage its distributed energy resources (DERs) and connected loads. The microgrid will be operated in islanded mode in cases of fault in the main grid so that its load will still be supplied. Moreover, if it is needed, a demand management may be implemented to ensure the system stability or minimize the cost of energy in microgrid. It is also expected that deployment of microgrid could contribute to the maximization of the penetration of intermittent renewable energy sources. However, to enable the islanding operation or DR in microgrid require additional investment for the enabling technologies [1-4]. Therefore, a techno-economic analysis on microgrid is essential to determine whether the deployment of a microgrid is techno-economically feasible to be implemented.
Ref. [5] mentioned that the costs of microgrid development are consist of 50% for the generation, 15% for the controller, and 35% for the other remaining costs. Meanwhile, the benefits of microgrid deployment has been addressed in [6], which are; reducing the overall load baseline; avoiding peak energy costs and adding revenue by
exporting microgrid’s energy to the main grid; participating in the DR program to reduce energy cost and improving
supply reliability trough islanding capability. Many studies have been done to calculate costs and benefits ratio of microgrid deployment. In the Electric Research Power Institute (EPRI) technical report, it is stated that different approach is needed for analyzing cost-benefit of the smart grid as microgrid offer new benefits beyond basic services [7]. Two different approaches for modeling microgrid business case based on the perspectives of microgrid owner’s
interest either technical value or energy cost reduction benefits have been presented in [8]. The study in ref. [9] has performed an assessment for technical and economic potential of microgrids in California which resulted that the deployment of microgrid is economically viable for customers with peak loads higher than 1MW, while for the customers with peak loads below 1MW it may be feasible if there is any external funding available. A
techno-economic model based on the different combinations of microgrid’s services has been proposed in [10] considering
reliability service and price signals. Meanwhile in [11], a Monte Carlo methodology is used to perform techno-economic analysis for solar PV prosumer of Swedish residential sector and resulted that PV investor will likely have 71% chance to get 3% real return on investment, but the chance drops to 8% without subsidies. It also has been proved in [12] that market regulation affecting the benefits value in expanding microgrid deployment.
Based on above-mentioned studies, it can be deduced that predicting the economic feasibility of microgrid deployment is affected by the approach for the business model and the size of microgrid capacity. However, most of the current studies considered medium to large-scale microgrid (a capacity of higher than 1MW) and deployed in the developed countries where incentive is given for the deployment of renewable energy sources. On the other hand, this study evaluates the performance of a small scale microgrid considering technical, economical and environmental benefits based on a real test microgrid. This study will calculate IRR and NPV for a small scale microgrid considering few scenarios, i.e., with and without implementing DR based on the price variation; including the quantification value of reliability improvement; considering incentive is given for producing electricity from renewable energy including and assuming carbon tax is implemented.
2.Methodology
Author name / Energy Procedia 00 (2018) 000–000 3
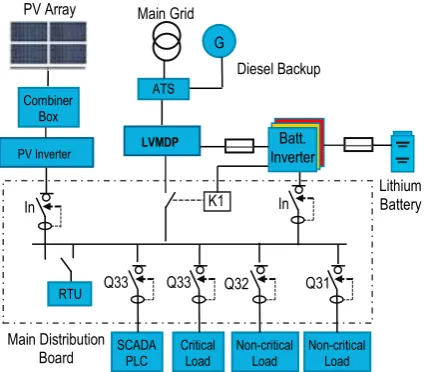
Fig. 1. Single line diagram 10kW PV Microgrid.
2.1. Estimation of PV Power
The PV system output power is computed based on [13] and using a yearly solar irradiations data of the studied location. The total energy is cumulated for 25 years based on the PV module lifetime and considering its degradation level, i.e. 2.5% in the first year and 0.5% for the following years [14].
2.2.Estimation of microgrid total cost and revenues
The deployment costs consist of the initial, operation and maintenance, and replacement costs. The initial cost is counted based on the total price of the purchased equipment, installation, and the software development cost. As the value of money differs with time, the calculation of the predicted operation and maintenance costs and the electricity price took the consideration of the inflation rate, i.e., 3.53% [15]. The replacement cost is calculated by assuming that the equipment price decreases around 15% per year, averaging from the report in [16]. Meanwhile, the salvage value is ignored because most of the equipment are used until the end of their lifespan.
On the other hand, the microgrid revenues are defined as follows:
Two approaches are used to calculate the income from the PV system, i.e., net metering and feed-in tariff. In the net metering method, the generated electricity from the PV system will be rated same as the customer's electricity price, i.e., $0.08 per kWh [17] for the BPPT building. Meanwhile, feed-in tariff method is used to simulate the effect if incentive is given. To generalize solar energy tariff, this study uses regulation [18] which stated that feed-in tariff for the solar power plant located in Java Island is 14.5 cents/kWh.
The revenue from battery system is calculated by assuming that DR program is implemented based on the price variation. Battery system is assumed to be charged during off-peak period and discharged during peak period. PT. PLN as the national electricity grid operator in Indonesia applies higher tariff during peak period with multiplication factor K = 1.5 [17]. The peak period is from 5 to 10 PM.
The reliability improvement revenue is calculated assuming that compensation is provided to the customer who faced supply interruption. Based on [19] it is stated that PLN is obliged to provide 35% reduction from consumer’s minimum electricity bill if the realization of power service quality level exceeds 10% above the level of standardized electricity service quality. However, as the microgrid capacity is much smaller
compared to the BPPT building total loads so that the microgrid can’t be considered to represent BPPT class
customer, therefore, the compensation refers to [20], i.e., value of service $2.5/kWh non-delivered energy (NDE). This reliability revenue then calculated based on the average interruption occurrence [21], i.e., 5 times interruption with total duration is 5 hours per month.
The last revenue is derived by assuming that carbon tax is yet implemented. It is suggested that for the initial Main Distribution
Board SCADA PLC Critical Load Non-critical Load Non-critical Load In
Q33
In
Q31 Q33
K1
RTU Q32
G PV Array Main Grid
Diesel Backup
LVMDP PV Inverter
Lithium Battery ATS
Combiner Box
implementation of carbon tax in Indonesia is $10/ton CO2 [22]. Based on [23], the emission factor for electricity generation in the studied location is 0.877 ton CO2/MWh.
2.3.Calculate cost-benefit ratio
Based on the predicted cash flow for 25 years, the microgrid’s NPV and IRR is calculated with considering the discounted rate, i.e., 7.5% [24]. The calculation of NPV and IRR will be simulated following the variation of the calculated costs and benefits in Section 2.2.
3.Results and Discussion
3.1.Energy from the PV system
The output energy from the PV system is calculated based on the solar irradiation data extracted from the pyranometer at BPPT in 2016. The predicted output power from the PV system of the microgrid is shown in Fig. 2 and the predicted generated energy from the PV system is 16232 kWh/yr. The total predicted output energy of the PV system for 25 years lifespan is presented in Fig. 3 assuming the same solar irradiation.
Fig. 2. The predicted output energy of the 10kWp PV array. Fig. 3. The predicted energy from the PV system.
3.2.Microgrid costs and revenues
Table 1 shows the microgrid deployment costs, noting that the installation cost of the studied microgrid is $46,803. The cost for battery system took almost 40% of the total deployment cost. It is mentioned in [25] that a bigger battery capacity may reduce customer dissatisfaction rate that also incurs a higher upfront cost which is not economically feasible. In this microgrid, battery system is needed to enable the islanding mode or could contribute to improving microgrid’s income by exploiting price deviation between peak and off-peak period.
Table 1. Microgrid deployment costs.
Item Price Lifetime Item Price Lifetime
PV Module $8,160 25 years MDB panel, combiner box, support module, etc. $1,848 20 years
PV Inverter $2,789 12.5 years SCADA system $2,414 -
Battery LiFePO4 $11,734 20 years PLC system $814 12 years
3 Battery Inverter $7,059 12.5 years Additional uninterruptible power system $450 5 years PC Server & Monitor $2,444 5 years Installation cost & software development $7,235
Weather Station $1,856 5 years Total Cost $46,803
Fig. 3 shows the cash flow of the microgrid running costs and revenues over 25 years. It can be seen from Fig. 3 that the revenue from carbon tax implementation is the smallest among other microgrid revenues. The revenue from battery system by implementing DR is also very small. This happens because of peak price period is only applicable in once allocated time per day, thus battery utilization as a response of price deviation between peak and off-peak period can also be done once a day and resulted in the small battery’s revenue. On the other hand, the biggest revenue is obtained with the feed-in tariff model.
Fig. 3. Cash flow diagram for microgrid running costs and revenues.
3.3.Microgrid feasibility
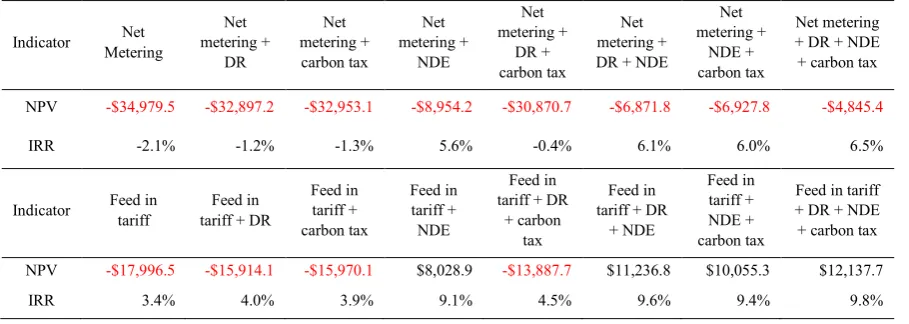
Table 2. Comparison of NPV and IRR based on the microgrid business cases.
Indicator Metering Net metering + Net DR
Net metering + carbon tax
Net metering +
NDE
Net metering +
DR + carbon tax
Net metering + DR + NDE
Net metering +
NDE + carbon tax
Net metering + DR + NDE + carbon tax
NPV -$34,979.5 -$32,897.2 -$32,953.1 -$8,954.2 -$30,870.7 -$6,871.8 -$6,927.8 -$4,845.4
IRR -2.1% -1.2% -1.3% 5.6% -0.4% 6.1% 6.0% 6.5%
Indicator Feed in tariff tariff + DR Feed in Feed in tariff + carbon tax
Feed in tariff + NDE
Feed in tariff + DR
+ carbon tax
Feed in tariff + DR
+ NDE
Feed in tariff + NDE + carbon tax
Feed in tariff + DR + NDE + carbon tax
NPV -$17,996.5 -$15,914.1 -$15,970.1 $8,028.9 -$13,887.7 $11,236.8 $10,055.3 $12,137.7
IRR 3.4% 4.0% 3.9% 9.1% 4.5% 9.6% 9.4% 9.8%
4.Conclusions and future work
The results of techno-economic analysis from this study shows that the deployment of a small scale microgrid equipped with modern control technologies for enabling microgrid services is not economically viable if only the net metering business model is considered. On the other hand, providing incentive for utilizing renewable sources such as in the feed-in tariff has significantly increased microgrid’s NPV and IRR. Meanwhile, the absence of price variation reduces the opportunity of DR implementation so that installing large battery storage for the purpose to participate in DR program may causing losses to the microgrid. Therefore, in evaluating microgrid feasibility, adding other microgrid revenues such as by quantifying reliability improvement as the result of installing energy storage and microgrid controller or including carbon tax revenue will increase microgrid viability. In the future work, sensitivity analysis needs to be simulated by varying the technologies, DERs size, and exploring other benefits of the microgrid such as providing frequency or voltage restoration to the main grid by forcing the battery system to charge or discharge following the system variation.
Acknowledgments
The authors would like to acknowledge the School of Engineering and Information Technology, Murdoch University, Australia for providing the research grant to pursue this research. One of the authors, Yuli Astriani acknowledges the scholarship support from Indonesia’s Ministry of Research, Technology and Higher Education through the Research and Innovation in Science and Technology Project (RISET-PRO).
References
[1] Stefanescu L, Stefanescu A, Ciora IL, Bogdanoiu C. ECONOMIC FEASIBILITY OF THE REENGINEERING PROJECTS. Journal of Advanced Research in Management 2010; 1(2):120-126.
[2] Orhan T, Shafiullah GM, Stojcevski A, Oo A, “A feasibility study on microgrid for various islands in Australia”, Proceedings in the 2014 Australasian Universities Power Engineering Conference (AUPEC), Perth, 2014.
[3] Shafiullah GM, “Hybrid renewable energy integration (HREI) system for subtropical climate in Central Queensland, Australia” Renewable Energy, Elsevier, vol. 96, pp. 1034-1053, 2016.
[4] Shoeb MA, Shafiullah GM, “Renewable Energy Integrated Islanded Microgrid for Sustainable Irrigation—A Bangladesh Perspective”, Energies, MDPI, vol. 11(5), 2018.
[5] Siemens. How Micorgrids Can Achieve Maximum Return on Investment (ROI): The Role of the Advanced Microgrid Controller. Energy Efficiency Markets, LLC. 2016. [Online] Available:
https://w3.usa.siemens.com/smartgrid/us/en/microgrid/Documents/MGK%20Guide%20to%20How%20Microgrids%20Achieve%20ROI% 20v5.pdf.
[7] Electric Power Research Institute (EPRI).Guidebook for Cost/Benefit Analysis of Smart Grid Demonstration Projects. Technical Report. 2012. [Online] Available: https://www.smartgrid.gov/files/Guidebook-Cost-Benefit-Analysis-Smart-Grid-Demonstration-Projects.pdf. [8] Morris GY, Abbey C, Wong S, Joós G, editors. Evaluation of the costs and benefits of Microgrids with consideration of services beyond
energy supply. 2012 IEEE Power and Energy Society General Meeting; 2012 22-26 July 2012.
[9] Singh, Pramod. Technical and economic potential of microgrids in California" (2017). Theses and projects. 33. [Online] Available: https://digitalcommons.humboldt.edu/etd/33
[10] Martínez Ceseña EA, Good N, Syrri ALA, Mancarella P. Techno-economic and business case assessment of multi-energy microgrids with co-optimization of energy, reserve and reliability services. Applied Energy. 2018; 210:896-913.
[11] Sommerfeldt N, Madani H. Revisiting the techno-economic analysis process for building-mounted, grid-connected solar photovoltaic systems: Part two - Application. Renewable and Sustainable Energy Reviews. 2017; 74:1394-404.
[12] Lo Prete C, Hobbs BF. A cooperative game theoretic analysis of incentives for microgrids in regulated electricity markets. Applied Energy. 2016; 169:524-41.
[13] How HOMER Calculates the PV Array Power Output. [Online] Available
https://www.homerenergy.com/support/docs/3.10/how_homer_calculates_the_pv_array_power_output.html. [Accessed: 11- Dec- 2017] [14] Canadian Solar, “Quartech CS6P-260 | 265P”, datasheet, Sep. 2015, [Online] Available:
https://www.canadiansolar.com/downloads/datasheets/na/Canadian_Solar-Datasheet-CS6PP_Quartech-v5.3_na.pdf.
[15] Bank Sentral Republik Indonesia. Data BI Rate. [Online] Available: https://www.bi.go.id/id/moneter/bi-rate/data/Default.aspx
[16] Fu, Ran, David Feldman, and Robert Margolis. U.S. Solar Photovoltaic System Cost Benchmark: Q1 2017. NREL/TP-6A20-68925. Golden, CO: National Renewable Energy Laboratory (NREL). September 2017. [Online] Available: https://www.nrel.gov/docs/fy17osti/68925.pdf.
[17] PT. PLN. Penetapan tarif Tenaga Listrik (Tariff Adjustment) Bulan April - Juni 2018. 2018. [Online] Available: http://www.pln.co.id/statics/uploads/2018/05/Tariff-Adjustment-April-Juni-2018-1.jpg.
[18] Indonesian Ministry of Energy and Mineral Resources. Regulation No.50/2017 Regarding the Utilization of Renewable Energy for Electricity Production. August 2017. [Online] Available:
http://jdih.esdm.go.id/peraturan/PerMen%20ESDM%20NO.%2050%20TAHUN%202017.pdf
[19] Indonesian Ministry of Energy and Mineral Resources. Regulation No.27/2017 Regarding The Quality of Service and Costs Associated with The Electricity Distribution by PT Perusahaan Listrik Negara (Persero). April 2017. [Online] Available:
http://jdih.esdm.go.id/peraturan/Permen%20ESDM%20No.%2027%20Thn%202017%20ttg%20Standar%20Mutu.pdf [20] Morris, G. On the Benefits and Costs of Microgrids. McGill University; 2012. [Online] Available:
http://digitool.library.mcgill.ca/webclient/StreamGate?folder_id=0&dvs=1527486755099~593
[21] Appendix Decision of The Director General of Electricity Regarding PT. PLN Quality of Service Standard 2017 of West Java Regional Business. February 2017. [Online] Available:
http://www.djk.esdm.go.id/pdf/Mutu%20Pelayanan%20PLN/2017/Regional%20Jawa%20Bagian%20Barat.pdf [22] Martha M. carbon tax for Indonesia: Time to act now. April 2019. [Online] Available:
http://www.thejakartapost.com/news/2014/04/29/carbon-tax-indonesia-time-act-now.html
[23] Director General of Electricity of Indonesian Ministry of Energy and Mineral Resources. GHG Emission Factor Electrical Power Interconnection System Year 2016. [Online] Available: http://www.djk.esdm.go.id/pdf/Faktor Emisi Gas Rumah Kaca/Faktor Emisi GRK Tahun 2016.pdf
[24] Bank Sentral Republik Indonesia. Data Inflasi. [Online] Available:https://www.bi.go.id/id/moneter/inflasi/data/Default.aspx