(UDC: 617.735:616.379-008.64:004.021)
An algorithm for identification of retinal microaneurysms
A. Shaeidi
Payame Noor University (PNU)
Department of Information and Communication Technology of PNU, Iran.
Abstract
Microaneurysms (MAs) identification is a critical step in diabetic retinopathy screening. Diabetic retinopathy is a major cause of blindness and microaneurysms are the first clinically observable manifestations of diabetic retinopathy. This paper describes a new digital image-processing algorithm for microaneurysm diagnosis in digital retinal images for diabetic retinopathy patients. The recorded 90000 pixels have been extracted from 135 color retinal images which have formed a learning data set of Microaneurysms and non-Microaneurysms. This our learning data set sample includes 50000 Microaneurysm pixels and 40000 non- Microaneurysm pixels. After a color normalisation and contrast enhancement preprocessing step, the color retinal image is segmented using Pixel-Level Microaneurysms Recognition and a Dynamic Thresholding technique. Then, the segmented regions were classified into two disjoint classes, Microaneurysms and non-Microaneurysms.
Having high precision, this approach demonstrates that computer assisted diagnosis removes many problems in the analysis with manual detection. The proposed approach was realized with full implementation of programming languages. Here, 135 retinal images were analyzed among which 70 images showed abnormalities (i.e. include DR), while in 65 cases the conditions were normal. Finally, in step test using classifier neural network, the system achieved (in percent) 98.5 sensitivity, 96.9 specificity features and 97.7 accuracy.
Keywords:Microaneurysms (MAs), Neural Network, Diabetic Retinopathy (DR).
Introduction
study because it is the most common cause of blindness, with a considerable social and economic impact of diabetic retinopathy screening.
According to the American Diabetes Association, 18.2 million of the American population, which constitutes 6.3% of the total population, has diabetes. In the United States alone, diabetes is responsible for 8% of legal blindness, making it the leading cause of blindness in people between 20 and 74 years of age [1-3]. In the reference [4] the author suggested an automated screening system for diabetic retinopathy for prompt diagnosis. Since the disorders exhibited in the early stage do not affect the vision, detection of the disease right at its onset can be done only if regular eye examination of the diabetic patients is performed.
This paper proposes an automated screening system that would detect early signs of non- proliferative diabetic retinopathy (NPDR). The contributions of this paper are twofold: (a) automated detection methods based on image processing for identifying lesions related to DR, and (b) a decision support system (DSS) for automated DR screening. Classification schemes for deducing the presence or absence of DR are developed and tested. A univariate approach has been devised to test the suitability of the classification mechanism with respect to the detection of retinopathy. Classification is performed by test data subjected to unsupervised learning. This approach has been developed for one particular feature, but the feature space can be extended depending on the number of disorders needed to be detected. The detection rule is developed based on binary-hypothesis testing problem, with simplification to the yes/no decisions. An analysis of the performance of the Bayes optimality criteria applied to DR is also presented.
The test data for the classification scheme is composed of the real retinal images obtained from Lions Eye Research Center at LSU, New Orleans. The data contains retinal images that belong to either background retinopathy, maculopathy, or preproliferative retinopathy. The DSS framework focuses mainly on microaneurysms as these are the early signs of DR and are present at all the stages as the disease progresses from mild to severe NPDR. The DR screening results obtained from the DSS are compared with the physician’s diagnosis to measure the system’s sensitivity.
Regular screening by an eye specialist is important for early detection and treatment of diabetic retinopathy. The care of diabetic retinopathy requires screening large number of patients (approximately 30,000 individuals per million of the total population [5,6]). Diabetic retinopathy screening may reduce the risk of blindness in these patients by 50% and can provide considerable cost savings to public health systems [7,8]. Screening has been shown to be cost effective [9], but there is insufficient number of ophthalmologists to screen all diabetics [10]. Most methods, however, require identification of retinopathy by expensive, specifically trained personnel [11].
Microaneurysms Identificatin
Pre-processing of Color Retinal Images
Enhancement of color images is a difficult task, not only because of the added dimension of data but also due to the added complexity of color perception. In order to further develop a
color image enhancement, input color coordinates of each pixel are
independently transformed into another set of color coordinates. The local
contrast enhancement technique has been used to enhance color retinal images
in this paper, which is shown in Fig. 1.
(A)
color retinal image(B)
After local contrast enhancementFig. 1. Retinal images (A) before and (B) after local contrast enhancement.
Figure 1. shows that the local contrast enhancement technique is very effective for enhancing color retinal images, because after this stage MAs became clearly shown.
Feature extraction
kinds of Thresholding (static and dynamic) reduce the amount of editing needed after image segmentation. But dynamic thresholding performance is better for extracting pixels from images. Image segmentation by Dynamic Thresholding is a powerful approach for images containing solid objects which are distinguishable from the background or other objects wit respect of pixel intensity values. The Dynamic Thresholding was bounded to T1≤T≤T2. The values T1 and T2 have been found experimentally: T1= 14 and T2=19 [20].
Classification
The final stage involved the development of a classification scheme that classifies the given retinal images according to abnormalities present in the retinal images and severity that they exhibit. Confidence levels needed to be estimated using statistical methods for all the estimates. Discriminating functions and algorithms (Neural Networks - NN) for distinguishing images based on the features present in the image need to be developed.
Neural networks are particularly suited to problems whose solution is complex and difficult to specify. They can process an abundance of data from which a response can be learned. With the ability to interpolate from previous learning, a neural network can achieve high levels of generalization and give the correct response to data that were not previously encountered. Neural Networks began with the pioneering work of McCulloch and Pitts (1943) [13]. A new approach to the pattern-recognition problem was introduced by Rosenblatt (1958) [14] in his work on the perceptron. Then an important problem encountered in the design of a multilayer perceptron was first treated by Minsky (1961) [15]. The backpropagation (BP) algorithm was developed by PaulWerbos [16] in 1974.
A neural network consists of individual neurons. Each neuron in a neural network acts as an independent processing element. Inputs and interconnection weights are processed by a summation function (typically a weighted summation) to yield a sum that is passed to a nonlinearity function, called the transfer function (typically a sigmoid).
The output of the nonlinearity is the output of the neuron. A neural network may consist of multiple layers of neurons interconnected with other neurons in the same or different layers. A neuron’s connection topology with other neurons may vary from fully connected to sparsely or even locally connected. Each layer is referred to as either an input layer, a hidden layer, or an output layer. Neural networks must ‘learn’ how to process inputs before they can be utilized in an application. The process of training a neural network involves adjusting the input weights on each neuron such that the output of the network is consistent with the desired output. This involves the development of a training file, which consists of data for each input node and the correct or desired response for each of the network’s output nodes. Once the network is trained, only the input data are provided to the network, which then ‘recalls’ the response it ‘learned’ during training.
Each classifier was quantitatively evaluated by independent unseen test sets. Table 1. indicates the Microaneurysms and non- Microaneurysms sample points used for the cross validation scheme.
Method Microaneurysm sample points
Non-Microaneurysm sample points
Training set
41000
29000
Validation set
9000
11000
Overall
50000
40000
Table 1. Microaneurysm and non-Microaneurysm pixel numbers for training and validation.
Each classifier’s performance is measured based on confusion matrices in terms of correctly classified Microaneurysms and Non-Microaneurysms as follows:
MA
Number of Microaneurysmpixels correctly classified E
Total number of Microaneurysm pixels
(1)
Non
Number of non Microaneurysmpixels correctly classified E
Total number of non Microaneurysm pixels
(2)
According (1) and (2), EMA and ENon represent the classifier’s generalization ability percentage to predict the new unseen Microaneurysm or Non-Microaneurysm test pixels correctly. We also measured the overall classification ability of each classifier by averaging the measures as follows (3):
2
MA Non
o
E E
E (3)
Resulits
In this paper we applied 135 retinal images where 70 image were abnormal (i.e. include DR) and 65 image were normal. This work started with the development of pre-processing techniques to improve image quality. The color contrast enhancement technique provided a use of a new technique called “local contrast enhancement”, which leaves the color contents of the
ophthalmologists who used a subjective scoring method in a marked fashion
and every image is divided into relatively small regions with roughly similar
contrast by local contrast enhancement technique. Also, Dynamic Thresholding
technique and Pixel-Level Microaneurysms Recognition
have been used in the
stage of image segmentation.
A back-propagation Neural Network has been used here. This type of neural network has been selected because there is a large amount of input/output data available, but no knowledge on how to relate them to the output. Almost 90000 pixel was achieved from above images. Each pixel of a fundus image was classified as Microaneurysms or non - Microaneurysms. Pixel classification is often a desirable objective in medical imaging. We are here interested in supervised classification methods, which consist of the two major stages.
the learning (training) stage, and
the testing stage
Therefore, our classifiers should
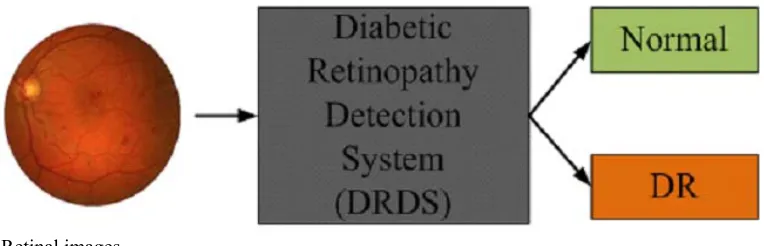
have the ability to form a decision boundary that minimizes the amount of misclassification for both pixel classes. Objects in an image can be represented in terms of dimensional feature vectors such as intensity, color, size, and shape which were used within the segmentation stage. The pixel classification approach to our retinal images can be regarded as a labeling process in which the goal is to assign to each pixel in the image a unique label that represents an anatomical-pathological structure. Feature selection is an important step in image analysis process. Fig. 2 shows that the proposed approach represents a new image which enters the system (DRDS), so that we are able to identify image's type (Normal or DR) by Artificial Intelligence Algorithms (AIA) and image processing algorithms (IPA).Retinal images
Fig. 2. Descriptive model of the proposed system (DRDS)
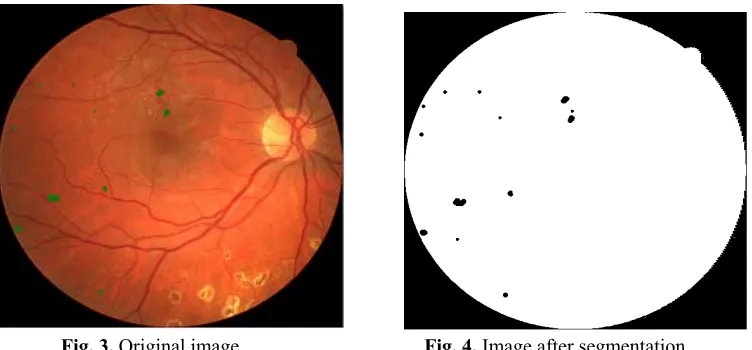
Fig. 3. Original image Fig. 4. Image after segmentation
The development of a statistical based pixel-level Microaneurysms recognition approach uses color information to classify the retinal Microaneurysms consequently after classification stage. The obtained results shown in Table 2 suggest that by biasing the classifier towards DR detection, it is possible to achieve 98.5% sensitivity, although at reduced specificity of 96.9%.; accuracy is 97.7% with 2.13 FP per image. Since sensitivity implies the presence of abnormality, this biasing towards sensitivity is reasonable.
Classifier
Threshold
Accuracy
Sensitivity
Specificity
BP-NN (15 hidden)
(T=0.5)
97.7%
98.5%
96.9%
Table 2. MLP neural networks accuracy for pixel-based classification
Discussion
The number of microaneurysms presented here reflectsthe severity of diabetic retinopathy which serve to predict future diseaseprogression. Furthermore, these findings suggest a simple and objectivemeasure that can be useful in monitoring treatment responsefor diabetes control. Measuring the turnover of MAs is more difficultthan determining the absolute number of MAs; however, this measuring providesdata about the dynamic nature of the disease that are not conveyedby the absolute count. It is not yet known whether the turnoverdata, for instance the number of newly formed MAs, would providea better indicator of disease progression, but intuitively itis likely to do so. The previous research on microaneurysms identification mainly relied on greylevel information and on small dataset of retinal images.
candidates, i.e. all patterns possibly corresponding to MA, which is achieved by diameter closing and an automatic threshold scheme. Then, features are extracted, which are used in the last step to automatically classify candidates into real MA and other objects; the classification relies on a kernel density estimation with variable bandwidth [20].
Although further evaluation of this algorithm on larger populations is still required, these results are promissing. Any serious form of DR is unlikely to be missed and this should make ophthalmologists confident in using this automatic method; the moderate number of FP should not increase too much the burden of image grading. The algorithm limitations can be summarized as: a) The proposed algorithm makes uses of the isolated microaneurysms color to characterize reddish regions. b) It cannot represent the color of all the microaneurysms found in images. A possible solution for this problem may be to detect microaneurysms in different regions of the image and then use their color to localize the others. Additionally, despite the enhanced appearance of the MAs provided by the preprocessing techniques, the diversity of MA brightness and size makes it difficult for an automatic algorithm to detect all MAs. The MAs usually appear in groups and therefore missing some of the very faint microaneurysms is not critical. However, when there are only few very faint MAs in the retina, our proposed algorithm may have limited performance.
Conclusions
In summary, an automated system for quantifying MAwas developed and compared with manual measurements. The automatedsystem was fast and was shown to be reliable, making it suitablefor processing studies containing large numbers of images. Thesystem also worked with color retinal images. The automated system may have a value in a screening context,in treatment evaluation, or for research on the dynamic natureand behavior of the MA population. In this paper, we have presented a method of automatic detection of MAs, based on Dynamic Thresholding and Neural Network (NN) for automatic classification. The algorithm was tested on a set of 135 images and we obtained a sensitivity of 98.5% and specificity of 96.9% ; accuracy was 97.7% with 2.13 FP per image.
References
D. S. Fong, L. Aiello, T.W. Gardner, et al, “Retinopathy in diabetes,” Diabetes Care. vol. 27, no. suppl 1, pp. S84–S87 (2004).
R. Klein, B. E. Klein, S. E. Moss, et al, “The Wisconsin epidemiologic study of diabetic retinopathy. II. Prevalence and risk of diabetic retinopathy when age at diagnosis is less than 30 years,” Archives of Ophthalmology, vol. 102, no. 4, pp. 520–526 (1984).
H. Buch, T. Vinding, N. V. Nielsen, “Prevalence and causes of visual impairment ac cord ing to World Health Organization and United States criteria in an aged, urban Scandina vian population: the Copenhagen City Eye Study,” Ophthalmology, vol. 108, no. 12, pp. 2347– 2357 (2001).
A. Shaeidi, A. Osareh, S. Ghanea, k-Nearest Neighbour Learning approach for diagnos ing of Retinal Haemorrhages pathology on Diabetic Retinopathy. 3rd Conference on In ternational and Knowledge Technology (IKT), Ferdowsi Univ of Mashhad Nov, 27-29 (2007)
Retinopathy Working Party, A protocol for screening for diabetic retinopathy in Europe
Diabetic Med,8:263-267 (1991).
N.J. Wareham, Cost-effectiveness of alternative methods for diabetic retinopathy screening [letter]. Diabetes Care, 16:844 (1993).
J.C. Javitt, J.K. Canner, A. Sommer, Cost effectiveness of current approaches to the con trol of retinopathy in type I diabetics. Ophthalmology, 96:255-264 (1989).
W.S. Foulds, A.M. McCuish, T. Barrie, et al. Diabetic retinopathy in the west of Scot land: in detection and prevalence, and the cost-effectiveness of a proposed screening programme.
HealthBull (Edin), 41:318-326 (1983).
I.N. Scobie, A.C. MacCuish, T. Barrie, F.D. Green, W.S. Foulds, Serious retinopa thy in a diabetic clinic: prevalence and therapeutic implications. Lancet, ii:520-521 (1981).
J.A. Pugh, J.M. Jacobson, W.A. Van Heuven, et al, Screening for diabetic retinopathy. The wide-angle retinal camera. Diabetes Care, 16:889-895 (1993).
J. Canny. A computational Approach to Edge Detection. IEEE Transactions on Pattern Analysis and Machine Intelligence, PAMI-8-6:679-698 (1986).
W. McCulloch, W. Pitts, A logical calculus of the ideas immanent in nervous active ty. Bulletin of Mathematical Biophysics, 7:115-133 (1943).
F. Rosenblatt, The Perceptron: A probabilistic model for information storage and orga nisation in the brain. Psychological Review, 65:386-408 (1958).
M.L. Minsky, Step towards artificial intelligence. Proceedings of the Institute of Radio
Engineers 49:8- 30 (1961)
Beyond Regression: New Tools for Prediction and Analysis in the Behavioral Sciences. Ph.D. dissertation Harvard University (1974).
S.C. Lee, E. T. Lee, R. M. Kingsley, et al, “Comparison of diagnosis of early retinal le sions of diabetic retinopathy between a computer system and human experts,” Archives of
Ophthalmology,vol. 119, no. 4, pp. 509–515 (2001).
Early Treatment Diabetic Retinopathy Study Research Group (ETDRS), “Grading diabetic retinopathy from stereoscopic colour fundus photographs–an extension of the modified Airlie House classification. ETDRS report number 10,” Ophthalmology, vol. 98, no. 5 suppl, pp. 786– 806(1991).
R.S. Newsom, C. Sinthanayothin, J. Boyce, Contrast Enhancement for Oral Fluorescein Angiograms. BJOP, 1:29-32 (1998).