INTRODUCTION
For the efficient use of water resources in the future a reliable picture of the changes in the hy
-drological regime which had already taken place under the influence of economic activities and of the consequences which may occur due to the planned catchment event, transforming the conditions of runoff formation and climatic fac
-tors, affecting the river flow, is required (Shik
-lomanov, 1979).
The change of watershed hydrologic cycle has been very obvious these years because of the global climate and human activity. Dynam
-ic binary cycle process, wh-ich includes natu
-ral and artificial water circulation, has been formed (Huang et al., 2002). Runoff is a key part of hydrological process. It directly reflects the effect of the change of area climate and hu
-man activity have on the hydrological process.
Annual runoff volume shows some certain regularity and strong randomness (Wang et al., 2002; Huang et al., 2006). Because of the dry climate and human activity, in recent years, river runoff has decreased tremendously. This caused a series of ecological environment problems, such as channel shrinkage, estuarine sedimentation, downstream river drying up, wetland degradation and loss of function of the river (Tang et al., 2012).
The main objective of the current study was to assess the impact of constructing reservoirs on the flood characteristics of Kazakhstan rivers during the spring season. The influence of reser
-voirs’ construction was evaluated in terms of the maximum discharge of the flood during spring season for the long-term period (1940–2012) of the Zhayyk, Ilek rivers (West Kazakhstan) and Tobyl river (Northern Kazakhstan). The method of river analogy was applied.
Accepted: 2019.03.16 Available online: 2019.04.01
Volume 20, Issue 5, May 2019, pages 229–234
https://doi.org/10.12911/22998993/105633
Assessment of Changes in the Maximum Flow of Kazakhstan
Plain Rivers
Dinara Arystambekova
1*, Daulet Jussupbekov
1, Aizhan Skakova
2,
Gulnar Kujibayeva
3, Kulash Mamirova
41 Department of Meteorology and Hydrology, Al-Farabi Kazakh National University, 050040, Almaty, Kazakhstan
2 Research Institute of Ecology, Al-Farabi Kazakh National University, 050040, Almaty, Kazakhstan
3 State Agency “Kazselezaschita”, 050000, Almaty, Kazakhstan
4 Department of Geography and Tourism, Kazakh National Women’s Teacher Training University, 050000,
Almaty, Kazakhstan
* Corresponding author’s e-mail: [email protected]
ABSTRACT
This paper presents an assessment of changes in maximum flow values (maximum discharge, m3/s) of the spring
flood caused by human activities on the rivers Zhayyk, Ilek and Tobyl. Statistical characteristics of the maximum
discharge of the spring flood of these rivers for the period of 1940–2012, 1938–2012, before and after the construc
-tion of the reservoirs, as well as for the long-term period of supervision were analyzed based on the actual as well as restored data. The values of the maximum discharge of the spring flood of various provisions were calculated. The total integrated curves of the maximum discharge of the spring flood were constructed.
MATERIAL AND METHODS
The main factor in the formation of the spring floods on the rivers of the basin, as well as in other areas of the plains of Kazakhstan is a snow storage basin, the degree of soil moisture and temperature. In the steppe zone the flow of the spring flood makes 60–70% annually, in a arid and semiarid zone – 98–100%.
Possessing many common natural features, the rivers of the considered basin differ in some local features, significantly and visually shown in their water regime. The surface water of the rivers of the basin is formed only during the thawing of snow cover. Thus, for example, the rivers of all three mentioned groups have the delivery prevail
-ing snow fram-ing the main phase of water regime – spring flood.
Spring flood (high water) on the rivers of area begins at an ice drift. On average, it comes in the first decade of April, and on the certain large riv
-ers arteries – in the second decade of this month. The beginning of a high water ranges from the middle of March until the end of April. The main wave (peak) of spring high water on the rivers of area usually passes to the middle of April, on the larger rivers in the first pentad of May (Surface water resources, 1959).
In this paper we consider the characteristics of the spring flood of flat rivers of Kazakhstan and the effects of human activities (dam impact) on them. For the purpose of this study, three riv
-ers and five hydrological gauging stations were selected as follows:
1. The river Zhayyk (Ural) – the Ural River, the third longest river in Europe, forms the tradi
-tional boundary between Europe and Asia. It rises in the Southeastern slopes of the Ural Mountains at 640 m above sea level and runs through Russia and Kazakhstan into the Caspi
-an Sea. According to different sources, the total river length varies from 2,428 to 2,534 km. The length of the Kazakhstan portion of the main Ural stream is 1,084 km. The total catchment area is about 220,000 km2. The paper presents
the calculations of gauging station at Zhayyk river – Kushum village. The Ural River plays a special role in the Caspian basin (Azov Bas, 2002; Lagutov, 1995), being the only free-flowing river in the region with a non-regulat
-ed hydrological regime in its lower and middle flow (Lagutov, 2008).
2. The river Ilek – the river is located in the Akto
-be region of Kazakhstan and the Orenburg re
-gion of Russia. It is the largest left-bank inflow of the Zhayyk river (Ural). In this calculation, two gauging stations located on the river Ilek were selected: the Ilek river in Aktobe and the Ilek river in Shelek village.
3. The Tobyl river (Tobol) is a river in Kazakh
-stan and Russia. It is the left and the most high-water tributary of the river Irtysh. The river To
-byl is formed at the confluence of the Bozbey river with the Kokpektysay river on the border of the eastern spurs of the southern Ural and Turgay country. We consider two gauging sta
-tions: the Tobyl river in Pridorozhnyi village and the Tobyl river in Kostanay. It is worth to mention that all the three rivers considered in this study are transboundary.
The characteristics of the spring flow of Zhayyk, Ilek and Tobyl rivers were obtained from the data base of Leningrad Hydrological Informa
-tion System of surface water and Kazakhstan Hy
-drometeorological services «Kazhydromet» from 1938 to 2012 year.
RESULTS AND DISCUSSION
The flow of the Zhayyk river in 1958 was dis
-turbed by the long-term regulation of Iriklinskoe reservoir and water abstraction for the needs of different sectors of the economy (Davletgaliev, 2011). Therefore, the characteristics of the spring flow were identified for different periods – before the construction of the reservoir (1940–57 years) and after (1958–12), as well as for long-term ob
-servation period from 1940 to 2012, taking into account the recovered conditionally-natural flow value and the recovery period in 1958–12.
The flow of gauging stations of Ilek river in Aktobe and Ilek river in Shelek village in 1975 was distorted by the influence of Aktobe and Sheleksky multiyear regulation reservoirs. Regarding this, the characteristics of the spring flow were calcu
-lated for different periods – before the creation of the reservoir (1940–74 years) and after its creation (1975–12), as well as for the long-term observa
-tion period from 1940 to 2012, taking into account value of the recovered conditionally-natural flow.
reservoir and river flow of Tobyl at gauging sta
-tion Kostanay was disturbed by the influence of Karatomarsk reservoir in 1965. Therefore, the spring flow characteristics were determined for different periods – before the creation of reser
-voirs (1938–76 and 1938–64 years) and after
-wards (1977–2012 and 1965–2012), as well as for long-term observation period from 1938 to 2012, taking into account the value of recovered conditionally-natural flow.
The restoration of natural flow was made dur
-ing their action with the application of the tech
-nique stated in (SP-33-101 – 2003, 2004; Arys
-tambekova et al., 2017) for the chosen gauging stations.
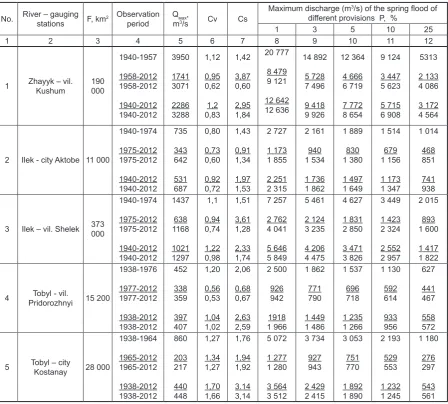
The results of calculating the characteristics of the spring flow on these gauging stations can be seen in Table 1.
The conditionally-natural flow of the Zhayyk river by the Kushum village for the period of
1958–12 was restored according to the natural annual flow of the Zhayyk river in the indicated gauging stations.
While analyzing the data given in table 1, it is possible to assess the influence of the reservoir construction on the maximum discharge dur
-ing the spr-ing flood (maximum flow). Thus, the maximum long-term average water flow of natu
-ral period from 1940 to 1957 in Kushum village was 3950 m³/s, and after the creation of the reser
-voir, its value decreased to 1741 m³/s. The aver
-age long-term value of the maximum discharge for conditionally-natural period (1940–2012) is 3288 m³/s. While comparing the value of maxi
-mum discharge for the periods of pre- (1940–57) and post-dam (1958–2012) construction, a 56% decrease can be seen.
At river Ilek gauging stations in Aktobe, the maximum discharge of the natural period from 1940 to 1974 amounted to 735 m³/s, after the
Table 1. Characteristics of maximum discharge of the spring flood (Qмах, m3/s)
No. River – gauging stations F, km2 Observation
period Qmмах3/s, Сv Cs
Maximum discharge (m3/s) of the spring flood of different provisions P, %
1 3 5 10 25
1 2 3 4 5 6 7 8 9 10 11 12
1 Zhayyk – vil. Kushum 190 000
1940-1957 1958-2012 1958-2012 1940-2012 1940-2012 3950 1741 3071 2286 3288 1,12 0,95 0,62 1,2 0,83 1,42 3,87 0,60 2,95 1,84 20 777 8 479 9 121 12 642 12 636 14 892 5 728 7 496 9 418 9 926 12 364 4 666 6 719 7 772 8 654 9 124 3 447 5 623 5 715 6 908 5313 2 133 4 086 3 172 4 564
2 Ilek - city Aktobe 11 000
1940-1974 1975-2012 1975-2012 1940-2012 1940-2012 735 343 642 531 687 0,80 0,73 0,60 0,92 0,72 1,43 0,91 1,34 1,97 1,53 2 727 1 173 1 855 2 251 2 315 2 161 940 1 534 1 736 1 862 1 889 830 1 380 1 497 1 649 1 514 679 1 156 1 173 1 347 1 014 468 851 741 938
3 Ilek – vil. Shelek 373 000
1940-1974 1975-2012 1975-2012 1940-2012 1940-2012 1437 638 1168 1021 1297 1,1 0,94 0,74 1,22 0,98 1,51 3,61 1,28 2,33 1,74 7 257 2 762 4 041 5 646 5 849 5 461 2 124 3 235 4 206 4 475 4 627 1 831 2 850 3 471 3 826 3 449 1 423 2 324 2 552 2 957 2 015 893 1 600 1 417 1 822
4 PridorozhnyiTobyl - vil. 15 200
1938-1976 1977-2012 1977-2012 1938-2012 1938-2012 452 338 359 397 407 1,20 0,56 0,53 1,04 1,02 2,06 0,68 0,67 2,63 2,59 2 500 926 942 1918 1 966 1 862 771 790 1 449 1 486 1 537 696 718 1 235 1 266 1 130 592 614 933 956 627 441 467 558 572
5 Tobyl – city Kostanay 28 000
creation of the reservoir, it decreased to 343 m³/s. The average long-term value of the maximum discharge for conditional natural period (1940-2012) equals 687 m³/s. A comparison of the val
-ue of maximum discharge for the natural period (1940–74) and after the dam construction period (1975–2012) showed that the flow has decreased by 53%. A similar pattern was observed in gaug
-ing station river Ilek in Shelek village. The com
-parison of the maximum discharge for the periods of pre-dam construction (1940–1974) amounted to 1437 m³/s, and post-dam construction (1975– 2012) showed that the maximum discharge af
-ter the dam construction has decreased to 638 m³/s. The average long-term value of the maxi
-mum discharge for the conditional natural period (1940–2012) equals 1297 m³/s. A comparison of the value of maximum discharge for the natural period (1940–74) and after the dam construction period (1975–2012) showed a decrease of 56%.
The impact of water reservoirs on the maxi
-mum discharge of the Tobyl river in the Pridoro
-zhnyi village and Kostanay city, as shown by the results of calculations (table 1), is significant as well. Thus, the gauging station of Tobyl river in Pridorozhnyi village, the maximum average an
-nual discharge for the reservoir preconstruction period from 1938 to 1976 amounted to 452 m³/s, and after the creation of the reservoir, its value decreased to 338 m³/s. The average long-term value of the maximum discharge for the condi
-tional preconstruction period (1938–2012) equals 407 m³/s. A comparison of the value of maximum discharge for the natural period (1938–76) and after the dam construction period (1977–2012) shows a decrease of 25%. The gauging station by the Tobyl river in Kostanay showed that the maximum average annual discharge for the natu
-ral period from 1938 to 1964 amounted to 860 m³/s, and after the creation of the reservoir, its value decreased to 203 m³/s. The average long-term value of the maximum discharge for the con
-ditional natural period (1938–2012) equals 448 m³/s. A comparison of the value of maximum dis
-charge for the natural period (1938–64) and after the dam construction period (1965–2012) shows (table 1) a decrease of 76%.
Table 1 also shows the values of the maxi
-mum discharge of the spring flood of various pro
-visions. It can be observed that in all cases, the value of the maximum discharge and the runoff depth of the spring flood for the calculated peri
-ods in these towns is described as Kritsky-Men
-kel’s curve at Cs = 2Cv.
The influence of ponds and reservoirs on a flow is considered by means of the coefficients of decrease calculated with the formula:
=1−W/(yh +W)
. . . uscap
drW К W = ) 1 ( . . . = − yavan yavan
. . .
.
. avan avan
nat y y
y = +
, (1)
where:
δ
– coefficient of change (decrease) of flow in unit shares;уh – the household drain changed under the influence of economic activity;
W – volume of filling of ponds and reservoirs.
The volume of filling of ponds and reservoirs, due to the lack of regime observations of water level, is determined approximately. The coeffi
-cient of change (decrease) of an annual drain for ponds and reservoirs on the rivers
δ
was accept-ed as equal according to the recommendations of normative documents (The methodical instruc
-tion etc, 1986).
The volume of filling of ponds and reservoirs was determined by drawdown coefficient: =1−W/(yh+W)
. . . uscap
drW К W = ) 1 ( . . . = − yavan yavan
. . .
.
. avan avan
nat y y
y = +
, (2)
where: Кdr – drawdown coefficient;
Wus.cap. – useful capacity of ponds or reser
-voirs, in one million m3.
Absolute changes (reduction) of flow were determined with the formula:
) /(
1−W yh +W
=
. . . uscap
drW К W = ) 1 ( . . . = −
yavan yavan
. . .
.
. avan avan
nat y y
y = +
, (3)
The natural flow was calculated using the expression:
) /(
1−W yh +W
=
. . . uscap
drW К W = ) 1 ( . . . = − yavan yavan
. . .
.
. avan avan
nat y y
y = + , (4)
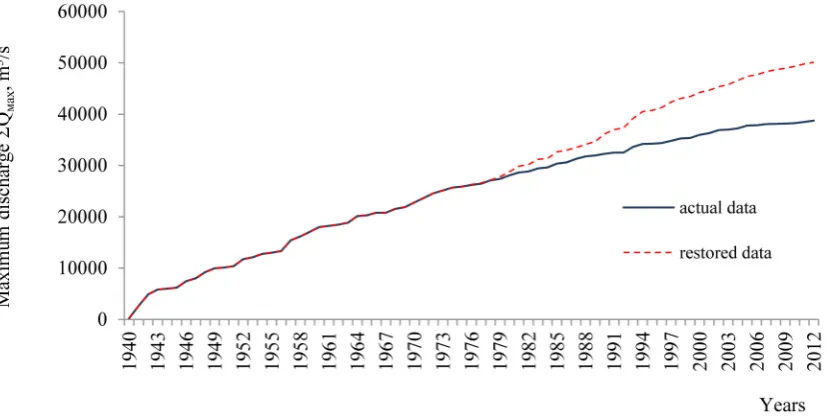
In the presence of the observation using the graphic method – the total integral of the curve – it is possible to determine the date of com
-mencement of anthropogenic changes and rough
-ly estimate the changed value of the spring flow (Arystambekova et al., 2018). As an example, the graphs of the total of the integral curves of maxi
-mum discharge of the spring flood to gauging sta
-tion of the river Ilek in Aktobe are presented in Figure 1.
(restored) value of the maximum discharge in 1976, the difference amounts to 96 m³/s.
CONCLUSIONS
The statistical methods stated above show significant influence of anthropogenic factors (reservoirs) on the maximum flow of the spring flood and allow us to estimate the changes of val
-ues of the maximum flow in number.
The analysis of the results shown in Table 1 helps to evaluate the effect of a significant regu
-lating impact of reservoirs for the maximum dis
-charge (reduction of the maximum dis-charge by 25–76%).
Analyzing the characteristics of river runoff has a very important theoretical and practical meaning. It helps obtaining further knowledge of the variation trend of Surface water resources. It also provides the science evidence for rational development of water resources and protection of Ecological Environment (Tang et al., 2012).
The existing water usage regulations (in particular the management strategy for the Irik
-linskoe reservoir) are extremely outdated and require significant and urgent adaptations to the current conditions. Both basin countries should participate in the development of an integrated water usage scheme which takes into account the interests of all water users. However, this issue should be approached with care considering the fact that environmental flow needs (biodiversity,
self-purification, etc.) are often neglected by re
-gional practitioners and decision-makers.
In order to secure proper consideration of environmental needs, the involvement of interna
-tional organizations is required (Lagutov, 2008).
REFERENCES
1. Arystambekova D., Davletgaliev S. 2017. Impact of Reservoir Construction on Flood Characteristics
of the Rivers of Kazakhstan during Spring Sea
-son. Jordan Journal of Civil Engineering, 12 (2), 314–322.
2. Arystambekova D., Davletgaliev S., Chigrinets A., Mussina A., Jussupbekov D. 2018. Estimation of Spring Runoff Characteristics of Lowland Rivers
in Kazakhstan. Journal of Environmental Manage
-ment and Tourism, 1 (17), 195–209.
3. Azov Bas. 2012. Proceedings. Azov Sea Basin Workshop. Green Don Publishing, Novocherkassk. 4. Davletgaliev S.K. 2011. The impact of economic
activity on the annual flow of the major rivers Zhaiyk - Caspian Basin. Geography and ecology issues, 1, 4–11.
5. Huang F., Zhang S.W., De Leeuw J. 2006. 20th century, 70 years Wuyu‘er Songnen Plain wetlands evolution River Basin. Natural Resources, 21 (6), 949–956.
6. Huang Q., Jiang X.H., Liu J.P. 2002. Binary mode variation of annual runoff of the Yellow River. Progress in Natural Science, 12 (8), 874–7. 7. Lagutov V. 1995. The mechanism of extermination
of fish stocks in South Russia and possibilities of
their restoration. Donskaia Rech, Novocherkassk. 8. Lagutov V. 2008. The Ural river Basin: Hydrology,
Characteristics and Water Use. Springer Science & Business Media B.V. Rescue of Sturgeon Species in the Ural River Basin, 129–161.
9. Shiklomanov I.A. 1979. Anthropogenic changes of water content of the rivers. Gidrometeoizdat, Leningrad.
10. SP-33-101–2003. 2004. Identification of the main settlement of hydrological characteristics. Gosstroi Russia, Moscow.
11. Surface water resources in areas of virgin and fal
-low lands, Kostanay Region of the Kazakh SSR,
edition 2. 1959. Gidrometeoizdat, Leningrad.
12. Tang X. L., Li J. F., Lv X., Long H. L. 2012. Analy
-sis of the Characteristics of Runoff in Manasi River Basin in the Past 50 Years. Procedia Environmental Sciences, 13, 1354–1362
13. The methodical instruction according to influence of economic activity on a drain of the average and big rivers and recovery of its characteristics. 1986. Gidrometeoizdat, Leningrad.
14. Wang G.X, Cheng G.D. 2002. The last 50 years in
the Hexi Corridor region variation of the ecologi
-cal environment and comprehensive countermea